
An official website of the United States government
An official website of the United States government
The .gov means it's official.
Federal government websites often end in .gov or .mil. Before sharing sensitive information,
make sure you're on a federal government site.
The site is secure.
The
https:// ensures that you are connecting to the official website and that any
information you provide is encrypted and transmitted securely.
All, installation, maintenance, and repair workers not listed separately.
Employment estimate and mean wage estimates for this occupation:
| Employment (1) | Employment RSE (3) |
Mean hourly wage |
Mean annual wage (2) |
Wage RSE (3) |
|---|---|---|---|---|
| 157,030 | 2.1 % | $20.70 | $43,050 | 0.5 % |
Percentile wage estimates for this occupation:
| Percentile | 10% | 25% | 50% (Median) |
75% | 90% |
|---|---|---|---|---|---|
| Hourly Wage | $11.84 | $14.69 | $18.90 | $25.40 | $31.31 |
| Annual Wage (2) | $24,630 | $30,550 | $39,320 | $52,830 | $65,120 |
Industries with the highest published employment and wages for this occupation are provided. For a list of all industries with employment in this occupation, see the Create Customized Tables function.
Industries with the highest levels of employment in this occupation:
| Industry | Employment (1) | Percent of industry employment | Hourly mean wage | Annual mean wage (2) |
|---|---|---|---|---|
| Services to Buildings and Dwellings | 15,890 | 0.74 | $18.07 | $37,590 |
| Federal Executive Branch (OES Designation) | 11,290 | 0.56 | $27.32 | $56,820 |
| Merchant Wholesalers, Durable Goods (4232, 4233, 4235, 4236, 4237, and 4239 only) | 9,650 | 0.69 | $21.02 | $43,710 |
| Other Miscellaneous Store Retailers | 8,680 | 2.50 | $17.58 | $36,570 |
| Building Finishing Contractors | 7,120 | 0.88 | $19.53 | $40,620 |
Industries with the highest concentration of employment in this occupation:
| Industry | Employment (1) | Percent of industry employment | Hourly mean wage | Annual mean wage (2) |
|---|---|---|---|---|
| Other Miscellaneous Store Retailers | 8,680 | 2.50 | $17.58 | $36,570 |
| Personal and Household Goods Repair and Maintenance | 1,600 | 2.04 | $17.38 | $36,150 |
| Direct Selling Establishments | 2,260 | 1.69 | $19.70 | $40,970 |
| Other Miscellaneous Manufacturing | 3,830 | 1.32 | $20.29 | $42,190 |
| Other Textile Product Mills | 730 | 1.15 | $20.25 | $42,110 |
Top paying industries for this occupation:
| Industry | Employment (1) | Percent of industry employment | Hourly mean wage | Annual mean wage (2) |
|---|---|---|---|---|
| Pipeline Transportation of Natural Gas | 170 | 0.61 | $36.77 | $76,480 |
| Natural Gas Distribution | 500 | 0.46 | $36.14 | $75,170 |
| Chemical Manufacturing (3251, 3252, 3253, and 3259 only) | 220 | 0.06 | $34.99 | $72,790 |
| Motor Vehicle Manufacturing | 60 | 0.03 | $34.26 | $71,270 |
| Postal Service (federal government) | 330 | 0.05 | $33.85 | $70,410 |
States and areas with the highest published employment, location quotients, and wages for this occupation are provided. For a list of all areas with employment in this occupation, see the Create Customized Tables function.
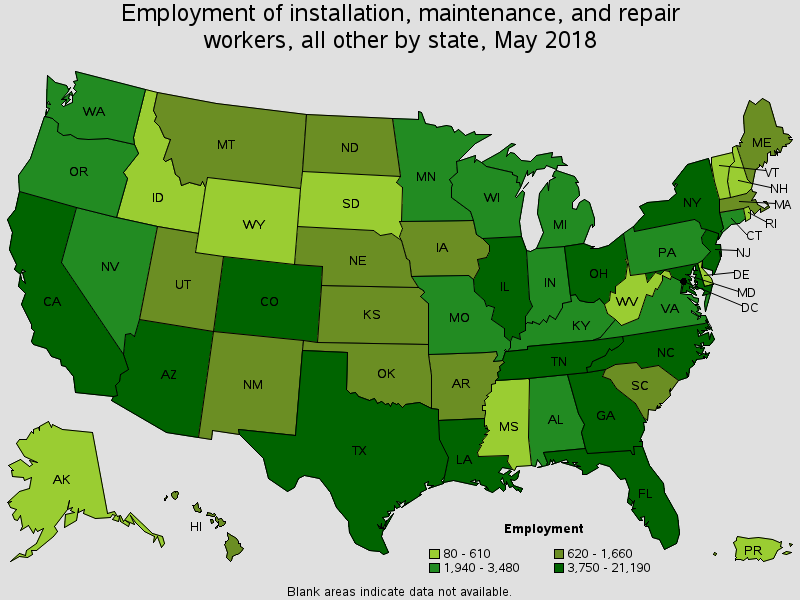
States with the highest employment level in this occupation:
| State | Employment (1) | Employment per thousand jobs | Location quotient (9) | Hourly mean wage | Annual mean wage (2) |
|---|---|---|---|---|---|
| California | 21,190 | 1.25 | 1.15 | $22.21 | $46,210 |
| Florida | 15,100 | 1.75 | 1.62 | $17.50 | $36,390 |
| Texas | 10,370 | 0.86 | 0.79 | $19.87 | $41,320 |
| Illinois | 9,360 | 1.56 | 1.44 | $23.21 | $48,290 |
| New York | 6,860 | 0.73 | 0.67 | $19.42 | $40,390 |
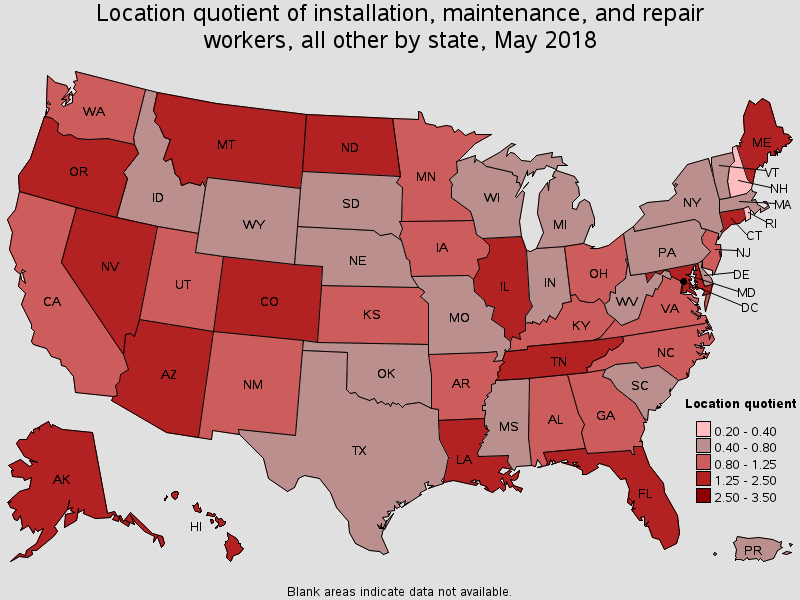
States with the highest concentration of jobs and location quotients in this occupation:
| State | Employment (1) | Employment per thousand jobs | Location quotient (9) | Hourly mean wage | Annual mean wage (2) |
|---|---|---|---|---|---|
| Louisiana | 4,740 | 2.47 | 2.28 | $21.29 | $44,290 |
| Hawaii | 1,310 | 2.04 | 1.88 | $29.01 | $60,340 |
| Maryland | 5,420 | 2.02 | 1.86 | $21.49 | $44,700 |
| Maine | 1,220 | 2.01 | 1.86 | $20.13 | $41,870 |
| Tennessee | 5,910 | 2.00 | 1.84 | $18.05 | $37,540 |
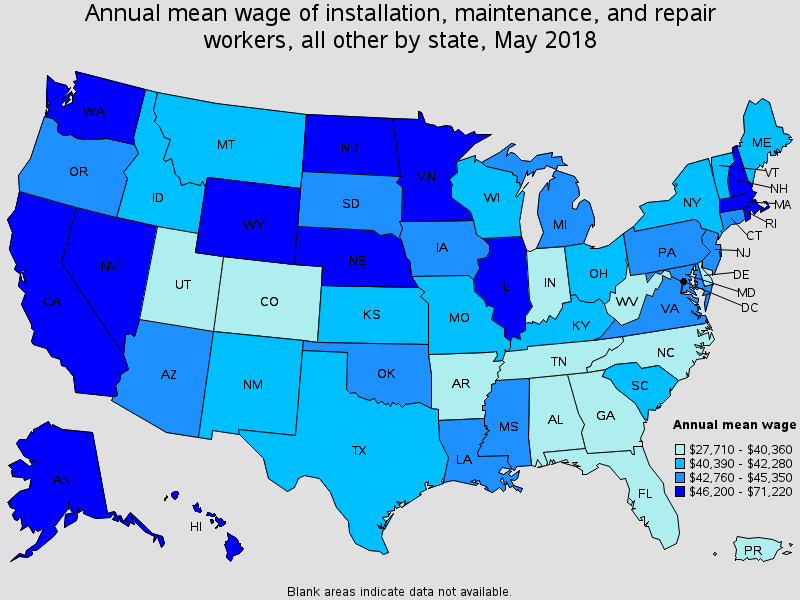
Top paying States for this occupation:
| State | Employment (1) | Employment per thousand jobs | Location quotient (9) | Hourly mean wage | Annual mean wage (2) |
|---|---|---|---|---|---|
| Alaska | 550 | 1.74 | 1.60 | $34.24 | $71,220 |
| Hawaii | 1,310 | 2.04 | 1.88 | $29.01 | $60,340 |
| District of Columbia | 200 | 0.28 | 0.25 | $26.99 | $56,140 |
| Washington | 2,960 | 0.91 | 0.84 | $26.73 | $55,610 |
| Nebraska | 620 | 0.63 | 0.59 | $25.01 | $52,020 |
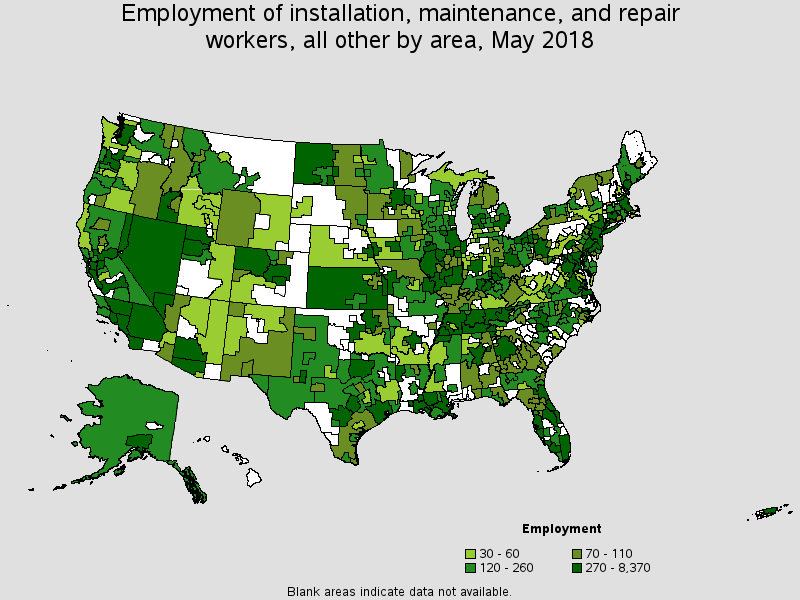
Metropolitan areas with the highest employment level in this occupation:
| Metropolitan area | Employment (1) | Employment per thousand jobs | Location quotient (9) | Hourly mean wage | Annual mean wage (2) |
|---|---|---|---|---|---|
| New York-Newark-Jersey City, NY-NJ-PA | 8,370 | 0.88 | 0.81 | $19.49 | $40,540 |
| Los Angeles-Long Beach-Anaheim, CA | 7,150 | 1.17 | 1.08 | $22.34 | $46,480 |
| Chicago-Naperville-Elgin, IL-IN-WI | 6,430 | 1.38 | 1.28 | $24.67 | $51,320 |
| Miami-Fort Lauderdale-West Palm Beach, FL | 3,830 | 1.48 | 1.36 | $17.88 | $37,190 |
| Washington-Arlington-Alexandria, DC-VA-MD-WV | 3,290 | 1.05 | 0.97 | $22.83 | $47,490 |
| Phoenix-Mesa-Scottsdale, AZ | 3,200 | 1.56 | 1.44 | $20.46 | $42,560 |
| Atlanta-Sandy Springs-Roswell, GA | 3,090 | 1.15 | 1.06 | $19.07 | $39,660 |
| Dallas-Fort Worth-Arlington, TX | 2,970 | 0.83 | 0.77 | $20.35 | $42,320 |
| Houston-The Woodlands-Sugar Land, TX | 2,580 | 0.86 | 0.80 | $20.97 | $43,610 |
| San Francisco-Oakland-Hayward, CA | 2,400 | 0.99 | 0.92 | $26.41 | $54,940 |
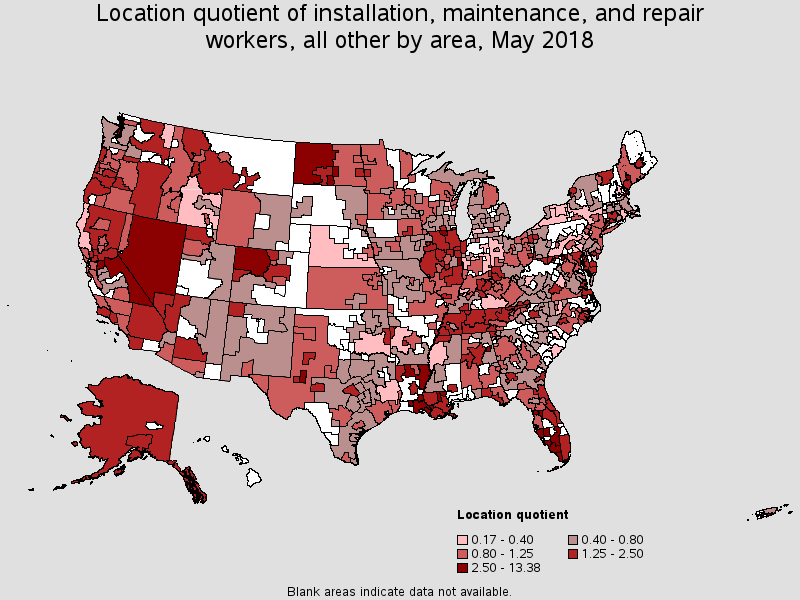
Metropolitan areas with the highest concentration of jobs and location quotients in this occupation:
| Metropolitan area | Employment (1) | Employment per thousand jobs | Location quotient (9) | Hourly mean wage | Annual mean wage (2) |
|---|---|---|---|---|---|
| Bremerton-Silverdale, WA | 1,290 | 14.52 | 13.38 | $28.26 | $58,780 |
| Anniston-Oxford-Jacksonville, AL | 290 | 6.55 | 6.04 | $22.59 | $47,000 |
| Cape Coral-Fort Myers, FL | 1,220 | 4.57 | 4.21 | $16.78 | $34,910 |
| Homosassa Springs, FL | 140 | 4.21 | 3.88 | $17.02 | $35,410 |
| Naples-Immokalee-Marco Island, FL | 610 | 4.18 | 3.85 | $16.11 | $33,500 |
| Midland, TX | 410 | 4.05 | 3.73 | $21.02 | $43,710 |
| Hagerstown-Martinsburg, MD-WV | 390 | 3.77 | 3.48 | $21.94 | $45,640 |
| Hammond, LA | 160 | 3.72 | 3.43 | $18.01 | $37,450 |
| Portsmouth, NH-ME | 340 | 3.59 | 3.31 | $24.99 | $51,970 |
| Lewiston-Auburn, ME | 160 | 3.25 | 2.99 | $18.46 | $38,400 |
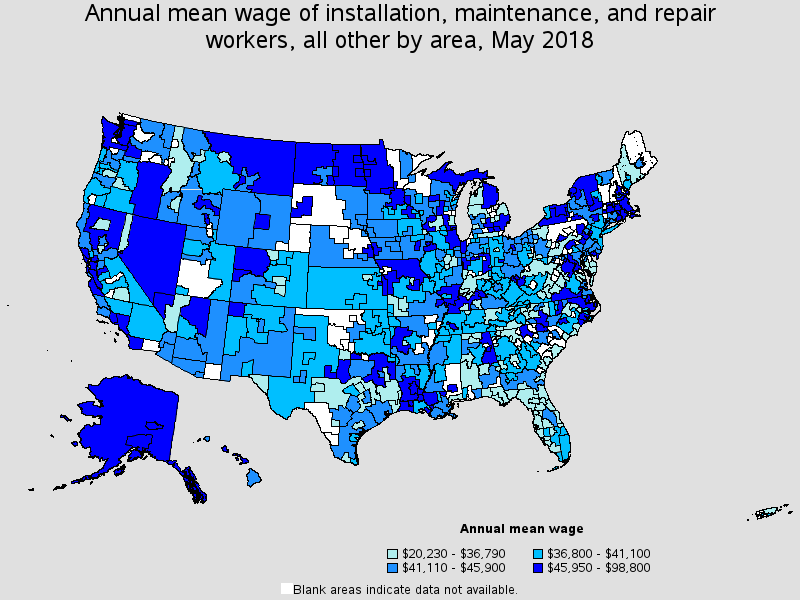
Top paying metropolitan areas for this occupation:
| Metropolitan area | Employment (1) | Employment per thousand jobs | Location quotient (9) | Hourly mean wage | Annual mean wage (2) |
|---|---|---|---|---|---|
| Urban Honolulu, HI | (8) | (8) | (8) | $30.52 | $63,480 |
| Alexandria, LA | 130 | 2.13 | 1.97 | $29.87 | $62,130 |
| Vallejo-Fairfield, CA | 200 | 1.46 | 1.35 | $29.53 | $61,420 |
| Grand Forks, ND-MN | 50 | 1.02 | 0.94 | $29.26 | $60,860 |
| Fairbanks, AK | (8) | (8) | (8) | $28.91 | $60,140 |
| Jefferson City, MO | 60 | 0.83 | 0.76 | $28.44 | $59,140 |
| Bremerton-Silverdale, WA | 1,290 | 14.52 | 13.38 | $28.26 | $58,780 |
| Cape Girardeau, MO-IL | (8) | (8) | (8) | $27.81 | $57,850 |
| Flagstaff, AZ | 40 | 0.58 | 0.54 | $27.60 | $57,410 |
| Salinas, CA | (8) | (8) | (8) | $27.10 | $56,370 |
Nonmetropolitan areas with the highest employment in this occupation:
| Nonmetropolitan area | Employment (1) | Employment per thousand jobs | Location quotient (9) | Hourly mean wage | Annual mean wage (2) |
|---|---|---|---|---|---|
| Southwest Louisiana nonmetropolitan area | 570 | 8.20 | 7.55 | $22.68 | $47,180 |
| Northwest Colorado nonmetropolitan area | 470 | 3.91 | 3.60 | $22.86 | $47,550 |
| West Central Illinois nonmetropolitan area | 400 | 2.29 | 2.11 | $18.80 | $39,110 |
| Kansas nonmetropolitan area | 360 | 0.93 | 0.86 | $19.03 | $39,590 |
| West North Dakota nonmetropolitan area | 360 | 2.95 | 2.72 | $26.47 | $55,050 |
Nonmetropolitan areas with the highest concentration of jobs and location quotients in this occupation:
| Nonmetropolitan area | Employment (1) | Employment per thousand jobs | Location quotient (9) | Hourly mean wage | Annual mean wage (2) |
|---|---|---|---|---|---|
| Southwest Louisiana nonmetropolitan area | 570 | 8.20 | 7.55 | $22.68 | $47,180 |
| Northwest Colorado nonmetropolitan area | 470 | 3.91 | 3.60 | $22.86 | $47,550 |
| Nevada nonmetropolitan area | 340 | 3.54 | 3.26 | $23.65 | $49,190 |
| South Florida nonmetropolitan area | 260 | 3.48 | 3.21 | $18.77 | $39,050 |
| Eastern Sierra-Mother Lode Region of California nonmetropolitan area | 200 | 3.32 | 3.06 | $19.64 | $40,850 |
Top paying nonmetropolitan areas for this occupation:
| Nonmetropolitan area | Employment (1) | Employment per thousand jobs | Location quotient (9) | Hourly mean wage | Annual mean wage (2) |
|---|---|---|---|---|---|
| Alaska nonmetropolitan area | 210 | 2.00 | 1.84 | $47.50 | $98,800 |
| North Missouri nonmetropolitan area | 70 | 0.60 | 0.56 | $29.52 | $61,400 |
| Western Washington nonmetropolitan area | 60 | 0.51 | 0.47 | $29.25 | $60,830 |
| Central Indiana nonmetropolitan area | 40 | 0.24 | 0.22 | $26.63 | $55,400 |
| West North Dakota nonmetropolitan area | 360 | 2.95 | 2.72 | $26.47 | $55,050 |
These estimates are calculated with data collected from employers in all industry sectors, all metropolitan and nonmetropolitan areas, and all states and the District of Columbia. The top employment and wage figures are provided above. The complete list is available in the downloadable XLS files.
The percentile wage estimate is the value of a wage below which a certain percent of workers fall. The median wage is the 50th percentile wage estimate--50 percent of workers earn less than the median and 50 percent of workers earn more than the median. More about percentile wages.
(1) Estimates for detailed occupations do not sum to the totals because the totals include occupations not shown separately. Estimates do not include self-employed workers.
(2) Annual wages have been calculated by multiplying the hourly mean wage by a "year-round, full-time" hours figure of 2,080 hours; for those occupations where there is not an hourly wage published, the annual wage has been directly calculated from the reported survey data.
(3) The relative standard error (RSE) is a measure of the reliability of a survey statistic. The smaller the relative standard error, the more precise the estimate.
(8) Estimate not released.
(9) The location quotient is the ratio of the area concentration of occupational employment to the national average concentration. A location quotient greater than one indicates the occupation has a higher share of employment than average, and a location quotient less than one indicates the occupation is less prevalent in the area than average.
Other OES estimates and related information:
May 2018 National Occupational Employment and Wage Estimates
May 2018 State Occupational Employment and Wage Estimates
May 2018 Metropolitan and Nonmetropolitan Area Occupational Employment and Wage Estimates
May 2018 National Industry-Specific Occupational Employment and Wage Estimates
Last Modified Date: March 29, 2019