
An official website of the United States government
An official website of the United States government
The .gov means it's official.
Federal government websites often end in .gov or .mil. Before sharing sensitive information,
make sure you're on a federal government site.
The site is secure.
The
https:// ensures that you are connecting to the official website and that any
information you provide is encrypted and transmitted securely.
Set up, operate, or tend machines to crush, grind, or polish materials, such as coal, glass, grain, stone, food, or rubber.
Employment estimate and mean wage estimates for this occupation:
| Employment (1) | Employment RSE (3) |
Mean hourly wage |
Mean annual wage (2) |
Wage RSE (3) |
|---|---|---|---|---|
| 31,890 | 2.9 % | $18.30 | $38,060 | 0.7 % |
Percentile wage estimates for this occupation:
| Percentile | 10% | 25% | 50% (Median) |
75% | 90% |
|---|---|---|---|---|---|
| Hourly Wage | $11.69 | $13.95 | $17.50 | $21.97 | $25.80 |
| Annual Wage (2) | $24,310 | $29,020 | $36,400 | $45,700 | $53,650 |
Industries with the highest published employment and wages for this occupation are provided. For a list of all industries with employment in this occupation, see the Create Customized Tables function.
Industries with the highest levels of employment in this occupation:
| Industry | Employment (1) | Percent of industry employment | Hourly mean wage | Annual mean wage (2) |
|---|---|---|---|---|
| Nonmetallic Mineral Product Manufacturing | 6,220 | 1.49 | $18.36 | $38,190 |
| Nonmetallic Mineral Mining and Quarrying | 3,620 | 3.66 | $20.44 | $42,510 |
| Grain and Oilseed Milling | 3,310 | 5.57 | $18.04 | $37,530 |
| Animal Food Manufacturing | 1,460 | 2.36 | $15.60 | $32,440 |
| Merchant Wholesalers, Durable Goods (4232, 4233, 4235, 4236, 4237, and 4239 only) | 1,220 | 0.09 | $17.29 | $35,960 |
Industries with the highest concentration of employment in this occupation:
| Industry | Employment (1) | Percent of industry employment | Hourly mean wage | Annual mean wage (2) |
|---|---|---|---|---|
| Grain and Oilseed Milling | 3,310 | 5.57 | $18.04 | $37,530 |
| Nonmetallic Mineral Mining and Quarrying | 3,620 | 3.66 | $20.44 | $42,510 |
| Animal Food Manufacturing | 1,460 | 2.36 | $15.60 | $32,440 |
| Metal Ore Mining | 700 | 1.74 | $25.77 | $53,600 |
| Nonmetallic Mineral Product Manufacturing | 6,220 | 1.49 | $18.36 | $38,190 |
Top paying industries for this occupation:
| Industry | Employment (1) | Percent of industry employment | Hourly mean wage | Annual mean wage (2) |
|---|---|---|---|---|
| Coal Mining | 190 | 0.38 | $29.51 | $61,380 |
| Electric Power Generation, Transmission and Distribution | 40 | 0.01 | $28.59 | $59,460 |
| Support Activities for Mining | 70 | 0.02 | $27.18 | $56,530 |
| Metal Ore Mining | 700 | 1.74 | $25.77 | $53,600 |
| Sugar and Confectionery Product Manufacturing | 210 | 0.28 | $24.58 | $51,140 |
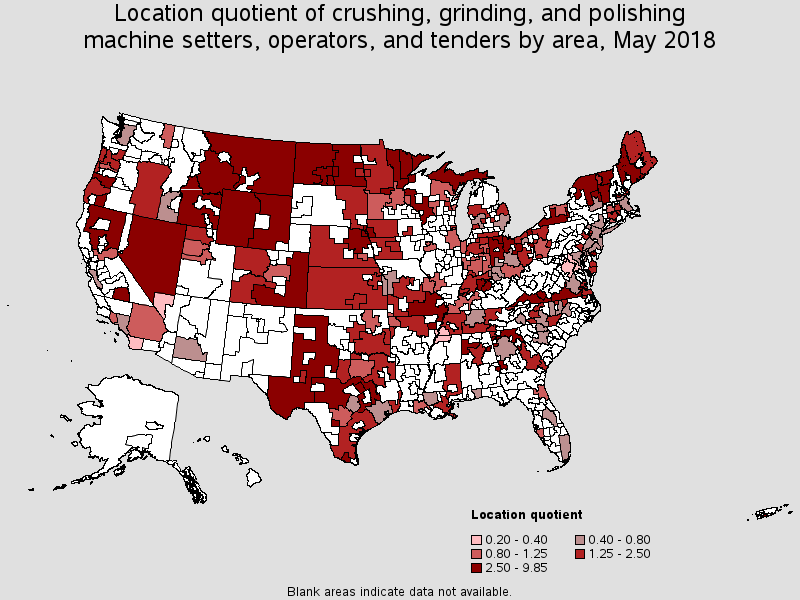
States and areas with the highest published employment, location quotients, and wages for this occupation are provided. For a list of all areas with employment in this occupation, see the Create Customized Tables function.
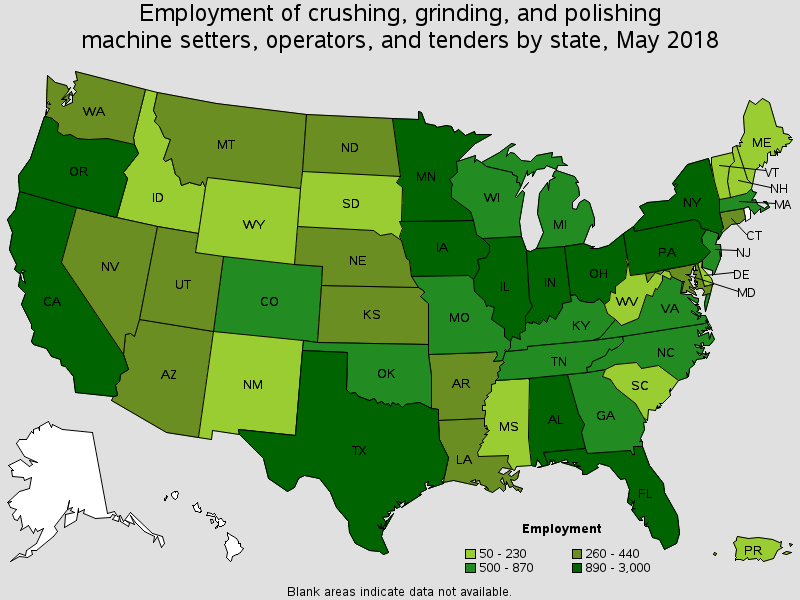
States with the highest employment level in this occupation:
| State | Employment (1) | Employment per thousand jobs | Location quotient (9) | Hourly mean wage | Annual mean wage (2) |
|---|---|---|---|---|---|
| California | 3,000 | 0.18 | 0.80 | $16.19 | $33,680 |
| Texas | 2,690 | 0.22 | 1.01 | $16.71 | $34,760 |
| Ohio | 1,620 | 0.30 | 1.36 | $17.24 | $35,860 |
| Illinois | 1,370 | 0.23 | 1.04 | $19.15 | $39,820 |
| Iowa | 1,310 | 0.85 | 3.85 | $18.07 | $37,590 |
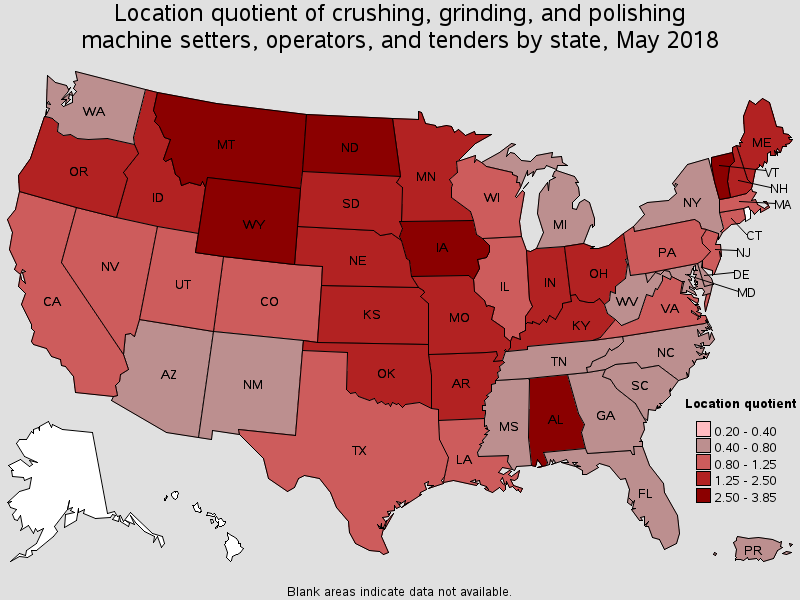
States with the highest concentration of jobs and location quotients in this occupation:
| State | Employment (1) | Employment per thousand jobs | Location quotient (9) | Hourly mean wage | Annual mean wage (2) |
|---|---|---|---|---|---|
| Iowa | 1,310 | 0.85 | 3.85 | $18.07 | $37,590 |
| North Dakota | 340 | 0.82 | 3.71 | $21.71 | $45,160 |
| Vermont | 190 | 0.62 | 2.80 | $22.26 | $46,300 |
| Wyoming | 150 | 0.57 | 2.58 | $32.11 | $66,790 |
| Montana | 260 | 0.56 | 2.53 | $20.32 | $42,270 |
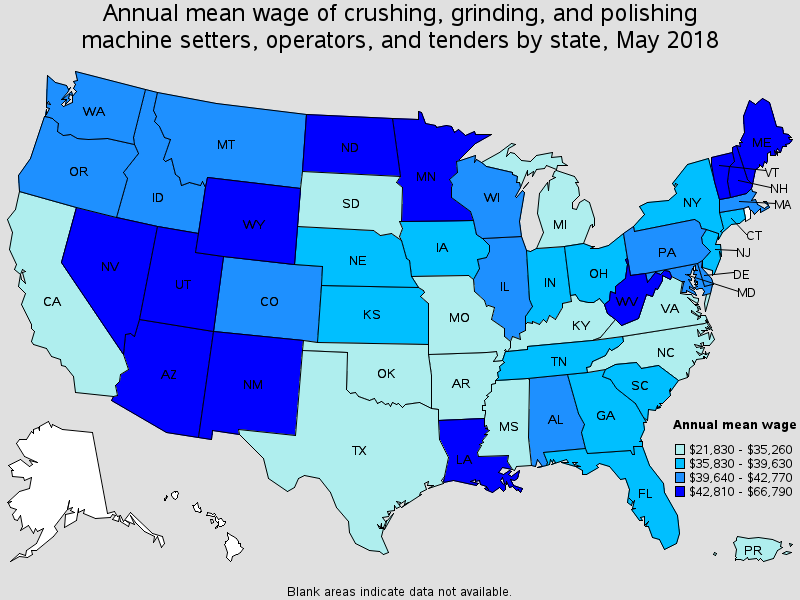
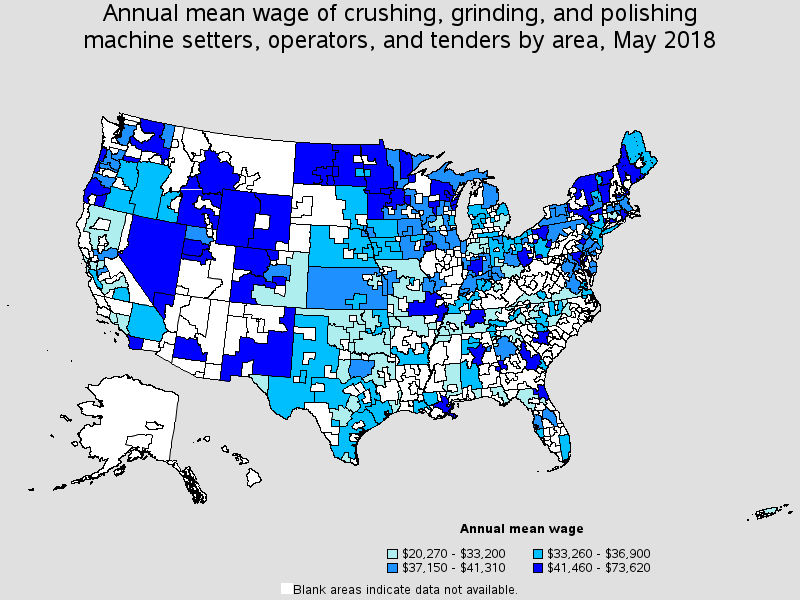
Top paying States for this occupation:
| State | Employment (1) | Employment per thousand jobs | Location quotient (9) | Hourly mean wage | Annual mean wage (2) |
|---|---|---|---|---|---|
| Wyoming | 150 | 0.57 | 2.58 | $32.11 | $66,790 |
| Nevada | 260 | 0.19 | 0.87 | $27.18 | $56,540 |
| West Virginia | 80 | 0.12 | 0.53 | $24.24 | $50,420 |
| Vermont | 190 | 0.62 | 2.80 | $22.26 | $46,300 |
| New Mexico | 120 | 0.15 | 0.67 | $22.20 | $46,180 |
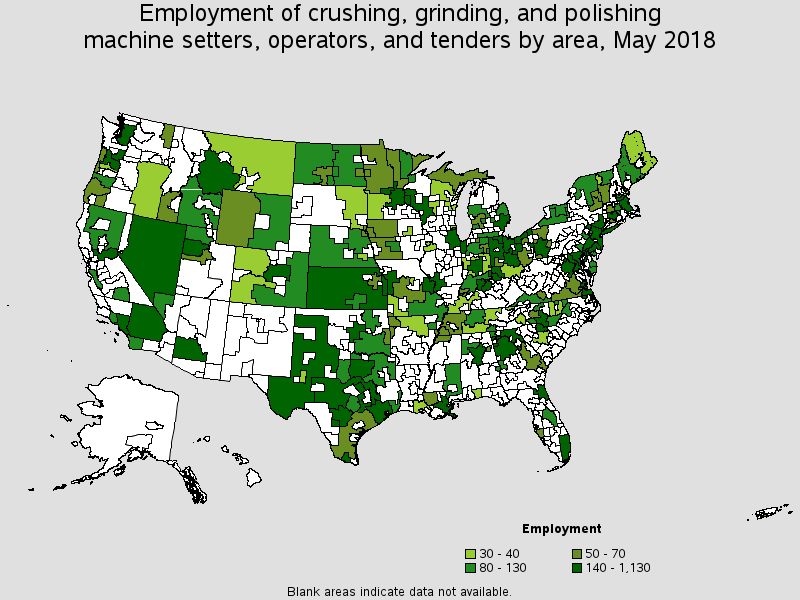
Metropolitan areas with the highest employment level in this occupation:
| Metropolitan area | Employment (1) | Employment per thousand jobs | Location quotient (9) | Hourly mean wage | Annual mean wage (2) |
|---|---|---|---|---|---|
| Chicago-Naperville-Elgin, IL-IN-WI | 1,130 | 0.24 | 1.11 | $19.01 | $39,540 |
| Los Angeles-Long Beach-Anaheim, CA | 1,070 | 0.17 | 0.79 | $15.11 | $31,420 |
| New York-Newark-Jersey City, NY-NJ-PA | 990 | 0.10 | 0.47 | $17.74 | $36,900 |
| Dallas-Fort Worth-Arlington, TX | 630 | 0.18 | 0.80 | $19.38 | $40,320 |
| Portland-Vancouver-Hillsboro, OR-WA | 540 | 0.46 | 2.07 | $18.67 | $38,840 |
| Houston-The Woodlands-Sugar Land, TX | 440 | 0.15 | 0.67 | $17.17 | $35,710 |
| Minneapolis-St. Paul-Bloomington, MN-WI | 380 | 0.19 | 0.88 | $21.95 | $45,660 |
| Boston-Cambridge-Nashua, MA-NH | 370 | 0.14 | 0.62 | $19.47 | $40,490 |
| Louisville/Jefferson County, KY-IN | 360 | 0.55 | 2.50 | $17.57 | $36,560 |
| Atlanta-Sandy Springs-Roswell, GA | 330 | 0.12 | 0.56 | $18.38 | $38,220 |
Metropolitan areas with the highest concentration of jobs and location quotients in this occupation:
| Metropolitan area | Employment (1) | Employment per thousand jobs | Location quotient (9) | Hourly mean wage | Annual mean wage (2) |
|---|---|---|---|---|---|
| Vineland-Bridgeton, NJ | 130 | 2.17 | 9.85 | $18.93 | $39,380 |
| St. Cloud, MN | 170 | 1.60 | 7.28 | $22.80 | $47,420 |
| Jonesboro, AR | 80 | 1.35 | 6.15 | $14.06 | $29,250 |
| Waco, TX | 150 | 1.28 | 5.80 | (8) | (8) |
| Anniston-Oxford-Jacksonville, AL | 50 | 1.24 | 5.63 | $19.75 | $41,090 |
| Glens Falls, NY | 60 | 1.21 | 5.51 | $17.34 | $36,060 |
| Columbus, GA-AL | 130 | 1.12 | 5.07 | $23.03 | $47,910 |
| Bismarck, ND | 70 | 0.95 | 4.32 | $24.96 | $51,920 |
| Duluth, MN-WI | 110 | 0.86 | 3.92 | $25.43 | $52,890 |
| Toledo, OH | 250 | 0.83 | 3.78 | $18.92 | $39,360 |
Top paying metropolitan areas for this occupation:
| Metropolitan area | Employment (1) | Employment per thousand jobs | Location quotient (9) | Hourly mean wage | Annual mean wage (2) |
|---|---|---|---|---|---|
| Las Vegas-Henderson-Paradise, NV | 90 | 0.09 | 0.39 | $32.56 | $67,720 |
| Duluth, MN-WI | 110 | 0.86 | 3.92 | $25.43 | $52,890 |
| Bismarck, ND | 70 | 0.95 | 4.32 | $24.96 | $51,920 |
| Provo-Orem, UT | 60 | 0.25 | 1.13 | $24.48 | $50,930 |
| Colorado Springs, CO | (8) | (8) | (8) | $23.77 | $49,440 |
| Salt Lake City, UT | 160 | 0.22 | 0.99 | $23.73 | $49,360 |
| New Haven, CT | 60 | 0.20 | 0.92 | $23.29 | $48,430 |
| Providence-Warwick, RI-MA | (8) | (8) | (8) | $23.25 | $48,370 |
| Columbus, GA-AL | 130 | 1.12 | 5.07 | $23.03 | $47,910 |
| St. Cloud, MN | 170 | 1.60 | 7.28 | $22.80 | $47,420 |
Nonmetropolitan areas with the highest employment in this occupation:
| Nonmetropolitan area | Employment (1) | Employment per thousand jobs | Location quotient (9) | Hourly mean wage | Annual mean wage (2) |
|---|---|---|---|---|---|
| North Northeastern Ohio non-metropolitan area (non-contiguous) | 400 | 1.20 | 5.43 | $17.03 | $35,430 |
| Hill Country Region of Texas nonmetropolitan area | 260 | 1.35 | 6.14 | $17.60 | $36,610 |
| Kansas nonmetropolitan area | 210 | 0.53 | 2.40 | $18.78 | $39,060 |
| Western Wisconsin nonmetropolitan area | 160 | 1.15 | 5.23 | $19.03 | $39,570 |
| West Northwestern Ohio nonmetropolitan area | 160 | 0.61 | 2.79 | $16.67 | $34,670 |
Nonmetropolitan areas with the highest concentration of jobs and location quotients in this occupation:
| Nonmetropolitan area | Employment (1) | Employment per thousand jobs | Location quotient (9) | Hourly mean wage | Annual mean wage (2) |
|---|---|---|---|---|---|
| East North Dakota nonmetropolitan area | 130 | 2.02 | 9.18 | $19.93 | $41,460 |
| Nevada nonmetropolitan area | 150 | 1.58 | 7.16 | $25.58 | $53,210 |
| Northwest Alabama nonmetropolitan area | 90 | 1.40 | 6.36 | $17.07 | $35,500 |
| Eastern and Southern Colorado nonmetropolitan area | 90 | 1.35 | 6.13 | $15.81 | $32,880 |
| North Valley-Northern Mountains Region of California nonmetropolitan area | 130 | 1.35 | 6.13 | $15.45 | $32,140 |
Top paying nonmetropolitan areas for this occupation:
| Nonmetropolitan area | Employment (1) | Employment per thousand jobs | Location quotient (9) | Hourly mean wage | Annual mean wage (2) |
|---|---|---|---|---|---|
| Western Wyoming nonmetropolitan area | 60 | 0.62 | 2.80 | $35.39 | $73,620 |
| Northwest Colorado nonmetropolitan area | 40 | 0.33 | 1.49 | $30.78 | $64,030 |
| Eastern Wyoming nonmetropolitan area | 90 | 1.07 | 4.86 | $30.13 | $62,680 |
| Southeast-Central Idaho nonmetropolitan area | 80 | 0.59 | 2.70 | $25.60 | $53,260 |
| Nevada nonmetropolitan area | 150 | 1.58 | 7.16 | $25.58 | $53,210 |
These estimates are calculated with data collected from employers in all industry sectors, all metropolitan and nonmetropolitan areas, and all states and the District of Columbia. The top employment and wage figures are provided above. The complete list is available in the downloadable XLS files.
The percentile wage estimate is the value of a wage below which a certain percent of workers fall. The median wage is the 50th percentile wage estimate--50 percent of workers earn less than the median and 50 percent of workers earn more than the median. More about percentile wages.
(1) Estimates for detailed occupations do not sum to the totals because the totals include occupations not shown separately. Estimates do not include self-employed workers.
(2) Annual wages have been calculated by multiplying the hourly mean wage by a "year-round, full-time" hours figure of 2,080 hours; for those occupations where there is not an hourly wage published, the annual wage has been directly calculated from the reported survey data.
(3) The relative standard error (RSE) is a measure of the reliability of a survey statistic. The smaller the relative standard error, the more precise the estimate.
(8) Estimate not released.
(9) The location quotient is the ratio of the area concentration of occupational employment to the national average concentration. A location quotient greater than one indicates the occupation has a higher share of employment than average, and a location quotient less than one indicates the occupation is less prevalent in the area than average.
Other OES estimates and related information:
May 2018 National Occupational Employment and Wage Estimates
May 2018 State Occupational Employment and Wage Estimates
May 2018 Metropolitan and Nonmetropolitan Area Occupational Employment and Wage Estimates
May 2018 National Industry-Specific Occupational Employment and Wage Estimates
Last Modified Date: March 29, 2019