
An official website of the United States government
An official website of the United States government
The .gov means it's official.
Federal government websites often end in .gov or .mil. Before sharing sensitive information,
make sure you're on a federal government site.
The site is secure.
The
https:// ensures that you are connecting to the official website and that any
information you provide is encrypted and transmitted securely.
This major group comprises the following occupations: Educational, Guidance, and Career Counselors and Advisors ; Marriage and Family Therapists ; Rehabilitation Counselors ; Substance Abuse, Behavioral Disorder, and Mental Health Counselors ; Counselors, All Other ; Child, Family, and School Social Workers ; Healthcare Social Workers ; Mental Health and Substance Abuse Social Workers ; Social Workers, All Other ; Health Education Specialists ; Probation Officers and Correctional Treatment Specialists ; Social and Human Service Assistants ; Community Health Workers ; Community and Social Service Specialists, All Other ; Clergy ; Directors, Religious Activities and Education ; Religious Workers, All Other
Employment estimate and mean wage estimates for this major group:
| Employment (1) | Employment RSE (3) |
Mean hourly wage |
Mean annual wage (2) |
Wage RSE (3) |
|---|---|---|---|---|
| 2,244,310 | 0.4 % | $24.27 | $50,480 | 0.4 % |
Percentile wage estimates for this major group:
| Percentile | 10% | 25% | 50% (Median) |
75% | 90% |
|---|---|---|---|---|---|
| Hourly Wage | $13.25 | $16.78 | $22.16 | $29.51 | $38.39 |
| Annual Wage (2) | $27,550 | $34,890 | $46,090 | $61,380 | $79,850 |
Industries with the highest published employment and wages for this occupation are provided. For a list of all industries with employment in this occupation, see the Create Customized Tables function.
Industries with the highest levels of employment in this occupation:
| Industry | Employment (1) | Percent of industry employment | Hourly mean wage | Annual mean wage (2) |
|---|---|---|---|---|
| Individual and Family Services | 390,040 | 15.36 | $20.64 | $42,920 |
| Local Government, excluding schools and hospitals (OES Designation) | 262,520 | 4.74 | $26.36 | $54,830 |
| State Government, excluding schools and hospitals (OES Designation) | 226,380 | 10.41 | $24.82 | $51,620 |
| Elementary and Secondary Schools | 225,250 | 2.62 | $30.82 | $64,110 |
| Outpatient Care Centers | 158,160 | 16.58 | $22.95 | $47,740 |
Industries with the highest concentration of employment in this occupation:
| Industry | Employment (1) | Percent of industry employment | Hourly mean wage | Annual mean wage (2) |
|---|---|---|---|---|
| Community Food and Housing, and Emergency and Other Relief Services | 55,040 | 30.27 | $18.47 | $38,410 |
| Religious Organizations | 53,000 | 26.34 | $23.51 | $48,900 |
| Other Residential Care Facilities | 40,450 | 24.84 | $18.36 | $38,190 |
| Vocational Rehabilitation Services | 69,910 | 21.48 | $17.99 | $37,420 |
| Residential Intellectual and Developmental Disability, Mental Health, and Substance Abuse Facilities | 111,410 | 17.47 | $18.74 | $38,970 |
Top paying industries for this occupation:
| Industry | Employment (1) | Percent of industry employment | Hourly mean wage | Annual mean wage (2) |
|---|---|---|---|---|
| Federal Executive Branch (OES Designation) | 22,690 | 1.13 | $37.51 | $78,020 |
| Insurance and Employee Benefit Funds | 40 | 0.66 | $36.40 | $75,710 |
| Merchant Wholesalers, Nondurable Goods (4242 and 4246 only) | 320 | 0.08 | $35.78 | $74,410 |
| Wholesale Electronic Markets and Agents and Brokers | 90 | 0.02 | $33.69 | $70,080 |
| Other Support Services | 40 | 0.01 | $31.36 | $65,230 |
States and areas with the highest published employment, location quotients, and wages for this occupation are provided. For a list of all areas with employment in this occupation, see the Create Customized Tables function.
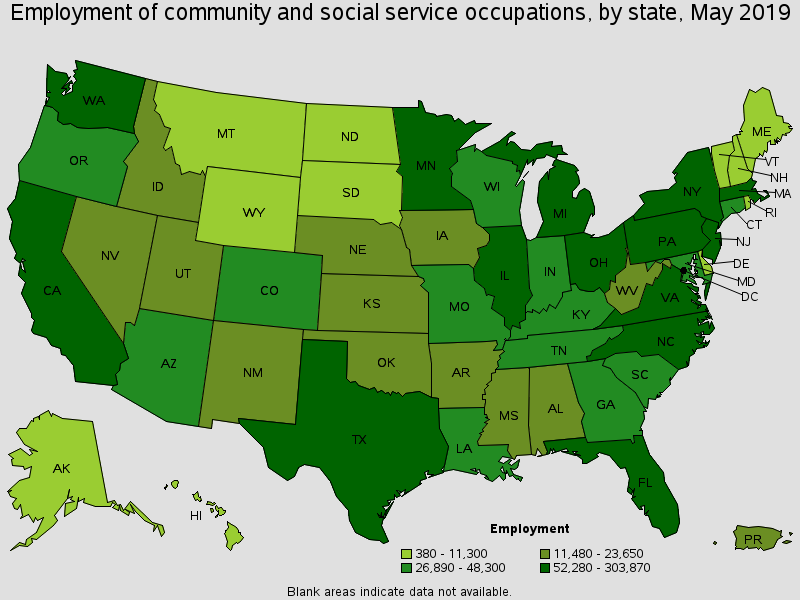
States with the highest employment level in this occupation:
| State | Employment (1) | Employment per thousand jobs | Location quotient (9) | Hourly mean wage | Annual mean wage (2) |
|---|---|---|---|---|---|
| California | 303,870 | 17.48 | 1.14 | $28.54 | $59,370 |
| New York | 198,410 | 20.84 | 1.36 | $26.47 | $55,060 |
| Texas | 124,830 | 10.04 | 0.66 | $23.81 | $49,530 |
| Florida | 107,020 | 12.17 | 0.80 | $21.56 | $44,830 |
| Pennsylvania | 106,330 | 18.02 | 1.18 | $22.54 | $46,880 |
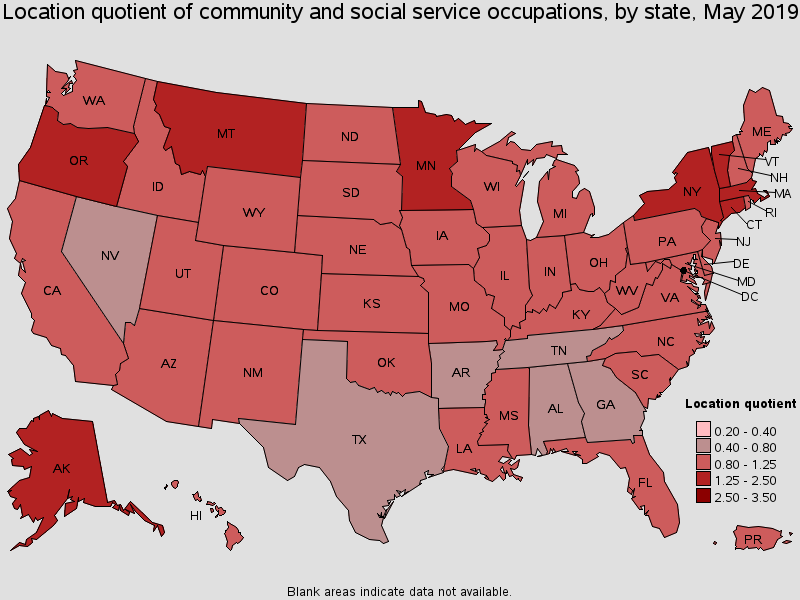
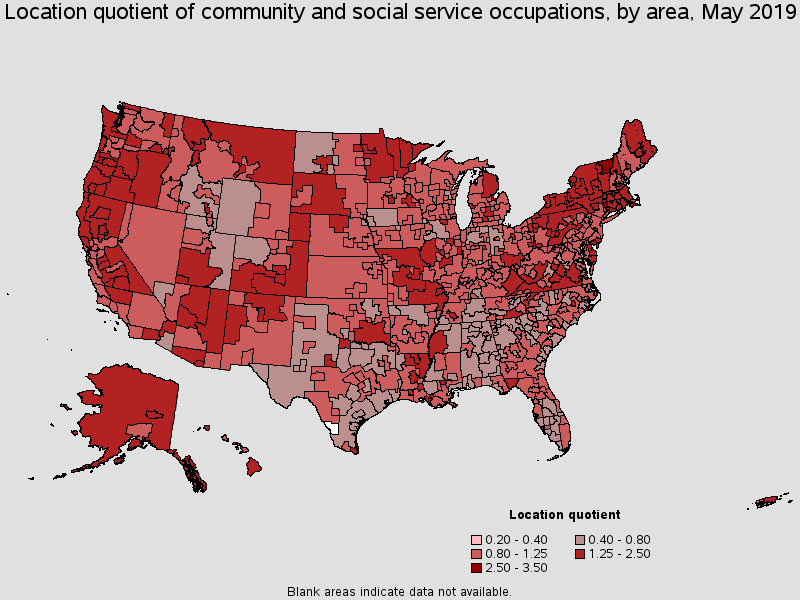
States with the highest concentration of jobs and location quotients in this occupation:
| State | Employment (1) | Employment per thousand jobs | Location quotient (9) | Hourly mean wage | Annual mean wage (2) |
|---|---|---|---|---|---|
| Vermont | 10,540 | 34.40 | 2.25 | $21.43 | $44,580 |
| Massachusetts | 83,650 | 23.11 | 1.51 | $24.19 | $50,310 |
| New York | 198,410 | 20.84 | 1.36 | $26.47 | $55,060 |
| Alaska | 6,590 | 20.79 | 1.36 | $26.49 | $55,100 |
| Connecticut | 34,190 | 20.53 | 1.34 | $27.89 | $58,010 |
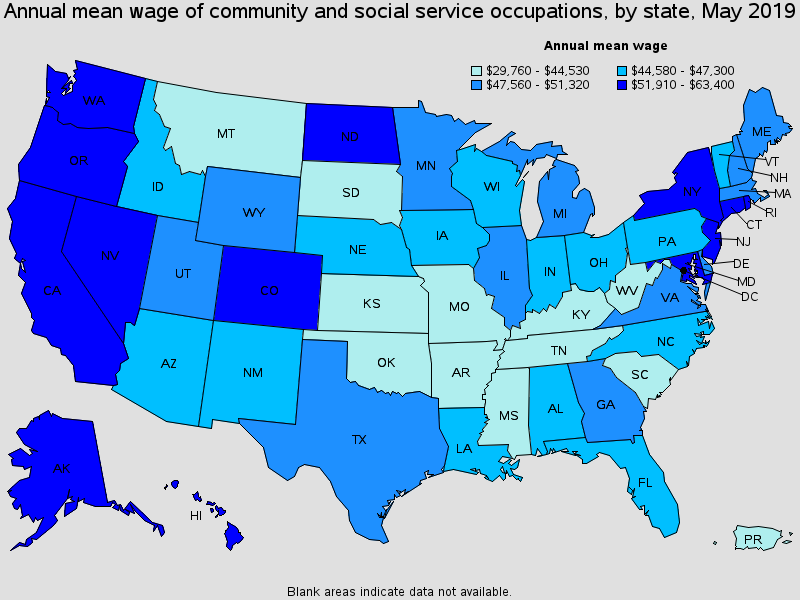
Top paying States for this occupation:
| State | Employment (1) | Employment per thousand jobs | Location quotient (9) | Hourly mean wage | Annual mean wage (2) |
|---|---|---|---|---|---|
| District of Columbia | 11,860 | 16.39 | 1.07 | $30.48 | $63,400 |
| California | 303,870 | 17.48 | 1.14 | $28.54 | $59,370 |
| Connecticut | 34,190 | 20.53 | 1.34 | $27.89 | $58,010 |
| New Jersey | 71,370 | 17.46 | 1.14 | $26.60 | $55,320 |
| Alaska | 6,590 | 20.79 | 1.36 | $26.49 | $55,100 |
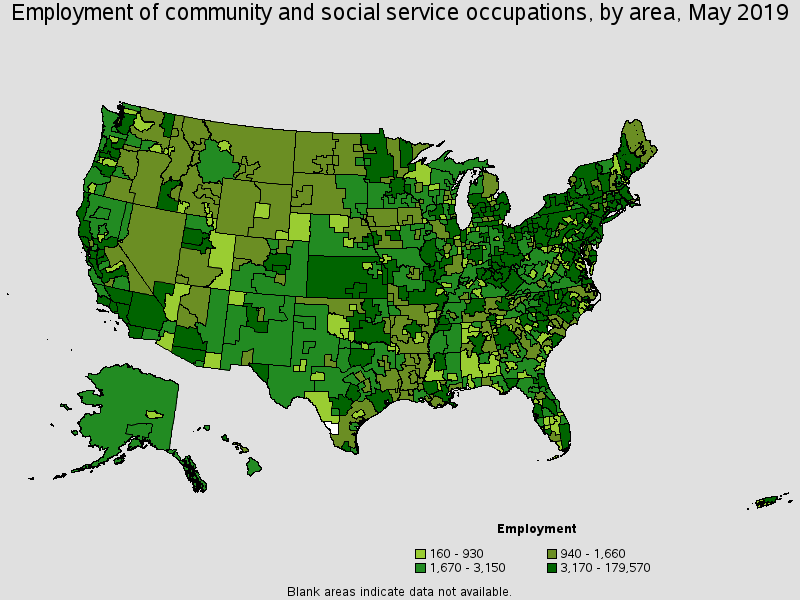
Metropolitan areas with the highest employment level in this occupation:
| Metropolitan area | Employment (1) | Employment per thousand jobs | Location quotient (9) | Hourly mean wage | Annual mean wage (2) |
|---|---|---|---|---|---|
| New York-Newark-Jersey City, NY-NJ-PA | 179,570 | 18.60 | 1.22 | $27.55 | $57,300 |
| Los Angeles-Long Beach-Anaheim, CA | 117,150 | 18.77 | 1.23 | $28.62 | $59,520 |
| Chicago-Naperville-Elgin, IL-IN-WI | 64,970 | 13.89 | 0.91 | $24.68 | $51,330 |
| Boston-Cambridge-Nashua, MA-NH | 54,710 | 19.55 | 1.28 | $24.64 | $51,250 |
| Philadelphia-Camden-Wilmington, PA-NJ-DE-MD | 54,370 | 18.90 | 1.24 | $24.11 | $50,140 |
| Washington-Arlington-Alexandria, DC-VA-MD-WV | 43,000 | 13.52 | 0.89 | $29.45 | $61,260 |
| San Francisco-Oakland-Hayward, CA | 36,320 | 14.69 | 0.96 | $31.25 | $65,000 |
| Minneapolis-St. Paul-Bloomington, MN-WI | 36,090 | 18.31 | 1.20 | $24.97 | $51,930 |
| Miami-Fort Lauderdale-West Palm Beach, FL | 35,460 | 13.42 | 0.88 | $22.65 | $47,120 |
| Phoenix-Mesa-Scottsdale, AZ | 32,070 | 15.12 | 0.99 | $22.18 | $46,140 |
Metropolitan areas with the highest concentration of jobs and location quotients in this occupation:
| Metropolitan area | Employment (1) | Employment per thousand jobs | Location quotient (9) | Hourly mean wage | Annual mean wage (2) |
|---|---|---|---|---|---|
| New Bedford, MA | 2,930 | 44.35 | 2.90 | $26.49 | $55,100 |
| Johnstown, PA | 1,780 | 34.99 | 2.29 | $19.59 | $40,760 |
| Duluth, MN-WI | 4,380 | 34.11 | 2.23 | $22.24 | $46,270 |
| Springfield, MA-CT | 11,120 | 33.26 | 2.18 | $23.09 | $48,040 |
| Waterbury, CT | 2,250 | 33.24 | 2.18 | $25.06 | $52,130 |
| Vineland-Bridgeton, NJ | 1,990 | 32.71 | 2.14 | $25.53 | $53,110 |
| Mankato-North Mankato, MN | 1,700 | 31.80 | 2.08 | $25.62 | $53,290 |
| Chico, CA | 2,500 | 31.57 | 2.07 | $23.57 | $49,030 |
| Grants Pass, OR | 830 | 31.19 | 2.04 | $23.09 | $48,020 |
| Worcester, MA-CT | 8,590 | 29.89 | 1.96 | $22.27 | $46,320 |
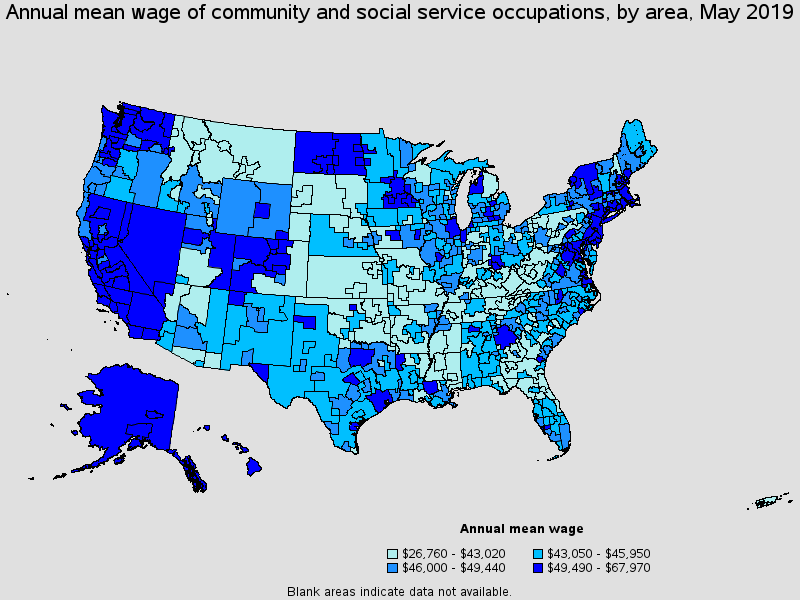
Top paying metropolitan areas for this occupation:
| Metropolitan area | Employment (1) | Employment per thousand jobs | Location quotient (9) | Hourly mean wage | Annual mean wage (2) |
|---|---|---|---|---|---|
| San Jose-Sunnyvale-Santa Clara, CA | 14,710 | 12.89 | 0.84 | $32.68 | $67,970 |
| Hanford-Corcoran, CA | 1,200 | 27.44 | 1.80 | $31.31 | $65,120 |
| San Francisco-Oakland-Hayward, CA | 36,320 | 14.69 | 0.96 | $31.25 | $65,000 |
| Madera, CA | 650 | 13.87 | 0.91 | $30.61 | $63,660 |
| San Luis Obispo-Paso Robles-Arroyo Grande, CA | 1,760 | 14.90 | 0.97 | $30.15 | $62,710 |
| Salinas, CA | 2,700 | 14.74 | 0.96 | $29.92 | $62,240 |
| Merced, CA | 1,780 | 23.31 | 1.53 | $29.80 | $61,980 |
| Napa, CA | 1,200 | 15.49 | 1.01 | $29.59 | $61,550 |
| Washington-Arlington-Alexandria, DC-VA-MD-WV | 43,000 | 13.52 | 0.89 | $29.45 | $61,260 |
| Bridgeport-Stamford-Norwalk, CT | 6,840 | 16.52 | 1.08 | $29.28 | $60,910 |
Nonmetropolitan areas with the highest employment in this occupation:
| Nonmetropolitan area | Employment (1) | Employment per thousand jobs | Location quotient (9) | Hourly mean wage | Annual mean wage (2) |
|---|---|---|---|---|---|
| Kansas nonmetropolitan area | 5,410 | 13.73 | 0.90 | $19.63 | $40,830 |
| Southwest New York nonmetropolitan area | 5,080 | 27.77 | 1.82 | $21.26 | $44,230 |
| North Northeastern Ohio non-metropolitan area (non-contiguous) | 4,700 | 14.07 | 0.92 | $20.22 | $42,050 |
| Southern Pennsylvania nonmetropolitan area | 4,510 | 23.39 | 1.53 | $19.50 | $40,550 |
| Central East New York nonmetropolitan area | 4,450 | 27.80 | 1.82 | $23.07 | $47,990 |
Nonmetropolitan areas with the highest concentration of jobs and location quotients in this occupation:
| Nonmetropolitan area | Employment (1) | Employment per thousand jobs | Location quotient (9) | Hourly mean wage | Annual mean wage (2) |
|---|---|---|---|---|---|
| Connecticut nonmetropolitan area | 1,290 | 39.68 | 2.60 | $23.38 | $48,620 |
| Northern Vermont nonmetropolitan area | 2,820 | 39.28 | 2.57 | $22.99 | $47,810 |
| North Coast Region of California nonmetropolitan area | 3,960 | 36.89 | 2.41 | $23.24 | $48,340 |
| East Kentucky nonmetropolitan area | 3,290 | 32.69 | 2.14 | $18.48 | $38,440 |
| Southern Vermont nonmetropolitan area | 3,490 | 32.54 | 2.13 | $21.66 | $45,040 |
Top paying nonmetropolitan areas for this occupation:
| Nonmetropolitan area | Employment (1) | Employment per thousand jobs | Location quotient (9) | Hourly mean wage | Annual mean wage (2) |
|---|---|---|---|---|---|
| Alaska nonmetropolitan area | 2,810 | 25.94 | 1.70 | $26.65 | $55,430 |
| West North Dakota nonmetropolitan area | 1,210 | 9.64 | 0.63 | $25.68 | $53,420 |
| Northwest Colorado nonmetropolitan area | 1,360 | 11.10 | 0.73 | $25.63 | $53,310 |
| North Valley-Northern Mountains Region of California nonmetropolitan area | 2,210 | 22.00 | 1.44 | $25.56 | $53,170 |
| Eastern Sierra-Mother Lode Region of California nonmetropolitan area | 1,450 | 24.54 | 1.61 | $25.53 | $53,100 |
These estimates are calculated with data collected from employers in all industry sectors, all metropolitan and nonmetropolitan areas, and all states and the District of Columbia.
The percentile wage estimate is the value of a wage below which a certain percent of workers fall. The median wage is the 50th percentile wage estimate--50 percent of workers earn less than the median and 50 percent of workers earn more than the median. More about percentile wages.
(1) Estimates for detailed occupations do not sum to the totals because the totals include occupations not shown separately. Estimates do not include self-employed workers.
(2) Annual wages have been calculated by multiplying the hourly mean wage by a "year-round, full-time" hours figure of 2,080 hours; for those occupations where there is not an hourly wage published, the annual wage has been directly calculated from the reported survey data.
(3) The relative standard error (RSE) is a measure of the reliability of a survey statistic. The smaller the relative standard error, the more precise the estimate.
(9) The location quotient is the ratio of the area concentration of occupational employment to the national average concentration. A location quotient greater than one indicates the occupation has a higher share of employment than average, and a location quotient less than one indicates the occupation is less prevalent in the area than average.
Other OES estimates and related information:
May 2019 National Occupational Employment and Wage Estimates
May 2019 State Occupational Employment and Wage Estimates
May 2019 Metropolitan and Nonmetropolitan Area Occupational Employment and Wage Estimates
May 2019 National Industry-Specific Occupational Employment and Wage Estimates
Last Modified Date: July 6, 2020