
An official website of the United States government
An official website of the United States government
The .gov means it's official.
Federal government websites often end in .gov or .mil. Before sharing sensitive information,
make sure you're on a federal government site.
The site is secure.
The
https:// ensures that you are connecting to the official website and that any
information you provide is encrypted and transmitted securely.
Healthcare Support Occupations comprises the following occupations: Home Health and Personal Care Aides; Psychiatric Aides; Orderlies; Nursing Assistants; Occupational Therapy Aides; Occupational Therapy Assistants; Physical Therapist Aides; Physical Therapist Assistants; Massage Therapists; Healthcare Support Workers, All Other; Pharmacy Aides; Medical Transcriptionists; Medical Equipment Preparers; Veterinary Assistants and Laboratory Animal Caretakers; Phlebotomists; Dental Assistants; Medical Assistants
Employment estimate and mean wage estimates for Healthcare Support Occupations:
| Employment (1) | Employment RSE (3) |
Mean hourly wage |
Mean annual wage (2) |
Wage RSE (3) |
|---|---|---|---|---|
| 6,603,680 | 0.2 % | $ 16.02 | $ 33,330 | 0.2 % |
Percentile wage estimates for Healthcare Support Occupations:
| Percentile | 10% | 25% | 50% (Median) |
75% | 90% |
|---|---|---|---|---|---|
| Hourly Wage | $ 11.00 | $ 13.72 | $ 14.37 | $ 17.91 | $ 22.58 |
| Annual Wage (2) | $ 22,890 | $ 28,540 | $ 29,880 | $ 37,240 | $ 46,960 |
Industries with the highest published employment and wages for Healthcare Support Occupations are provided. For a list of all industries with employment in Healthcare Support Occupations, see the Create Customized Tables function.
Industries with the highest levels of employment in Healthcare Support Occupations:
| Industry | Employment (1) | Percent of industry employment | Hourly mean wage | Annual mean wage (2) |
|---|---|---|---|---|
| Individual and Family Services | 1,699,470 | 63.97 | $ 14.20 | $ 29,540 |
| Home Health Care Services | 964,760 | 63.69 | $ 13.96 | $ 29,030 |
| General Medical and Surgical Hospitals | 717,000 | 12.81 | $ 18.01 | $ 37,450 |
| Nursing Care Facilities (Skilled Nursing Facilities) | 561,500 | 39.89 | $ 15.83 | $ 32,920 |
| Offices of Physicians | 501,600 | 18.60 | $ 18.04 | $ 37,520 |
Industries with the highest concentration of employment in Healthcare Support Occupations:
| Industry | Employment (1) | Percent of industry employment | Hourly mean wage | Annual mean wage (2) |
|---|---|---|---|---|
| Individual and Family Services | 1,699,470 | 63.97 | $ 14.20 | $ 29,540 |
| Home Health Care Services | 964,760 | 63.69 | $ 13.96 | $ 29,030 |
| Residential Intellectual and Developmental Disability, Mental Health, and Substance Abuse Facilities | 304,400 | 49.67 | $ 14.25 | $ 29,640 |
| Continuing Care Retirement Communities and Assisted Living Facilities for the Elderly | 397,920 | 44.65 | $ 14.54 | $ 30,250 |
| Nursing Care Facilities (Skilled Nursing Facilities) | 561,500 | 39.89 | $ 15.83 | $ 32,920 |
Top paying industries for Healthcare Support Occupations:
| Industry | Employment (1) | Percent of industry employment | Hourly mean wage | Annual mean wage (2) |
|---|---|---|---|---|
| Direct Selling Establishments | 30 | 0.02 | $ 37.31 | $ 77,600 |
| Other Amusement and Recreation Industries | 2,570 | 0.23 | $ 30.98 | $ 64,450 |
| Spectator Sports | 90 | 0.08 | $ 29.38 | $ 61,110 |
| Electronic and Precision Equipment Repair and Maintenance | 170 | 0.16 | $ 27.72 | $ 57,670 |
| Insurance Carriers | 1,030 | 0.09 | $ 25.05 | $ 52,100 |
States and areas with the highest published employment, location quotients, and wages for Healthcare Support Occupations are provided. For a list of all areas with employment in Healthcare Support Occupations, see the Create Customized Tables function.
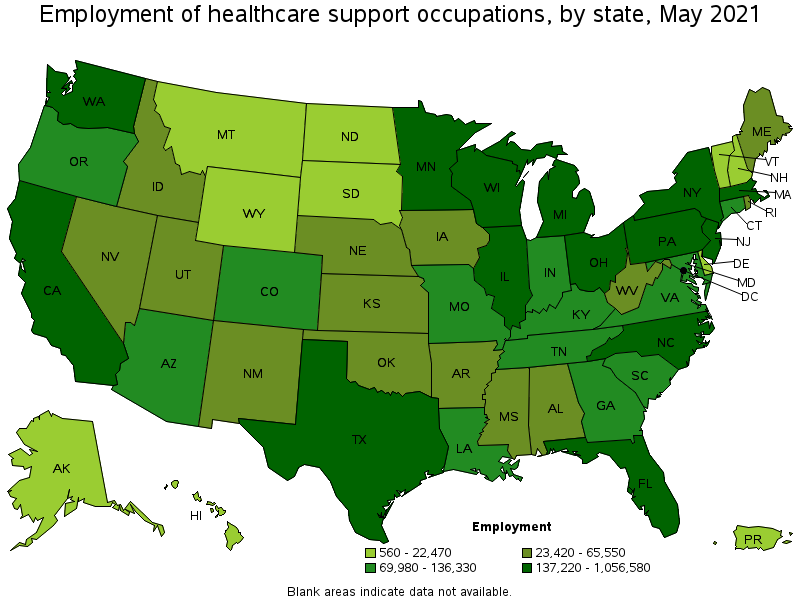
States with the highest employment level in Healthcare Support Occupations:
| State | Employment (1) | Employment per thousand jobs | Location quotient (9) | Hourly mean wage | Annual mean wage (2) |
|---|---|---|---|---|---|
| California | 1,056,580 | 63.92 | 1.36 | $ 17.22 | $ 35,820 |
| New York | 661,830 | 76.34 | 1.63 | $ 17.30 | $ 35,990 |
| Texas | 552,120 | 45.16 | 0.96 | $ 13.69 | $ 28,470 |
| Pennsylvania | 331,260 | 59.33 | 1.27 | $ 15.25 | $ 31,720 |
| Florida | 285,180 | 33.14 | 0.71 | $ 15.90 | $ 33,070 |
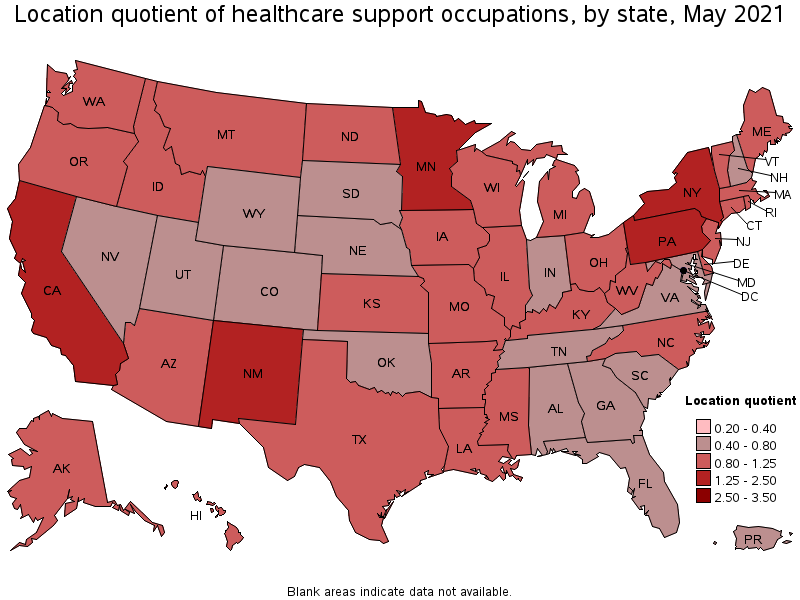
States with the highest concentration of jobs and location quotients in Healthcare Support Occupations:
| State | Employment (1) | Employment per thousand jobs | Location quotient (9) | Hourly mean wage | Annual mean wage (2) |
|---|---|---|---|---|---|
| New York | 661,830 | 76.34 | 1.63 | $ 17.30 | $ 35,990 |
| New Mexico | 52,950 | 68.18 | 1.45 | $ 13.86 | $ 28,840 |
| California | 1,056,580 | 63.92 | 1.36 | $ 17.22 | $ 35,820 |
| Minnesota | 162,530 | 59.42 | 1.27 | $ 16.32 | $ 33,950 |
| Pennsylvania | 331,260 | 59.33 | 1.27 | $ 15.25 | $ 31,720 |
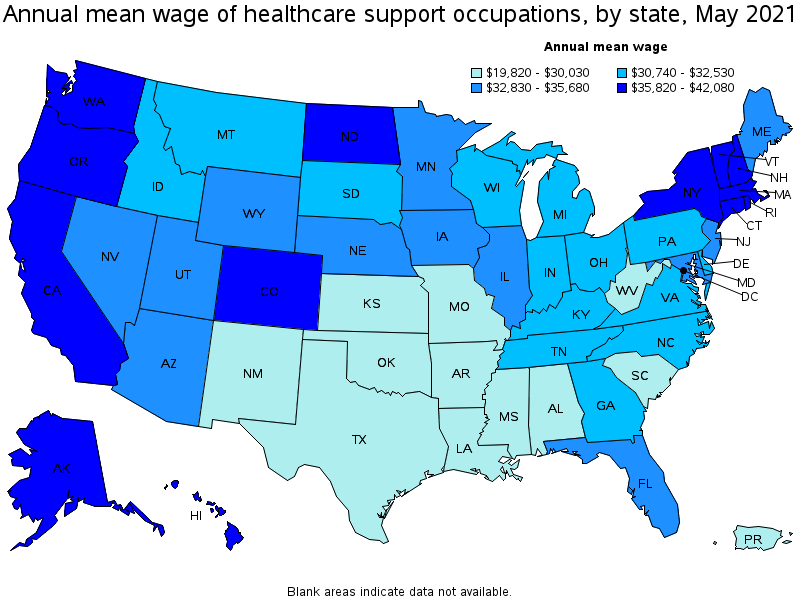
Top paying states for Healthcare Support Occupations:
| State | Employment (1) | Employment per thousand jobs | Location quotient (9) | Hourly mean wage | Annual mean wage (2) |
|---|---|---|---|---|---|
| Alaska | 12,830 | 43.36 | 0.92 | $ 20.23 | $ 42,080 |
| Washington | 137,220 | 42.80 | 0.91 | $ 19.38 | $ 40,320 |
| Massachusetts | 187,330 | 55.19 | 1.18 | $ 18.41 | $ 38,290 |
| Oregon | 78,710 | 43.12 | 0.92 | $ 18.40 | $ 38,280 |
| Hawaii | 21,030 | 38.35 | 0.82 | $ 18.21 | $ 37,870 |
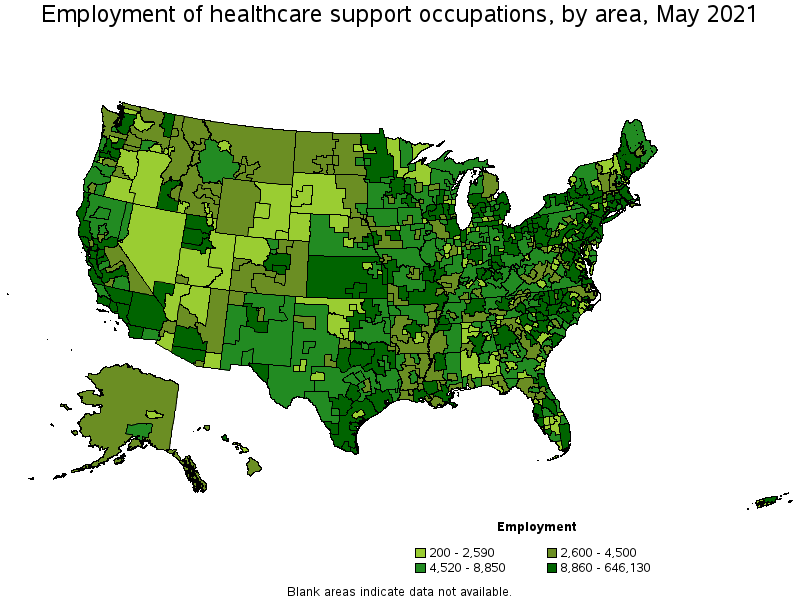
Metropolitan areas with the highest employment level in Healthcare Support Occupations:
| Metropolitan area | Employment (1) | Employment per thousand jobs | Location quotient (9) | Hourly mean wage | Annual mean wage (2) |
|---|---|---|---|---|---|
| New York-Newark-Jersey City, NY-NJ-PA | 646,130 | 74.46 | 1.59 | $ 17.50 | $ 36,400 |
| Los Angeles-Long Beach-Anaheim, CA | 421,890 | 73.76 | 1.57 | $ 16.53 | $ 34,390 |
| Chicago-Naperville-Elgin, IL-IN-WI | 173,990 | 41.10 | 0.88 | $ 16.64 | $ 34,610 |
| Philadelphia-Camden-Wilmington, PA-NJ-DE-MD | 170,600 | 64.27 | 1.37 | $ 15.81 | $ 32,880 |
| San Francisco-Oakland-Hayward, CA | 129,960 | 57.96 | 1.24 | $ 19.77 | $ 41,120 |
| Boston-Cambridge-Nashua, MA-NH | 122,140 | 47.25 | 1.01 | $ 18.79 | $ 39,090 |
| Dallas-Fort Worth-Arlington, TX | 121,430 | 33.84 | 0.72 | $ 15.32 | $ 31,860 |
| Houston-The Woodlands-Sugar Land, TX | 115,190 | 39.76 | 0.85 | $ 14.40 | $ 29,950 |
| Minneapolis-St. Paul-Bloomington, MN-WI | 106,810 | 58.59 | 1.25 | $ 16.51 | $ 34,340 |
| Riverside-San Bernardino-Ontario, CA | 101,720 | 66.48 | 1.42 | $ 16.14 | $ 33,570 |
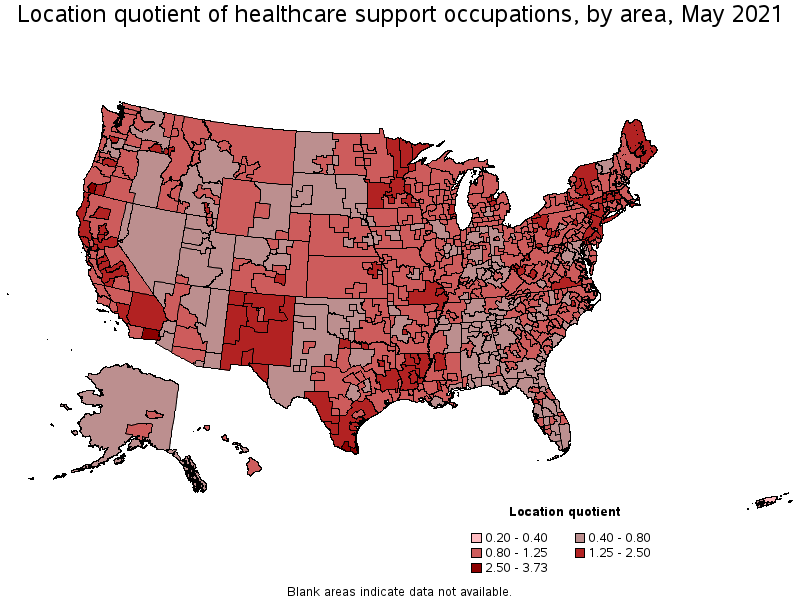
Metropolitan areas with the highest concentration of jobs and location quotients in Healthcare Support Occupations:
| Metropolitan area | Employment (1) | Employment per thousand jobs | Location quotient (9) | Hourly mean wage | Annual mean wage (2) |
|---|---|---|---|---|---|
| McAllen-Edinburg-Mission, TX | 45,740 | 174.67 | 3.73 | $ 11.03 | $ 22,930 |
| Brownsville-Harlingen, TX | 21,670 | 153.40 | 3.27 | $ 11.06 | $ 23,000 |
| Grants Pass, OR | 3,390 | 120.39 | 2.57 | $ 17.25 | $ 35,870 |
| El Centro, CA | 6,930 | 118.10 | 2.52 | $ 15.11 | $ 31,420 |
| Las Cruces, NM | 6,810 | 99.94 | 2.13 | $ 12.61 | $ 26,220 |
| Chico, CA | 7,230 | 96.99 | 2.07 | $ 15.96 | $ 33,190 |
| Midland, MI | 3,310 | 95.35 | 2.03 | $ 13.85 | $ 28,800 |
| Sherman-Denison, TX | 4,550 | 94.57 | 2.02 | $ 11.99 | $ 24,950 |
| Laredo, TX | 9,050 | 93.14 | 1.99 | $ 11.09 | $ 23,060 |
| Redding, CA | 5,790 | 88.89 | 1.90 | $ 16.88 | $ 35,120 |
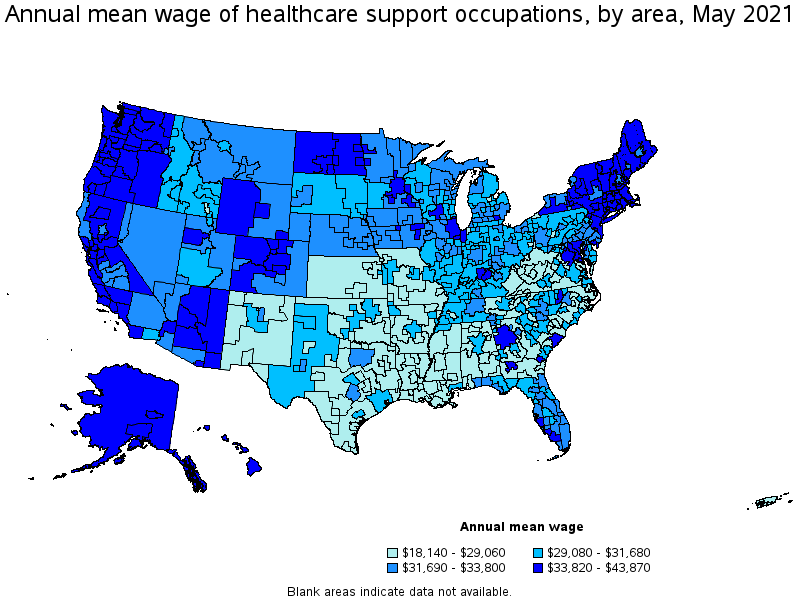
Top paying metropolitan areas for Healthcare Support Occupations:
| Metropolitan area | Employment (1) | Employment per thousand jobs | Location quotient (9) | Hourly mean wage | Annual mean wage (2) |
|---|---|---|---|---|---|
| Seattle-Tacoma-Bellevue, WA | 78,960 | 41.18 | 0.88 | $ 20.36 | $ 42,360 |
| Fairbanks, AK | 1,350 | 39.16 | 0.84 | $ 20.28 | $ 42,190 |
| Anchorage, AK | 8,230 | 50.88 | 1.09 | $ 19.89 | $ 41,360 |
| San Francisco-Oakland-Hayward, CA | 129,960 | 57.96 | 1.24 | $ 19.77 | $ 41,120 |
| Vallejo-Fairfield, CA | 9,110 | 70.31 | 1.50 | $ 19.54 | $ 40,640 |
| Portland-Vancouver-Hillsboro, OR-WA | 40,840 | 36.39 | 0.78 | $ 19.42 | $ 40,380 |
| Kahului-Wailuku-Lahaina, HI | 2,170 | 33.90 | 0.72 | $ 19.19 | $ 39,910 |
| Napa, CA | 3,550 | 51.53 | 1.10 | $ 19.17 | $ 39,870 |
| Olympia-Tumwater, WA | 4,570 | 40.80 | 0.87 | $ 19.09 | $ 39,710 |
| Mount Vernon-Anacortes, WA | 1,840 | 39.16 | 0.84 | $ 18.91 | $ 39,330 |
Nonmetropolitan areas with the highest employment in Healthcare Support Occupations:
| Nonmetropolitan area | Employment (1) | Employment per thousand jobs | Location quotient (9) | Hourly mean wage | Annual mean wage (2) |
|---|---|---|---|---|---|
| Kansas nonmetropolitan area | 17,860 | 47.55 | 1.01 | $ 13.33 | $ 27,730 |
| Coastal Plains Region of Texas nonmetropolitan area | 12,500 | 88.61 | 1.89 | $ 11.63 | $ 24,190 |
| North Texas Region of Texas nonmetropolitan area | 12,490 | 46.97 | 1.00 | $ 12.72 | $ 26,460 |
| Southeast Coastal North Carolina nonmetropolitan area | 12,320 | 51.26 | 1.09 | $ 13.00 | $ 27,050 |
| North Northeastern Ohio nonmetropolitan area (noncontiguous) | 12,310 | 39.17 | 0.84 | $ 14.95 | $ 31,100 |
Nonmetropolitan areas with the highest concentration of jobs and location quotients in Healthcare Support Occupations:
| Nonmetropolitan area | Employment (1) | Employment per thousand jobs | Location quotient (9) | Hourly mean wage | Annual mean wage (2) |
|---|---|---|---|---|---|
| North Coast Region of California nonmetropolitan area | 9,080 | 90.90 | 1.94 | $ 16.02 | $ 33,320 |
| Coastal Plains Region of Texas nonmetropolitan area | 12,500 | 88.61 | 1.89 | $ 11.63 | $ 24,190 |
| Border Region of Texas nonmetropolitan area | 4,820 | 86.39 | 1.84 | $ 11.40 | $ 23,710 |
| Northern New Mexico nonmetropolitan area | 6,260 | 81.79 | 1.74 | $ 12.88 | $ 26,790 |
| Southwest Minnesota nonmetropolitan area | 8,710 | 75.19 | 1.60 | $ 15.16 | $ 31,540 |
Top paying nonmetropolitan areas for Healthcare Support Occupations:
| Nonmetropolitan area | Employment (1) | Employment per thousand jobs | Location quotient (9) | Hourly mean wage | Annual mean wage (2) |
|---|---|---|---|---|---|
| Alaska nonmetropolitan area | 3,230 | 33.20 | 0.71 | $ 21.09 | $ 43,870 |
| Northwest Colorado nonmetropolitan area | 2,410 | 20.63 | 0.44 | $ 19.04 | $ 39,600 |
| Western Washington nonmetropolitan area | 4,460 | 37.28 | 0.80 | $ 18.49 | $ 38,460 |
| Massachusetts nonmetropolitan area | 3,610 | 62.46 | 1.33 | $ 18.29 | $ 38,050 |
| Eastern Washington nonmetropolitan area | 2,900 | 30.81 | 0.66 | $ 18.25 | $ 37,960 |
These estimates are calculated with data collected from employers in all industry sectors, all metropolitan and nonmetropolitan areas, and all states and the District of Columbia.
The percentile wage estimate is the value of a wage below which a certain percent of workers fall. The median wage is the 50th percentile wage estimate—50 percent of workers earn less than the median and 50 percent of workers earn more than the median. More about percentile wages.
(1) Estimates for detailed occupations do not sum to the totals because the totals include occupations not shown separately. Estimates do not include self-employed workers.
(2) Annual wages have been calculated by multiplying the hourly mean wage by a "year-round, full-time" hours figure of 2,080 hours; for those occupations where there is not an hourly wage published, the annual wage has been directly calculated from the reported survey data.
(3) The relative standard error (RSE) is a measure of the reliability of a survey statistic. The smaller the relative standard error, the more precise the estimate.
(9) The location quotient is the ratio of the area concentration of occupational employment to the national average concentration. A location quotient greater than one indicates the occupation has a higher share of employment than average, and a location quotient less than one indicates the occupation is less prevalent in the area than average.
Other OEWS estimates and related information:
May 2021 National Occupational Employment and Wage Estimates
May 2021 State Occupational Employment and Wage Estimates
May 2021 Metropolitan and Nonmetropolitan Area Occupational Employment and Wage Estimates
May 2021 National Industry-Specific Occupational Employment and Wage Estimates
Last Modified Date: March 31, 2022