
An official website of the United States government
An official website of the United States government
The .gov means it's official.
Federal government websites often end in .gov or .mil. Before sharing sensitive information,
make sure you're on a federal government site.
The site is secure.
The
https:// ensures that you are connecting to the official website and that any
information you provide is encrypted and transmitted securely.
Research, design, develop, test, or supervise the manufacturing and installation of electrical equipment, components, or systems for commercial, industrial, military, or scientific use. Excludes �Computer Hardware Engineers� (17-2061).
Employment estimate and mean wage estimates for Electrical Engineers:
| Employment (1) | Employment RSE (3) |
Mean hourly wage |
Mean annual wage (2) |
Wage RSE (3) |
|---|---|---|---|---|
| 185,430 | 1.8 % | $ 56.58 | $ 117,680 | 0.7 % |
Percentile wage estimates for Electrical Engineers:
| Percentile | 10% | 25% | 50% (Median) |
75% | 90% |
|---|---|---|---|---|---|
| Hourly Wage | $ 33.33 | $ 40.00 | $ 51.42 | $ 65.93 | $ 82.72 |
| Annual Wage (2) | $ 69,320 | $ 83,200 | $ 106,950 | $ 137,140 | $ 172,050 |
Industries with the highest published employment and wages for Electrical Engineers are provided. For a list of all industries with employment in Electrical Engineers, see the Create Customized Tables function.
Industries with the highest levels of employment in Electrical Engineers:
| Industry | Employment (1) | Percent of industry employment | Hourly mean wage | Annual mean wage (2) |
|---|---|---|---|---|
| Architectural, Engineering, and Related Services | 40,300 | 2.45 | $ 53.78 | $ 111,860 |
| Electric Power Generation, Transmission and Distribution | 17,870 | 4.54 | $ 55.52 | $ 115,480 |
| Navigational, Measuring, Electromedical, and Control Instruments Manufacturing | 10,890 | 2.57 | $ 59.51 | $ 123,780 |
| Aerospace Product and Parts Manufacturing | 9,380 | 1.84 | $ 64.87 | $ 134,930 |
| Management of Companies and Enterprises | 9,340 | 0.34 | $ 58.67 | $ 122,030 |
Industries with the highest concentration of employment in Electrical Engineers:
| Industry | Employment (1) | Percent of industry employment | Hourly mean wage | Annual mean wage (2) |
|---|---|---|---|---|
| Electric Power Generation, Transmission and Distribution | 17,870 | 4.54 | $ 55.52 | $ 115,480 |
| Electrical Equipment Manufacturing | 4,810 | 3.30 | $ 46.56 | $ 96,850 |
| Audio and Video Equipment Manufacturing | 610 | 3.16 | $ 58.82 | $ 122,340 |
| Communications Equipment Manufacturing | 2,370 | 2.83 | $ 60.99 | $ 126,850 |
| Navigational, Measuring, Electromedical, and Control Instruments Manufacturing | 10,890 | 2.57 | $ 59.51 | $ 123,780 |
Top paying industries for Electrical Engineers:
| Industry | Employment (1) | Percent of industry employment | Hourly mean wage | Annual mean wage (2) |
|---|---|---|---|---|
| Manufacturing and Reproducing Magnetic and Optical Media | (8) | (8) | $ 104.55 | $ 217,470 |
| Software Publishers | 250 | 0.04 | $ 85.27 | $ 177,350 |
| Computer and Peripheral Equipment Manufacturing | (8) | (8) | $ 83.94 | $ 174,590 |
| Oil and Gas Extraction | 210 | 0.19 | $ 74.84 | $ 155,660 |
| Other Pipeline Transportation | 90 | 1.04 | $ 72.86 | $ 151,550 |
States and areas with the highest published employment, location quotients, and wages for Electrical Engineers are provided. For a list of all areas with employment in Electrical Engineers, see the Create Customized Tables function.
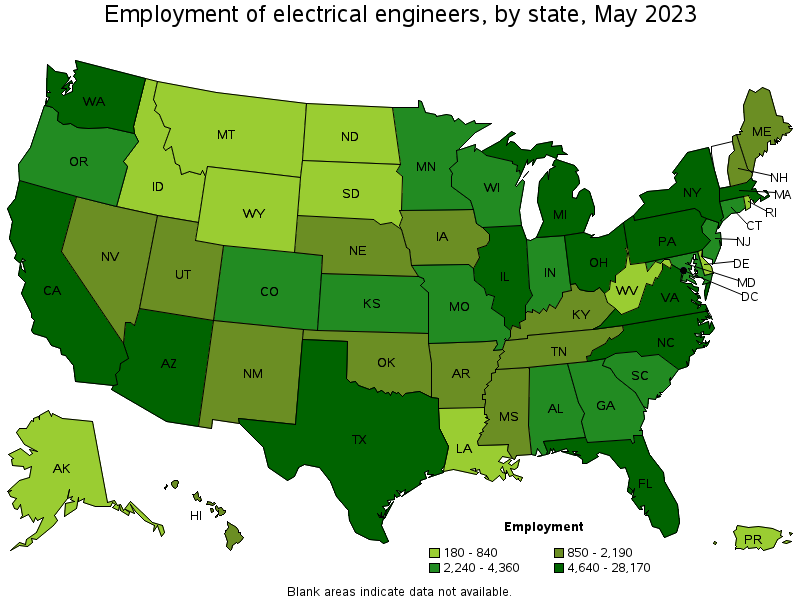
States with the highest employment level in Electrical Engineers:
| State | Employment (1) | Employment per thousand jobs | Location quotient (9) | Hourly mean wage | Annual mean wage (2) |
|---|---|---|---|---|---|
| California | 28,170 | 1.57 | 1.29 | $ 70.84 | $ 147,340 |
| Texas | 14,540 | 1.07 | 0.88 | $ 54.72 | $ 113,820 |
| Michigan | 10,270 | 2.36 | 1.93 | $ 48.94 | $ 101,800 |
| Washington | 9,060 | 2.59 | 2.12 | $ 61.27 | $ 127,440 |
| New York | 7,270 | 0.77 | 0.63 | $ 55.23 | $ 114,880 |
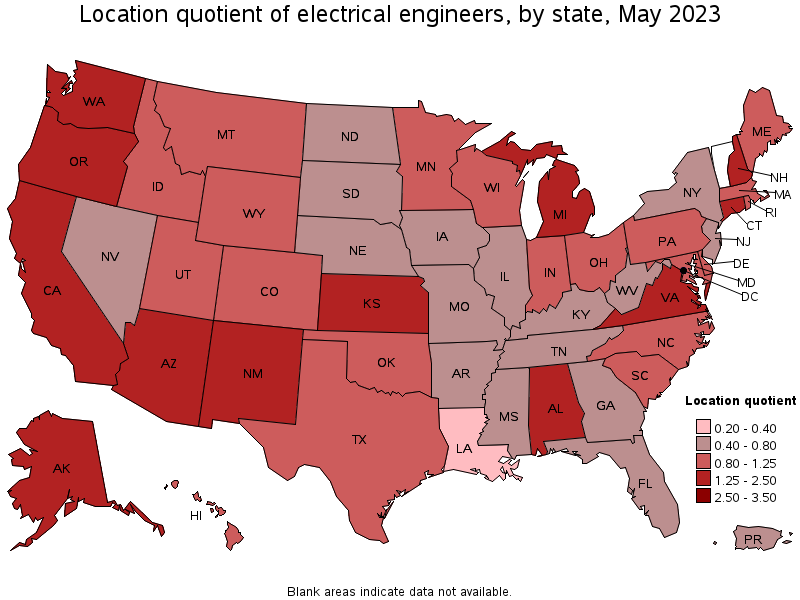
States with the highest concentration of jobs and location quotients in Electrical Engineers:
| State | Employment (1) | Employment per thousand jobs | Location quotient (9) | Hourly mean wage | Annual mean wage (2) |
|---|---|---|---|---|---|
| Washington | 9,060 | 2.59 | 2.12 | $ 61.27 | $ 127,440 |
| Michigan | 10,270 | 2.36 | 1.93 | $ 48.94 | $ 101,800 |
| New Hampshire | 1,540 | 2.28 | 1.87 | $ 63.85 | $ 132,810 |
| Alabama | 4,360 | 2.12 | 1.74 | $ 55.47 | $ 115,380 |
| New Mexico | 1,720 | 2.04 | 1.67 | $ 65.05 | $ 135,310 |
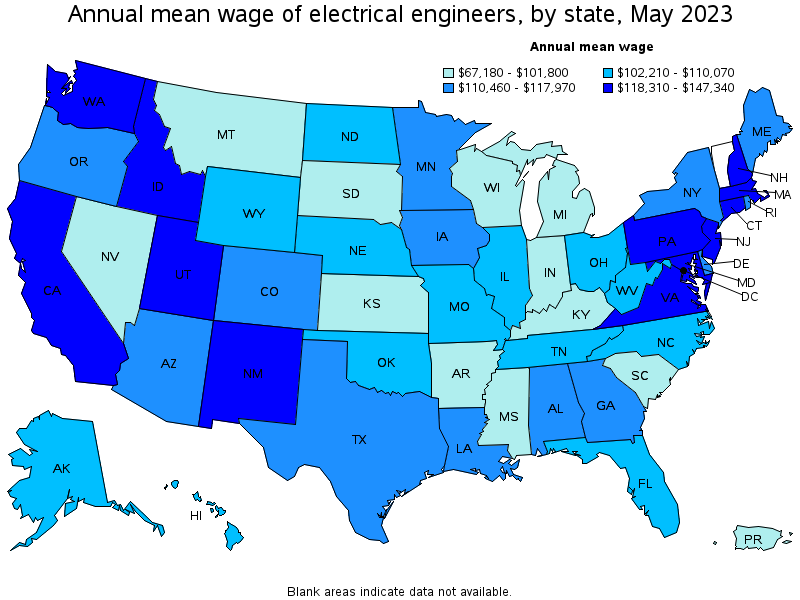
Top paying states for Electrical Engineers:
| State | Employment (1) | Employment per thousand jobs | Location quotient (9) | Hourly mean wage | Annual mean wage (2) |
|---|---|---|---|---|---|
| California | 28,170 | 1.57 | 1.29 | $ 70.84 | $ 147,340 |
| New Mexico | 1,720 | 2.04 | 1.67 | $ 65.05 | $ 135,310 |
| New Hampshire | 1,540 | 2.28 | 1.87 | $ 63.85 | $ 132,810 |
| District of Columbia | 530 | 0.75 | 0.62 | $ 61.52 | $ 127,950 |
| Massachusetts | 4,780 | 1.31 | 1.07 | $ 61.50 | $ 127,930 |
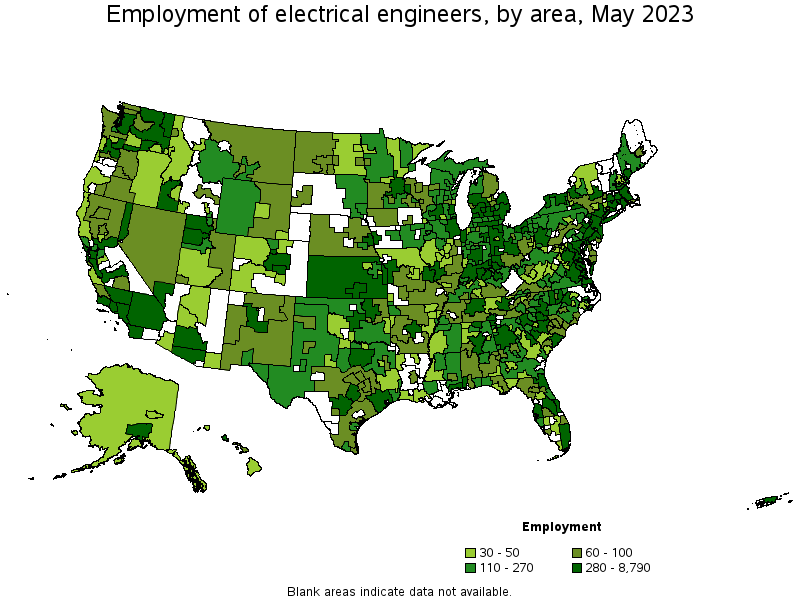
Metropolitan areas with the highest employment level in Electrical Engineers:
| Metropolitan area | Employment (1) | Employment per thousand jobs | Location quotient (9) | Hourly mean wage | Annual mean wage (2) |
|---|---|---|---|---|---|
| Los Angeles-Long Beach-Anaheim, CA | 8,790 | 1.42 | 1.16 | $ 64.66 | $ 134,500 |
| San Jose-Sunnyvale-Santa Clara, CA | 7,440 | 6.51 | 5.33 | $ 89.13 | $ 185,390 |
| Seattle-Tacoma-Bellevue, WA | 6,440 | 3.10 | 2.54 | $ 63.84 | $ 132,790 |
| New York-Newark-Jersey City, NY-NJ-PA | 6,400 | 0.67 | 0.55 | $ 57.62 | $ 119,840 |
| Detroit-Warren-Dearborn, MI | 6,180 | 3.25 | 2.66 | $ 49.99 | $ 103,980 |
| Boston-Cambridge-Nashua, MA-NH | 4,640 | 1.68 | 1.37 | $ 65.41 | $ 136,050 |
| Dallas-Fort Worth-Arlington, TX | 4,580 | 1.16 | 0.95 | $ 49.73 | $ 103,430 |
| Washington-Arlington-Alexandria, DC-VA-MD-WV | 3,850 | 1.24 | 1.02 | $ 63.80 | $ 132,710 |
| Houston-The Woodlands-Sugar Land, TX | 3,650 | 1.15 | 0.94 | $ 55.41 | $ 115,250 |
| Chicago-Naperville-Elgin, IL-IN-WI | 3,630 | 0.81 | 0.66 | $ 54.43 | $ 113,220 |
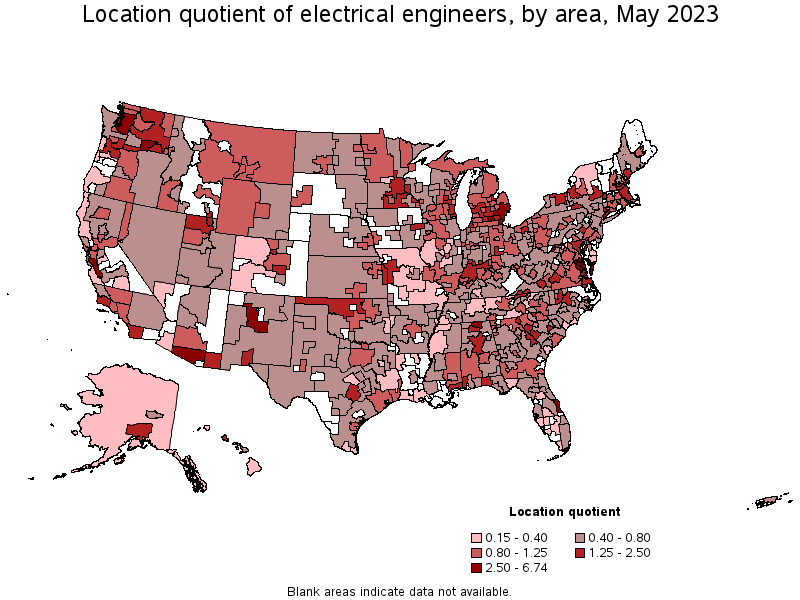
Metropolitan areas with the highest concentration of jobs and location quotients in Electrical Engineers:
| Metropolitan area | Employment (1) | Employment per thousand jobs | Location quotient (9) | Hourly mean wage | Annual mean wage (2) |
|---|---|---|---|---|---|
| Huntsville, AL | 2,070 | 8.24 | 6.74 | $ 57.57 | $ 119,740 |
| California-Lexington Park, MD | 330 | 6.98 | 5.71 | $ 60.73 | $ 126,320 |
| San Jose-Sunnyvale-Santa Clara, CA | 7,440 | 6.51 | 5.33 | $ 89.13 | $ 185,390 |
| Jackson, MI | 250 | 4.48 | 3.67 | $ 52.16 | $ 108,500 |
| Tucson, AZ | 1,710 | 4.45 | 3.65 | $ 58.98 | $ 122,670 |
| Monroe, MI | 160 | 4.05 | 3.32 | $ 49.69 | $ 103,350 |
| Kennewick-Richland, WA | 480 | 3.87 | 3.17 | $ 62.18 | $ 129,340 |
| Albuquerque, NM | 1,360 | 3.43 | 2.81 | $ 66.99 | $ 139,340 |
| Palm Bay-Melbourne-Titusville, FL | 790 | 3.35 | 2.74 | $ 55.45 | $ 115,330 |
| Detroit-Warren-Dearborn, MI | 6,180 | 3.25 | 2.66 | $ 49.99 | $ 103,980 |
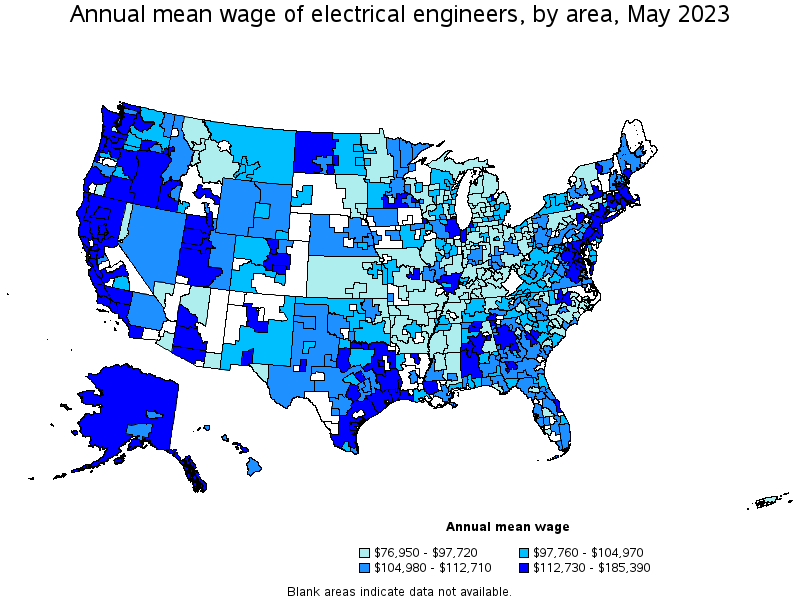
Top paying metropolitan areas for Electrical Engineers:
| Metropolitan area | Employment (1) | Employment per thousand jobs | Location quotient (9) | Hourly mean wage | Annual mean wage (2) |
|---|---|---|---|---|---|
| San Jose-Sunnyvale-Santa Clara, CA | 7,440 | 6.51 | 5.33 | $ 89.13 | $ 185,390 |
| Santa Maria-Santa Barbara, CA | 320 | 1.60 | 1.31 | $ 74.14 | $ 154,220 |
| San Francisco-Oakland-Hayward, CA | 3,350 | 1.38 | 1.13 | $ 72.36 | $ 150,500 |
| Albuquerque, NM | 1,360 | 3.43 | 2.81 | $ 66.99 | $ 139,340 |
| Chico, CA | 70 | 0.84 | 0.69 | $ 65.49 | $ 136,220 |
| Boston-Cambridge-Nashua, MA-NH | 4,640 | 1.68 | 1.37 | $ 65.41 | $ 136,050 |
| Los Angeles-Long Beach-Anaheim, CA | 8,790 | 1.42 | 1.16 | $ 64.66 | $ 134,500 |
| Bridgeport-Stamford-Norwalk, CT | 710 | 1.76 | 1.44 | $ 64.54 | $ 134,240 |
| San Diego-Carlsbad, CA | 2,640 | 1.73 | 1.42 | $ 64.00 | $ 133,130 |
| Austin-Round Rock, TX | 2,600 | 2.11 | 1.72 | $ 63.93 | $ 132,970 |
Nonmetropolitan areas with the highest employment in Electrical Engineers:
| Nonmetropolitan area | Employment (1) | Employment per thousand jobs | Location quotient (9) | Hourly mean wage | Annual mean wage (2) |
|---|---|---|---|---|---|
| Northeast Virginia nonmetropolitan area | 380 | 7.56 | 6.19 | $ 59.37 | $ 123,480 |
| Kansas nonmetropolitan area | 360 | 0.93 | 0.76 | $ 45.38 | $ 94,390 |
| West Northwestern Ohio nonmetropolitan area | 310 | 1.25 | 1.02 | $ 45.81 | $ 95,290 |
| Eastern Washington nonmetropolitan area | 300 | 2.85 | 2.33 | $ 48.53 | $ 100,940 |
| Southern Indiana nonmetropolitan area | 300 | 1.60 | 1.31 | $ 45.20 | $ 94,020 |
Nonmetropolitan areas with the highest concentration of jobs and location quotients in Electrical Engineers:
| Nonmetropolitan area | Employment (1) | Employment per thousand jobs | Location quotient (9) | Hourly mean wage | Annual mean wage (2) |
|---|---|---|---|---|---|
| Northeast Virginia nonmetropolitan area | 380 | 7.56 | 6.19 | $ 59.37 | $ 123,480 |
| Eastern Washington nonmetropolitan area | 300 | 2.85 | 2.33 | $ 48.53 | $ 100,940 |
| Upper Savannah South Carolina nonmetropolitan area | 160 | 2.01 | 1.64 | $ 44.84 | $ 93,270 |
| Southeast Minnesota nonmetropolitan area | 270 | 1.82 | 1.49 | $ 55.72 | $ 115,900 |
| Northwest Oklahoma nonmetropolitan area | 160 | 1.70 | 1.39 | $ 49.78 | $ 103,550 |
Top paying nonmetropolitan areas for Electrical Engineers:
| Nonmetropolitan area | Employment (1) | Employment per thousand jobs | Location quotient (9) | Hourly mean wage | Annual mean wage (2) |
|---|---|---|---|---|---|
| Big Thicket Region of Texas nonmetropolitan area | 40 | 0.40 | 0.32 | $ 63.32 | $ 131,710 |
| Coast Oregon nonmetropolitan area | 30 | 0.30 | 0.25 | $ 62.13 | $ 129,240 |
| North Coast Region of California nonmetropolitan area | 40 | 0.36 | 0.30 | $ 61.69 | $ 128,310 |
| Northeast Virginia nonmetropolitan area | 380 | 7.56 | 6.19 | $ 59.37 | $ 123,480 |
| Eastern Oregon nonmetropolitan area | 50 | 0.63 | 0.51 | $ 59.33 | $ 123,410 |
These estimates are calculated with data collected from employers in all industry sectors, all metropolitan and nonmetropolitan areas, and all states and the District of Columbia. The top employment and wage figures are provided above. The complete list is available in the downloadable XLS files.
The percentile wage estimate is the value of a wage below which a certain percent of workers fall. The median wage is the 50th percentile wage estimate—50 percent of workers earn less than the median and 50 percent of workers earn more than the median. More about percentile wages.
(1) Estimates for detailed occupations do not sum to the totals because the totals include occupations not shown separately. Estimates do not include self-employed workers.
(2) Annual wages have been calculated by multiplying the hourly mean wage by a "year-round, full-time" hours figure of 2,080 hours; for those occupations where there is not an hourly wage published, the annual wage has been directly calculated from the reported survey data.
(3) The relative standard error (RSE) is a measure of the reliability of a survey statistic. The smaller the relative standard error, the more precise the estimate.
(8) Estimate not released.
(9) The location quotient is the ratio of the area concentration of occupational employment to the national average concentration. A location quotient greater than one indicates the occupation has a higher share of employment than average, and a location quotient less than one indicates the occupation is less prevalent in the area than average.
Other OEWS estimates and related information:
May 2023 National Occupational Employment and Wage Estimates
May 2023 State Occupational Employment and Wage Estimates
May 2023 Metropolitan and Nonmetropolitan Area Occupational Employment and Wage Estimates
May 2023 National Industry-Specific Occupational Employment and Wage Estimates
Last Modified Date: April 3, 2024