
An official website of the United States government
An official website of the United States government
The .gov means it's official.
Federal government websites often end in .gov or .mil. Before sharing sensitive information,
make sure you're on a federal government site.
The site is secure.
The
https:// ensures that you are connecting to the official website and that any
information you provide is encrypted and transmitted securely.
This occupation includes the 2018 SOC occupations 31-1121 Home Health Aides and 31-1122 Personal Care Aides.
Employment estimate and mean wage estimates for Home Health and Personal Care Aides:
| Employment (1) | Employment RSE (3) |
Mean hourly wage |
Mean annual wage (2) |
Wage RSE (3) |
|---|---|---|---|---|
| 3,689,350 | 0.3 % | $ 16.05 | $ 33,380 | 0.2 % |
Percentile wage estimates for Home Health and Personal Care Aides:
| Percentile | 10% | 25% | 50% (Median) |
75% | 90% |
|---|---|---|---|---|---|
| Hourly Wage | $ 11.49 | $ 14.00 | $ 16.12 | $ 17.57 | $ 20.41 |
| Annual Wage (2) | $ 23,910 | $ 29,120 | $ 33,530 | $ 36,550 | $ 42,450 |
Industries with the highest published employment and wages for Home Health and Personal Care Aides are provided. For a list of all industries with employment in Home Health and Personal Care Aides, see the Create Customized Tables function.
Industries with the highest levels of employment in Home Health and Personal Care Aides:
| Industry | Employment (1) | Percent of industry employment | Hourly mean wage | Annual mean wage (2) |
|---|---|---|---|---|
| Individual and Family Services | 1,910,140 | 64.02 | $ 15.94 | $ 33,160 |
| Home Health Care Services | 931,330 | 58.14 | $ 15.44 | $ 32,120 |
| Residential Intellectual and Developmental Disability, Mental Health, and Substance Abuse Facilities | 293,550 | 47.13 | $ 16.83 | $ 35,010 |
| Continuing Care Retirement Communities and Assisted Living Facilities for the Elderly | 245,370 | 26.56 | $ 16.87 | $ 35,090 |
| Nursing Care Facilities (Skilled Nursing Facilities) | 49,110 | 3.56 | $ 16.88 | $ 35,120 |
Industries with the highest concentration of employment in Home Health and Personal Care Aides:
| Industry | Employment (1) | Percent of industry employment | Hourly mean wage | Annual mean wage (2) |
|---|---|---|---|---|
| Individual and Family Services | 1,910,140 | 64.02 | $ 15.94 | $ 33,160 |
| Home Health Care Services | 931,330 | 58.14 | $ 15.44 | $ 32,120 |
| Residential Intellectual and Developmental Disability, Mental Health, and Substance Abuse Facilities | 293,550 | 47.13 | $ 16.83 | $ 35,010 |
| Other Residential Care Facilities | 44,630 | 29.01 | $ 16.44 | $ 34,190 |
| Continuing Care Retirement Communities and Assisted Living Facilities for the Elderly | 245,370 | 26.56 | $ 16.87 | $ 35,090 |
Top paying industries for Home Health and Personal Care Aides:
| Industry | Employment (1) | Percent of industry employment | Hourly mean wage | Annual mean wage (2) |
|---|---|---|---|---|
| Securities, Commodity Contracts, and Other Financial Investments and Related Activities | 320 | 0.03 | $ 22.84 | $ 47,510 |
| Other Investment Pools and Funds | 670 | 3.59 | $ 22.43 | $ 46,660 |
| State Government, excluding Schools and Hospitals (OEWS Designation) | 24,390 | 1.15 | $ 21.11 | $ 43,910 |
| Grantmaking and Giving Services | 290 | 0.18 | $ 20.04 | $ 41,680 |
| Land Subdivision | (8) | (8) | $ 19.76 | $ 41,090 |
States and areas with the highest published employment, location quotients, and wages for Home Health and Personal Care Aides are provided. For a list of all areas with employment in Home Health and Personal Care Aides, see the Create Customized Tables function.
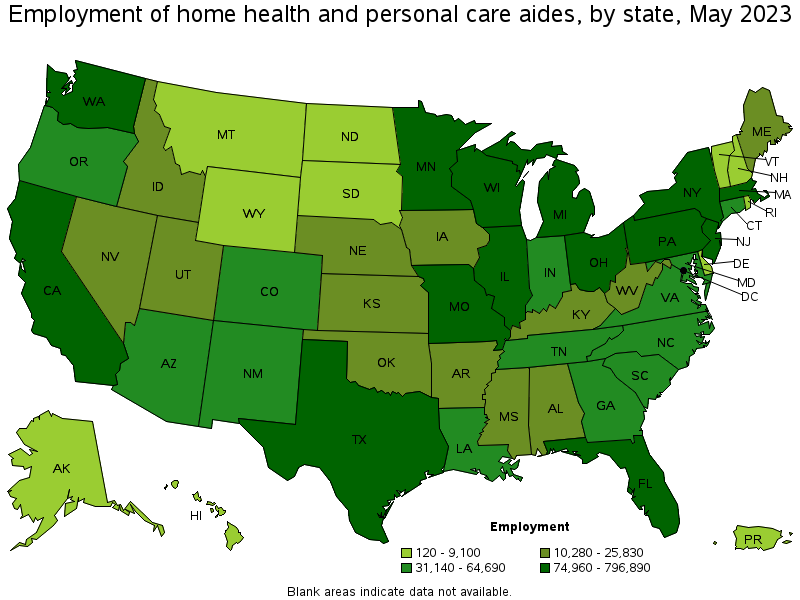
States with the highest employment level in Home Health and Personal Care Aides:
| State | Employment (1) | Employment per thousand jobs | Location quotient (9) | Hourly mean wage | Annual mean wage (2) |
|---|---|---|---|---|---|
| California | 796,890 | 44.41 | 1.83 | $ 16.93 | $ 35,220 |
| New York | 566,160 | 60.28 | 2.48 | $ 18.41 | $ 38,280 |
| Texas | 312,420 | 23.04 | 0.95 | $ 11.47 | $ 23,850 |
| Pennsylvania | 213,020 | 35.81 | 1.47 | $ 14.70 | $ 30,580 |
| Massachusetts | 113,730 | 31.21 | 1.28 | $ 18.54 | $ 38,550 |
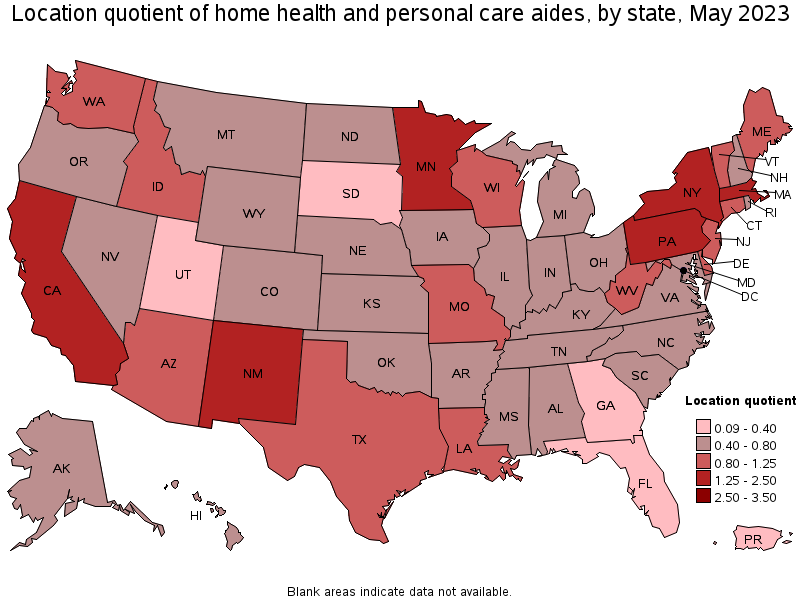
States with the highest concentration of jobs and location quotients in Home Health and Personal Care Aides:
| State | Employment (1) | Employment per thousand jobs | Location quotient (9) | Hourly mean wage | Annual mean wage (2) |
|---|---|---|---|---|---|
| New York | 566,160 | 60.28 | 2.48 | $ 18.41 | $ 38,280 |
| California | 796,890 | 44.41 | 1.83 | $ 16.93 | $ 35,220 |
| New Mexico | 36,560 | 43.24 | 1.78 | $ 13.62 | $ 28,330 |
| Minnesota | 112,010 | 38.88 | 1.60 | $ 16.64 | $ 34,620 |
| Pennsylvania | 213,020 | 35.81 | 1.47 | $ 14.70 | $ 30,580 |
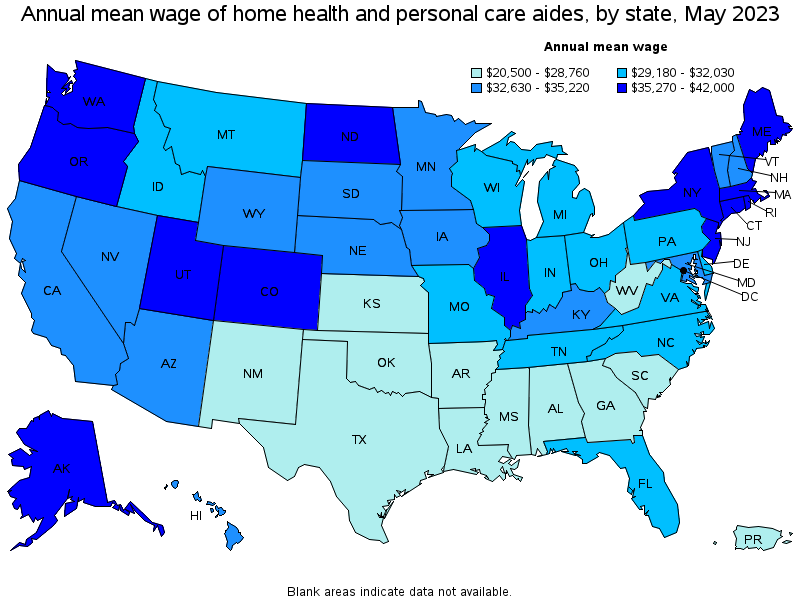
Top paying states for Home Health and Personal Care Aides:
| State | Employment (1) | Employment per thousand jobs | Location quotient (9) | Hourly mean wage | Annual mean wage (2) |
|---|---|---|---|---|---|
| Washington | 79,080 | 22.62 | 0.93 | $ 20.19 | $ 42,000 |
| Oregon | 33,060 | 17.01 | 0.70 | $ 19.26 | $ 40,060 |
| Rhode Island | 8,040 | 16.48 | 0.68 | $ 18.63 | $ 38,760 |
| Massachusetts | 113,730 | 31.21 | 1.28 | $ 18.54 | $ 38,550 |
| Alaska | 5,660 | 18.15 | 0.75 | $ 18.53 | $ 38,540 |
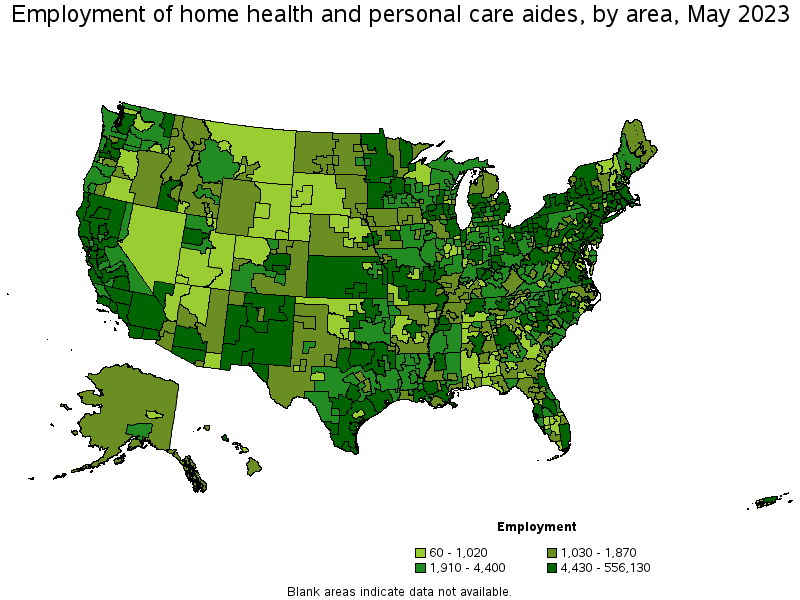
Metropolitan areas with the highest employment level in Home Health and Personal Care Aides:
| Metropolitan area | Employment (1) | Employment per thousand jobs | Location quotient (9) | Hourly mean wage | Annual mean wage (2) |
|---|---|---|---|---|---|
| New York-Newark-Jersey City, NY-NJ-PA | 556,130 | 58.57 | 2.41 | $ 18.40 | $ 38,260 |
| Los Angeles-Long Beach-Anaheim, CA | 321,030 | 51.90 | 2.14 | $ 16.92 | $ 35,190 |
| Philadelphia-Camden-Wilmington, PA-NJ-DE-MD | 124,640 | 44.05 | 1.81 | $ 15.05 | $ 31,310 |
| San Francisco-Oakland-Hayward, CA | 100,590 | 41.53 | 1.71 | $ 17.53 | $ 36,470 |
| Chicago-Naperville-Elgin, IL-IN-WI | 86,590 | 19.21 | 0.79 | $ 17.08 | $ 35,530 |
| Minneapolis-St. Paul-Bloomington, MN-WI | 80,120 | 41.93 | 1.73 | $ 16.64 | $ 34,610 |
| Riverside-San Bernardino-Ontario, CA | 79,320 | 47.73 | 1.96 | $ 16.07 | $ 33,420 |
| Boston-Cambridge-Nashua, MA-NH | 68,220 | 24.70 | 1.02 | $ 18.74 | $ 38,980 |
| Houston-The Woodlands-Sugar Land, TX | 64,130 | 20.17 | 0.83 | $ 11.66 | $ 24,250 |
| Dallas-Fort Worth-Arlington, TX | 51,970 | 13.10 | 0.54 | $ 12.20 | $ 25,380 |
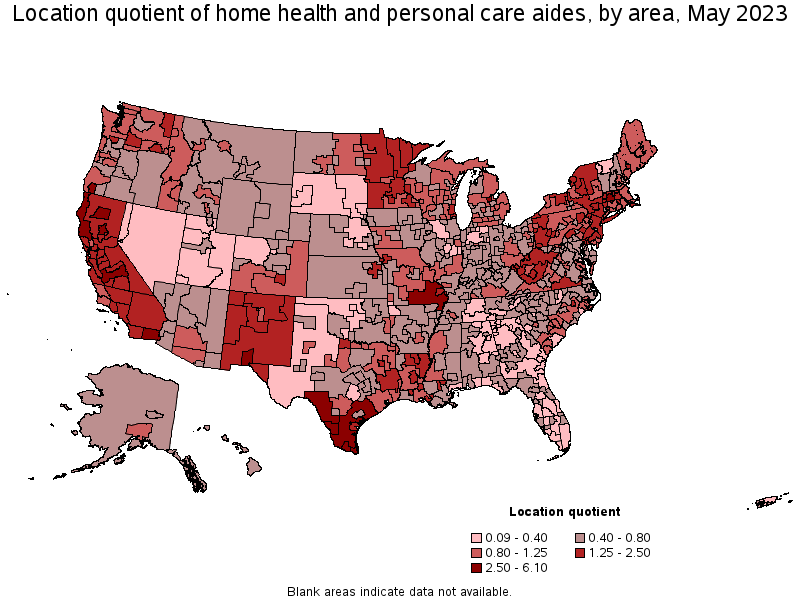
Metropolitan areas with the highest concentration of jobs and location quotients in Home Health and Personal Care Aides:
| Metropolitan area | Employment (1) | Employment per thousand jobs | Location quotient (9) | Hourly mean wage | Annual mean wage (2) |
|---|---|---|---|---|---|
| McAllen-Edinburg-Mission, TX | 42,390 | 148.28 | 6.10 | $ 10.85 | $ 22,570 |
| Brownsville-Harlingen, TX | 19,670 | 127.23 | 5.24 | $ 10.66 | $ 22,170 |
| El Centro, CA | 6,640 | 105.55 | 4.34 | $ 15.81 | $ 32,890 |
| Grants Pass, OR | 2,850 | 94.27 | 3.88 | (8) | (8) |
| Laredo, TX | 7,480 | 71.50 | 2.94 | $ 10.27 | $ 21,370 |
| Redding, CA | 4,810 | 70.71 | 2.91 | $ 16.10 | $ 33,490 |
| Las Cruces, NM | 5,000 | 66.25 | 2.73 | $ 12.73 | $ 26,480 |
| Chico, CA | 5,060 | 64.86 | 2.67 | $ 16.25 | $ 33,790 |
| Fresno, CA | 25,750 | 63.00 | 2.59 | $ 16.61 | $ 34,540 |
| Midland, MI | 2,270 | 62.81 | 2.59 | $ 13.42 | $ 27,900 |
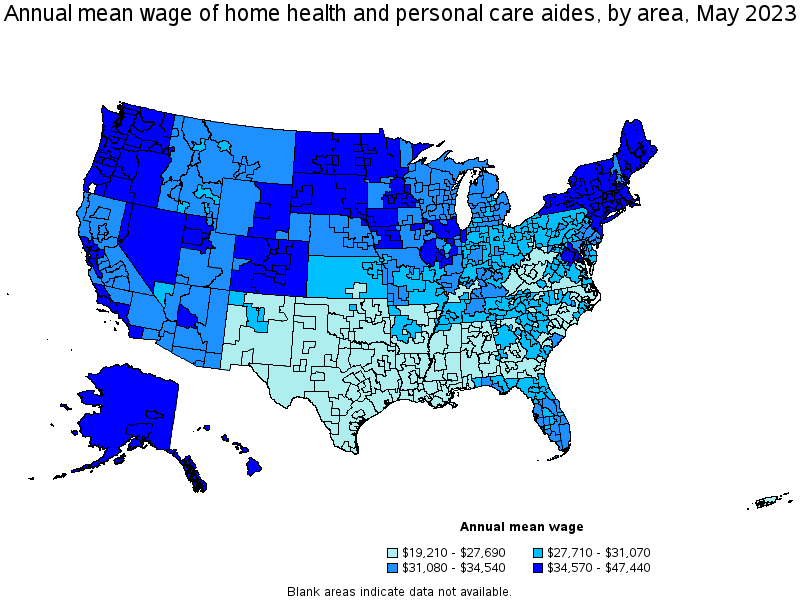
Top paying metropolitan areas for Home Health and Personal Care Aides:
| Metropolitan area | Employment (1) | Employment per thousand jobs | Location quotient (9) | Hourly mean wage | Annual mean wage (2) |
|---|---|---|---|---|---|
| Carson City, NV | 390 | 12.70 | 0.52 | $ 22.81 | $ 47,440 |
| Seattle-Tacoma-Bellevue, WA | 40,980 | 19.71 | 0.81 | $ 20.96 | $ 43,600 |
| Bremerton-Silverdale, WA | 1,780 | 19.17 | 0.79 | $ 19.99 | $ 41,570 |
| Portland-Vancouver-Hillsboro, OR-WA | 18,330 | 15.20 | 0.63 | $ 19.92 | $ 41,430 |
| Kennewick-Richland, WA | 3,320 | 26.52 | 1.09 | $ 19.61 | $ 40,780 |
| Mount Vernon-Anacortes, WA | 1,000 | 20.00 | 0.82 | $ 19.59 | $ 40,760 |
| Boulder, CO | 1,740 | 8.93 | 0.37 | $ 19.56 | $ 40,690 |
| Bellingham, WA | 1,920 | 21.18 | 0.87 | $ 19.49 | $ 40,540 |
| Longview, WA | 1,310 | 31.81 | 1.31 | $ 19.46 | $ 40,470 |
| Olympia-Tumwater, WA | 2,620 | 21.33 | 0.88 | $ 19.40 | $ 40,360 |
Nonmetropolitan areas with the highest employment in Home Health and Personal Care Aides:
| Nonmetropolitan area | Employment (1) | Employment per thousand jobs | Location quotient (9) | Hourly mean wage | Annual mean wage (2) |
|---|---|---|---|---|---|
| Southeast Missouri nonmetropolitan area | 11,450 | 70.61 | 2.91 | $ 14.43 | $ 30,000 |
| Coastal Plains Region of Texas nonmetropolitan area | 9,170 | 61.63 | 2.54 | $ 10.79 | $ 22,450 |
| North Coast Region of California nonmetropolitan area | 8,450 | 79.98 | 3.29 | $ 16.50 | $ 34,330 |
| Central East New York nonmetropolitan area | 7,500 | 47.61 | 1.96 | $ 19.47 | $ 40,490 |
| Kansas nonmetropolitan area | 6,860 | 17.64 | 0.73 | $ 13.36 | $ 27,780 |
Nonmetropolitan areas with the highest concentration of jobs and location quotients in Home Health and Personal Care Aides:
| Nonmetropolitan area | Employment (1) | Employment per thousand jobs | Location quotient (9) | Hourly mean wage | Annual mean wage (2) |
|---|---|---|---|---|---|
| North Coast Region of California nonmetropolitan area | 8,450 | 79.98 | 3.29 | $ 16.50 | $ 34,330 |
| Southeast Missouri nonmetropolitan area | 11,450 | 70.61 | 2.91 | $ 14.43 | $ 30,000 |
| Border Region of Texas nonmetropolitan area | 3,780 | 63.43 | 2.61 | $ 11.00 | $ 22,880 |
| Coastal Plains Region of Texas nonmetropolitan area | 9,170 | 61.63 | 2.54 | $ 10.79 | $ 22,450 |
| Northern New Mexico nonmetropolitan area | 4,700 | 58.25 | 2.40 | $ 13.11 | $ 27,260 |
Top paying nonmetropolitan areas for Home Health and Personal Care Aides:
| Nonmetropolitan area | Employment (1) | Employment per thousand jobs | Location quotient (9) | Hourly mean wage | Annual mean wage (2) |
|---|---|---|---|---|---|
| Alaska nonmetropolitan area | 1,230 | 11.97 | 0.49 | $ 19.54 | $ 40,630 |
| Western Washington nonmetropolitan area | 3,860 | 30.11 | 1.24 | $ 19.51 | $ 40,580 |
| Central East New York nonmetropolitan area | 7,500 | 47.61 | 1.96 | $ 19.47 | $ 40,490 |
| Eastern Washington nonmetropolitan area | 2,470 | 23.83 | 0.98 | $ 19.29 | $ 40,130 |
| Northwest Colorado nonmetropolitan area | 580 | 4.62 | 0.19 | $ 19.25 | $ 40,040 |
These estimates are calculated with data collected from employers in all industry sectors, all metropolitan and nonmetropolitan areas, and all states and the District of Columbia. The top employment and wage figures are provided above. The complete list is available in the downloadable XLS files.
The percentile wage estimate is the value of a wage below which a certain percent of workers fall. The median wage is the 50th percentile wage estimate—50 percent of workers earn less than the median and 50 percent of workers earn more than the median. More about percentile wages.
(1) Estimates for detailed occupations do not sum to the totals because the totals include occupations not shown separately. Estimates do not include self-employed workers.
(2) Annual wages have been calculated by multiplying the hourly mean wage by a "year-round, full-time" hours figure of 2,080 hours; for those occupations where there is not an hourly wage published, the annual wage has been directly calculated from the reported survey data.
(3) The relative standard error (RSE) is a measure of the reliability of a survey statistic. The smaller the relative standard error, the more precise the estimate.
(8) Estimate not released.
(9) The location quotient is the ratio of the area concentration of occupational employment to the national average concentration. A location quotient greater than one indicates the occupation has a higher share of employment than average, and a location quotient less than one indicates the occupation is less prevalent in the area than average.
Other OEWS estimates and related information:
May 2023 National Occupational Employment and Wage Estimates
May 2023 State Occupational Employment and Wage Estimates
May 2023 Metropolitan and Nonmetropolitan Area Occupational Employment and Wage Estimates
May 2023 National Industry-Specific Occupational Employment and Wage Estimates
Last Modified Date: April 3, 2024