
An official website of the United States government
An official website of the United States government
The .gov means it's official.
Federal government websites often end in .gov or .mil. Before sharing sensitive information,
make sure you're on a federal government site.
The site is secure.
The
https:// ensures that you are connecting to the official website and that any
information you provide is encrypted and transmitted securely.
Answer inquiries and provide information to the general public, customers, visitors, and other interested parties regarding activities conducted at establishment and location of departments, offices, and employees within the organization. Excludes �Switchboard Operators, Including Answering Service� (43-2011).
Employment estimate and mean wage estimates for Receptionists and Information Clerks:
| Employment (1) | Employment RSE (3) |
Mean hourly wage |
Mean annual wage (2) |
Wage RSE (3) |
|---|---|---|---|---|
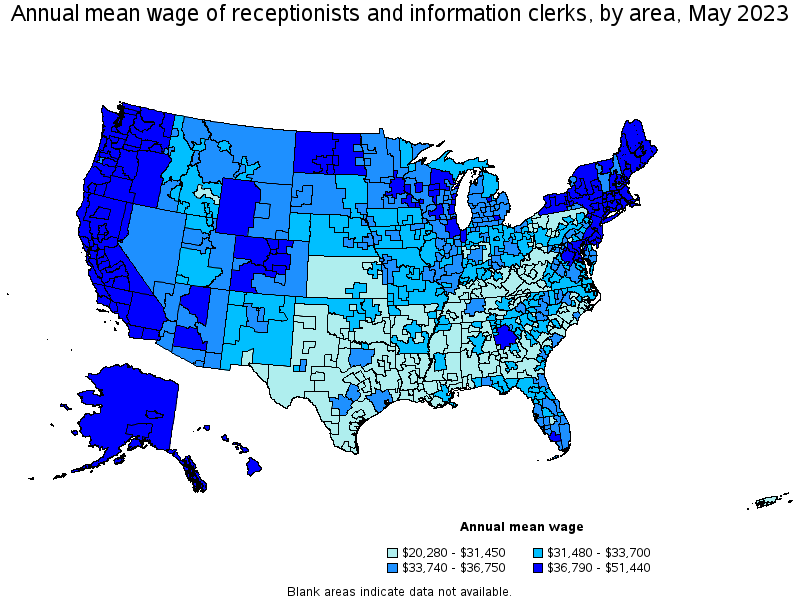
| 1,003,820 | 1.1 % | $ 17.59 | $ 36,590 | 0.2 % |
Percentile wage estimates for Receptionists and Information Clerks:
| Percentile | 10% | 25% | 50% (Median) |
75% | 90% |
|---|---|---|---|---|---|
| Hourly Wage | $ 12.95 | $ 14.64 | $ 17.23 | $ 19.58 | $ 22.77 |
| Annual Wage (2) | $ 26,940 | $ 30,450 | $ 35,840 | $ 40,720 | $ 47,360 |
Industries with the highest published employment and wages for Receptionists and Information Clerks are provided. For a list of all industries with employment in Receptionists and Information Clerks, see the Create Customized Tables function.
Industries with the highest levels of employment in Receptionists and Information Clerks:
| Industry | Employment (1) | Percent of industry employment | Hourly mean wage | Annual mean wage (2) |
|---|---|---|---|---|
| Offices of Physicians | 174,460 | 6.14 | $ 18.20 | $ 37,860 |
| Offices of Dentists | 83,950 | 8.21 | $ 20.41 | $ 42,460 |
| Personal Care Services | 70,820 | 9.67 | $ 15.23 | $ 31,680 |
| Offices of Other Health Practitioners | 68,100 | 5.97 | $ 17.05 | $ 35,450 |
| Other Professional, Scientific, and Technical Services | 62,590 | 7.30 | $ 17.04 | $ 35,440 |
Industries with the highest concentration of employment in Receptionists and Information Clerks:
| Industry | Employment (1) | Percent of industry employment | Hourly mean wage | Annual mean wage (2) |
|---|---|---|---|---|
| Personal Care Services | 70,820 | 9.67 | $ 15.23 | $ 31,680 |
| Offices of Dentists | 83,950 | 8.21 | $ 20.41 | $ 42,460 |
| Other Professional, Scientific, and Technical Services | 62,590 | 7.30 | $ 17.04 | $ 35,440 |
| Offices of Physicians | 174,460 | 6.14 | $ 18.20 | $ 37,860 |
| Offices of Other Health Practitioners | 68,100 | 5.97 | $ 17.05 | $ 35,450 |
Top paying industries for Receptionists and Information Clerks:
| Industry | Employment (1) | Percent of industry employment | Hourly mean wage | Annual mean wage (2) |
|---|---|---|---|---|
| Postal Service (Federal Government) | 300 | 0.05 | $ 32.31 | $ 67,210 |
| Scenic and Sightseeing Transportation, Water | 30 | 0.21 | $ 28.78 | $ 59,870 |
| Web Search Portals, Libraries, Archives, and Other Information Services | 120 | 0.06 | $ 24.69 | $ 51,360 |
| Securities, Commodity Contracts, and Other Financial Investments and Related Activities | 4,100 | 0.39 | $ 23.29 | $ 48,430 |
| Electric Power Generation, Transmission and Distribution | 320 | 0.08 | $ 22.73 | $ 47,270 |
States and areas with the highest published employment, location quotients, and wages for Receptionists and Information Clerks are provided. For a list of all areas with employment in Receptionists and Information Clerks, see the Create Customized Tables function.
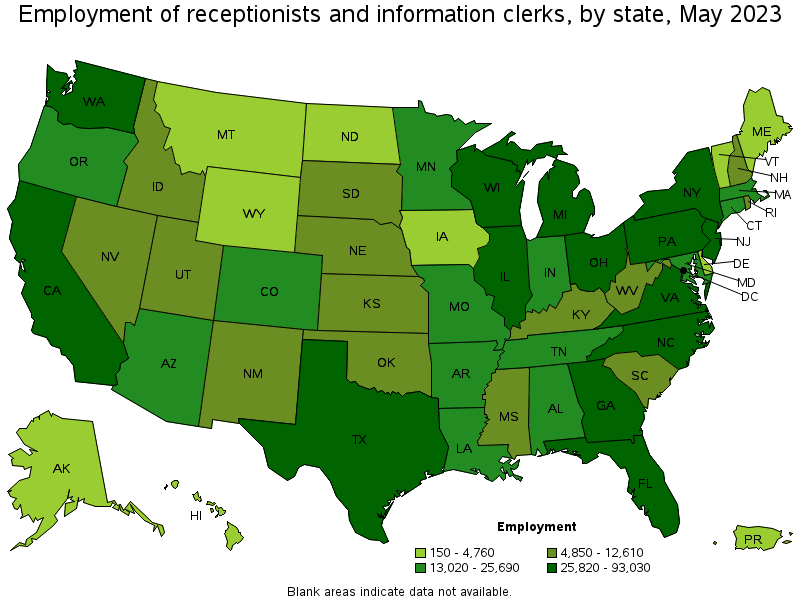
States with the highest employment level in Receptionists and Information Clerks:
| State | Employment (1) | Employment per thousand jobs | Location quotient (9) | Hourly mean wage | Annual mean wage (2) |
|---|---|---|---|---|---|
| Texas | 93,030 | 6.86 | 1.04 | $ 16.03 | $ 33,330 |
| California | 75,510 | 4.21 | 0.64 | $ 20.63 | $ 42,920 |
| New York | 75,060 | 7.99 | 1.21 | $ 20.08 | $ 41,760 |
| Florida | 69,980 | 7.31 | 1.11 | $ 16.74 | $ 34,820 |
| New Jersey | 47,910 | 11.40 | 1.72 | $ 19.07 | $ 39,670 |
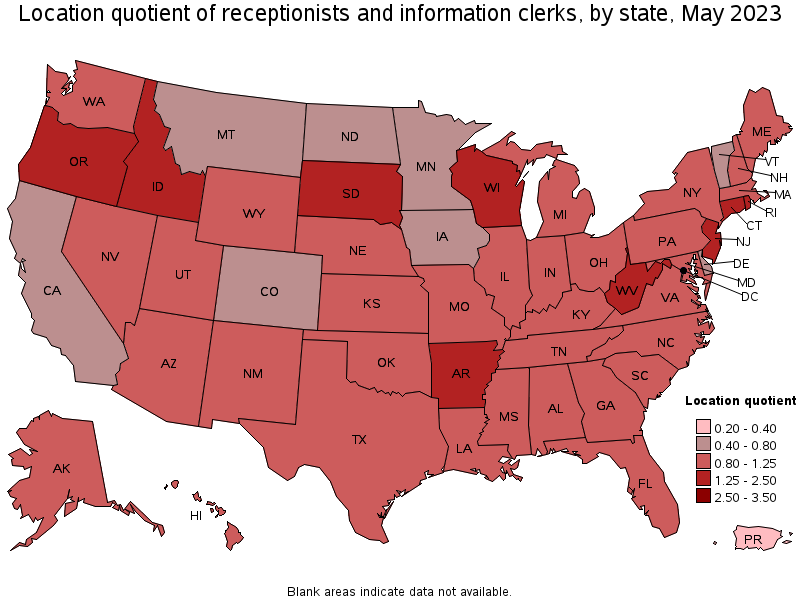
States with the highest concentration of jobs and location quotients in Receptionists and Information Clerks:
| State | Employment (1) | Employment per thousand jobs | Location quotient (9) | Hourly mean wage | Annual mean wage (2) |
|---|---|---|---|---|---|
| South Dakota | 5,990 | 13.48 | 2.04 | $ 16.49 | $ 34,300 |
| New Jersey | 47,910 | 11.40 | 1.72 | $ 19.07 | $ 39,670 |
| Rhode Island | 5,500 | 11.26 | 1.70 | $ 19.16 | $ 39,850 |
| Arkansas | 13,020 | 10.24 | 1.55 | $ 15.66 | $ 32,570 |
| Wisconsin | 27,290 | 9.46 | 1.43 | $ 17.98 | $ 37,390 |
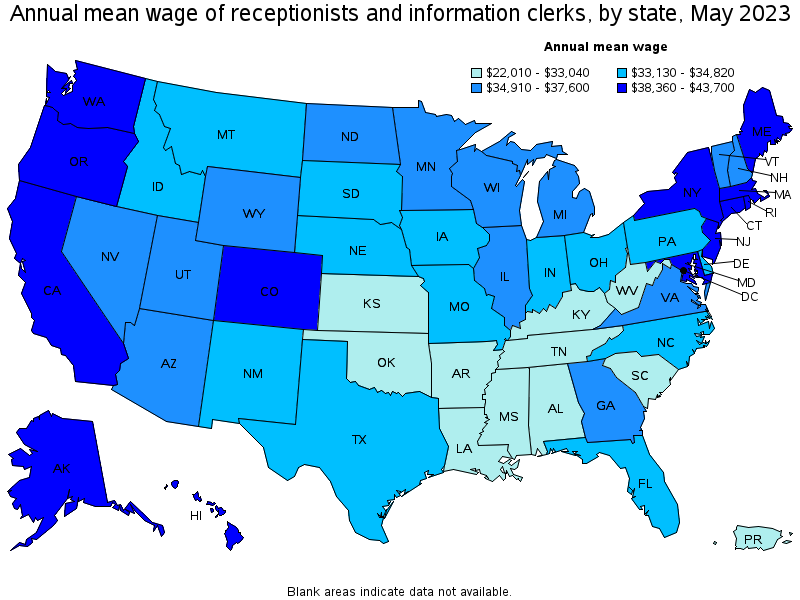
Top paying states for Receptionists and Information Clerks:
| State | Employment (1) | Employment per thousand jobs | Location quotient (9) | Hourly mean wage | Annual mean wage (2) |
|---|---|---|---|---|---|
| District of Columbia | 3,140 | 4.47 | 0.68 | $ 21.01 | $ 43,700 |
| California | 75,510 | 4.21 | 0.64 | $ 20.63 | $ 42,920 |
| Washington | 26,120 | 7.47 | 1.13 | $ 20.17 | $ 41,950 |
| New York | 75,060 | 7.99 | 1.21 | $ 20.08 | $ 41,760 |
| Massachusetts | 23,420 | 6.43 | 0.97 | $ 19.99 | $ 41,570 |
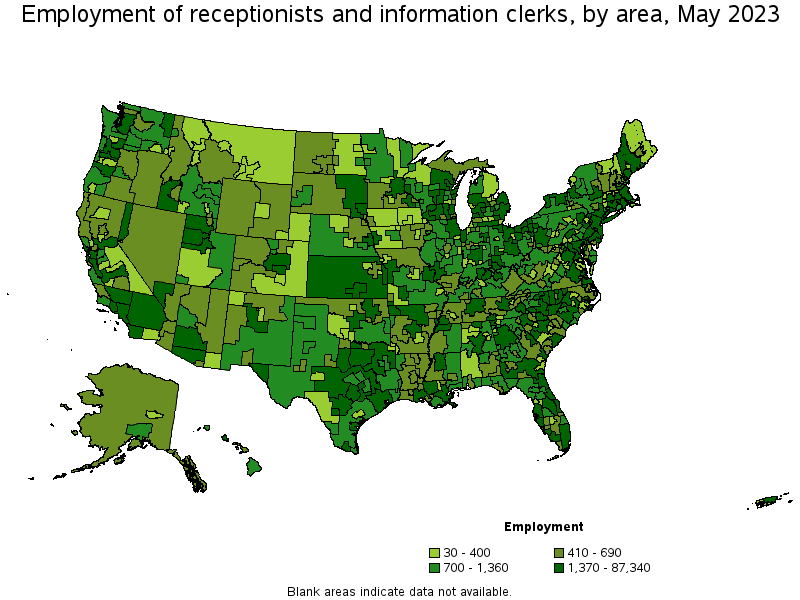
Metropolitan areas with the highest employment level in Receptionists and Information Clerks:
| Metropolitan area | Employment (1) | Employment per thousand jobs | Location quotient (9) | Hourly mean wage | Annual mean wage (2) |
|---|---|---|---|---|---|
| New York-Newark-Jersey City, NY-NJ-PA | 87,340 | 9.20 | 1.39 | $ 20.27 | $ 42,150 |
| Chicago-Naperville-Elgin, IL-IN-WI | 33,740 | 7.49 | 1.13 | $ 18.16 | $ 37,780 |
| Los Angeles-Long Beach-Anaheim, CA | 26,560 | 4.29 | 0.65 | $ 19.64 | $ 40,850 |
| Dallas-Fort Worth-Arlington, TX | 25,200 | 6.35 | 0.96 | $ 16.78 | $ 34,890 |
| Miami-Fort Lauderdale-West Palm Beach, FL | 23,320 | 8.57 | 1.30 | $ 17.26 | $ 35,890 |
| Houston-The Woodlands-Sugar Land, TX | 22,650 | 7.13 | 1.08 | $ 16.56 | $ 34,450 |
| Atlanta-Sandy Springs-Roswell, GA | 21,630 | 7.68 | 1.16 | $ 17.95 | $ 37,340 |
| Philadelphia-Camden-Wilmington, PA-NJ-DE-MD | 20,410 | 7.21 | 1.09 | $ 17.97 | $ 37,380 |
| Washington-Arlington-Alexandria, DC-VA-MD-WV | 18,750 | 6.06 | 0.92 | $ 19.16 | $ 39,850 |
| Phoenix-Mesa-Scottsdale, AZ | 18,550 | 8.10 | 1.23 | $ 18.19 | $ 37,830 |
Metropolitan areas with the highest concentration of jobs and location quotients in Receptionists and Information Clerks:
| Metropolitan area | Employment (1) | Employment per thousand jobs | Location quotient (9) | Hourly mean wage | Annual mean wage (2) |
|---|---|---|---|---|---|
| Rapid City, SD | 1,160 | 16.17 | 2.45 | $ 16.61 | $ 34,540 |
| Hot Springs, AR | 610 | 15.98 | 2.42 | $ 14.81 | $ 30,810 |
| Sioux Falls, SD | 2,430 | 14.65 | 2.22 | $ 16.64 | $ 34,610 |
| Little Rock-North Little Rock-Conway, AR | 4,590 | 13.26 | 2.01 | $ 16.19 | $ 33,670 |
| Rochester, MN | 1,570 | 13.18 | 1.99 | $ 20.21 | $ 42,030 |
| Idaho Falls, ID | 1,030 | 13.16 | 1.99 | $ 14.98 | $ 31,160 |
| Atlantic City-Hammonton, NJ | 1,540 | 12.27 | 1.86 | $ 18.13 | $ 37,710 |
| Parkersburg-Vienna, WV | 440 | 12.17 | 1.84 | $ 14.20 | $ 29,540 |
| Medford, OR | 1,060 | 12.07 | 1.83 | $ 18.25 | $ 37,950 |
| Jonesboro, AR | 690 | 11.78 | 1.78 | $ 15.44 | $ 32,120 |
Top paying metropolitan areas for Receptionists and Information Clerks:
| Metropolitan area | Employment (1) | Employment per thousand jobs | Location quotient (9) | Hourly mean wage | Annual mean wage (2) |
|---|---|---|---|---|---|
| San Jose-Sunnyvale-Santa Clara, CA | 3,390 | 2.97 | 0.45 | $ 24.73 | $ 51,440 |
| San Francisco-Oakland-Hayward, CA | 10,000 | 4.13 | 0.62 | $ 24.11 | $ 50,140 |
| Vallejo-Fairfield, CA | 670 | 4.87 | 0.74 | $ 23.99 | $ 49,890 |
| Santa Rosa, CA | 1,180 | 5.72 | 0.87 | $ 22.27 | $ 46,310 |
| Sacramento--Roseville--Arden-Arcade, CA | 5,220 | 4.98 | 0.75 | $ 21.87 | $ 45,490 |
| Napa, CA | 320 | 4.11 | 0.62 | $ 21.32 | $ 44,340 |
| Seattle-Tacoma-Bellevue, WA | 14,160 | 6.81 | 1.03 | $ 21.06 | $ 43,800 |
| Stockton-Lodi, CA | 1,010 | 3.63 | 0.55 | $ 20.66 | $ 42,980 |
| Barnstable Town, MA | 880 | 8.69 | 1.32 | $ 20.33 | $ 42,290 |
| Santa Cruz-Watsonville, CA | 560 | 5.76 | 0.87 | $ 20.31 | $ 42,250 |
Nonmetropolitan areas with the highest employment in Receptionists and Information Clerks:
| Nonmetropolitan area | Employment (1) | Employment per thousand jobs | Location quotient (9) | Hourly mean wage | Annual mean wage (2) |
|---|---|---|---|---|---|
| Northeastern Wisconsin nonmetropolitan area | 2,180 | 11.17 | 1.69 | $ 17.74 | $ 36,890 |
| North Northeastern Ohio nonmetropolitan area (noncontiguous) | 1,910 | 5.87 | 0.89 | $ 15.30 | $ 31,810 |
| Kansas nonmetropolitan area | 1,880 | 4.85 | 0.73 | $ 14.96 | $ 31,110 |
| North Texas Region of Texas nonmetropolitan area | 1,760 | 6.32 | 0.96 | $ 14.40 | $ 29,940 |
| South Central Wisconsin nonmetropolitan area | 1,630 | 7.91 | 1.20 | $ 17.30 | $ 35,990 |
Nonmetropolitan areas with the highest concentration of jobs and location quotients in Receptionists and Information Clerks:
| Nonmetropolitan area | Employment (1) | Employment per thousand jobs | Location quotient (9) | Hourly mean wage | Annual mean wage (2) |
|---|---|---|---|---|---|
| North Arkansas nonmetropolitan area | 1,380 | 11.73 | 1.77 | $ 14.90 | $ 30,990 |
| East South Dakota nonmetropolitan area | 1,530 | 11.59 | 1.75 | $ 16.09 | $ 33,470 |
| Northeastern Wisconsin nonmetropolitan area | 2,180 | 11.17 | 1.69 | $ 17.74 | $ 36,890 |
| West South Dakota nonmetropolitan area | 690 | 11.15 | 1.69 | $ 16.30 | $ 33,900 |
| Connecticut nonmetropolitan area | 300 | 8.93 | 1.35 | $ 18.61 | $ 38,700 |
Top paying nonmetropolitan areas for Receptionists and Information Clerks:
| Nonmetropolitan area | Employment (1) | Employment per thousand jobs | Location quotient (9) | Hourly mean wage | Annual mean wage (2) |
|---|---|---|---|---|---|
| Alaska nonmetropolitan area | 540 | 5.20 | 0.79 | $ 19.91 | $ 41,410 |
| Massachusetts nonmetropolitan area | 400 | 6.31 | 0.95 | $ 19.80 | $ 41,180 |
| North Coast Region of California nonmetropolitan area | 510 | 4.82 | 0.73 | $ 19.75 | $ 41,080 |
| Eastern Sierra-Mother Lode Region of California nonmetropolitan area | 260 | 4.22 | 0.64 | $ 19.56 | $ 40,680 |
| North Valley-Northern Mountains Region of California nonmetropolitan area | 520 | 5.11 | 0.77 | $ 19.49 | $ 40,530 |
These estimates are calculated with data collected from employers in all industry sectors, all metropolitan and nonmetropolitan areas, and all states and the District of Columbia. The top employment and wage figures are provided above. The complete list is available in the downloadable XLS files.
The percentile wage estimate is the value of a wage below which a certain percent of workers fall. The median wage is the 50th percentile wage estimate—50 percent of workers earn less than the median and 50 percent of workers earn more than the median. More about percentile wages.
(1) Estimates for detailed occupations do not sum to the totals because the totals include occupations not shown separately. Estimates do not include self-employed workers.
(2) Annual wages have been calculated by multiplying the hourly mean wage by a "year-round, full-time" hours figure of 2,080 hours; for those occupations where there is not an hourly wage published, the annual wage has been directly calculated from the reported survey data.
(3) The relative standard error (RSE) is a measure of the reliability of a survey statistic. The smaller the relative standard error, the more precise the estimate.
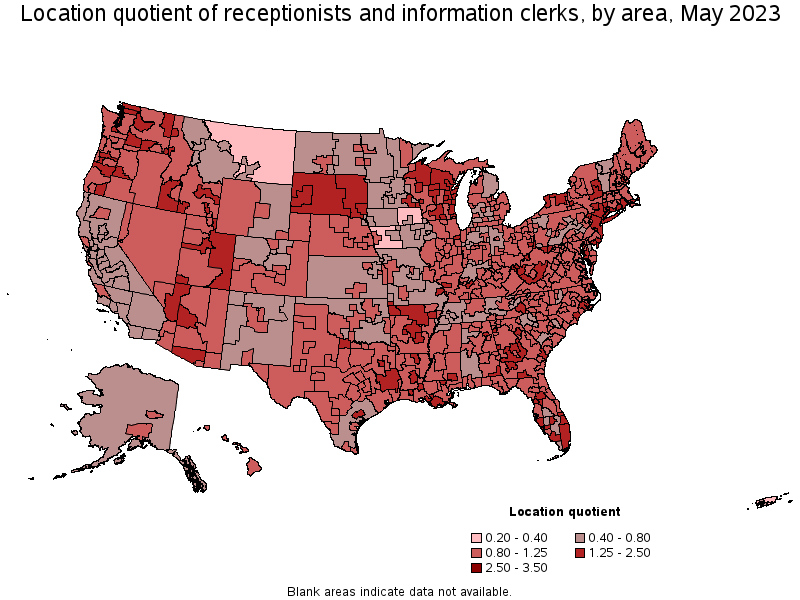
(9) The location quotient is the ratio of the area concentration of occupational employment to the national average concentration. A location quotient greater than one indicates the occupation has a higher share of employment than average, and a location quotient less than one indicates the occupation is less prevalent in the area than average.
Other OEWS estimates and related information:
May 2023 National Occupational Employment and Wage Estimates
May 2023 State Occupational Employment and Wage Estimates
May 2023 Metropolitan and Nonmetropolitan Area Occupational Employment and Wage Estimates
May 2023 National Industry-Specific Occupational Employment and Wage Estimates
Last Modified Date: April 3, 2024