
An official website of the United States government
An official website of the United States government
The .gov means it's official.
Federal government websites often end in .gov or .mil. Before sharing sensitive information,
make sure you're on a federal government site.
The site is secure.
The
https:// ensures that you are connecting to the official website and that any
information you provide is encrypted and transmitted securely.
Process new insurance policies, modifications to existing policies, and claims forms. Obtain information from policyholders to verify the accuracy and completeness of information on claims forms, applications and related documents, and company records. Update existing policies and company records to reflect changes requested by policyholders and insurance company representatives. Excludes �Claims Adjusters, Examiners, and Investigators� (13-1031).
Employment estimate and mean wage estimates for Insurance Claims and Policy Processing Clerks:
| Employment (1) | Employment RSE (3) |
Mean hourly wage |
Mean annual wage (2) |
Wage RSE (3) |
|---|---|---|---|---|
| 241,650 | 1.1 % | $ 23.81 | $ 49,530 | 0.3 % |
Percentile wage estimates for Insurance Claims and Policy Processing Clerks:
| Percentile | 10% | 25% | 50% (Median) |
75% | 90% |
|---|---|---|---|---|---|
| Hourly Wage | $ 17.07 | $ 18.66 | $ 22.55 | $ 27.61 | $ 32.87 |
| Annual Wage (2) | $ 35,510 | $ 38,810 | $ 46,900 | $ 57,420 | $ 68,370 |
Industries with the highest published employment and wages for Insurance Claims and Policy Processing Clerks are provided. For a list of all industries with employment in Insurance Claims and Policy Processing Clerks, see the Create Customized Tables function.
Industries with the highest levels of employment in Insurance Claims and Policy Processing Clerks:
| Industry | Employment (1) | Percent of industry employment | Hourly mean wage | Annual mean wage (2) |
|---|---|---|---|---|
| Agencies, Brokerages, and Other Insurance Related Activities | 100,400 | 7.56 | $ 23.69 | $ 49,270 |
| Insurance Carriers | 88,460 | 7.23 | $ 25.00 | $ 52,000 |
| Management of Companies and Enterprises | 9,180 | 0.33 | $ 23.38 | $ 48,620 |
| Offices of Physicians | 5,840 | 0.21 | $ 21.15 | $ 43,990 |
| Offices of Dentists | 4,280 | 0.42 | $ 21.02 | $ 43,730 |
Industries with the highest concentration of employment in Insurance Claims and Policy Processing Clerks:
| Industry | Employment (1) | Percent of industry employment | Hourly mean wage | Annual mean wage (2) |
|---|---|---|---|---|
| Agencies, Brokerages, and Other Insurance Related Activities | 100,400 | 7.56 | $ 23.69 | $ 49,270 |
| Insurance Carriers | 88,460 | 7.23 | $ 25.00 | $ 52,000 |
| Insurance and Employee Benefit Funds | 590 | 5.18 | $ 24.39 | $ 50,730 |
| Offices of Dentists | 4,280 | 0.42 | $ 21.02 | $ 43,730 |
| Management of Companies and Enterprises | 9,180 | 0.33 | $ 23.38 | $ 48,620 |
Top paying industries for Insurance Claims and Policy Processing Clerks:
| Industry | Employment (1) | Percent of industry employment | Hourly mean wage | Annual mean wage (2) |
|---|---|---|---|---|
| Residential Building Construction | 80 | 0.01 | $ 31.46 | $ 65,430 |
| Business, Professional, Labor, Political, and Similar Organizations | 140 | 0.03 | $ 30.77 | $ 64,000 |
| Local Government, excluding Schools and Hospitals (OEWS Designation) | 1,300 | 0.02 | $ 29.12 | $ 60,560 |
| Travel Arrangement and Reservation Services | 300 | 0.16 | $ 28.82 | $ 59,950 |
| Colleges, Universities, and Professional Schools | 220 | 0.01 | $ 28.32 | $ 58,900 |
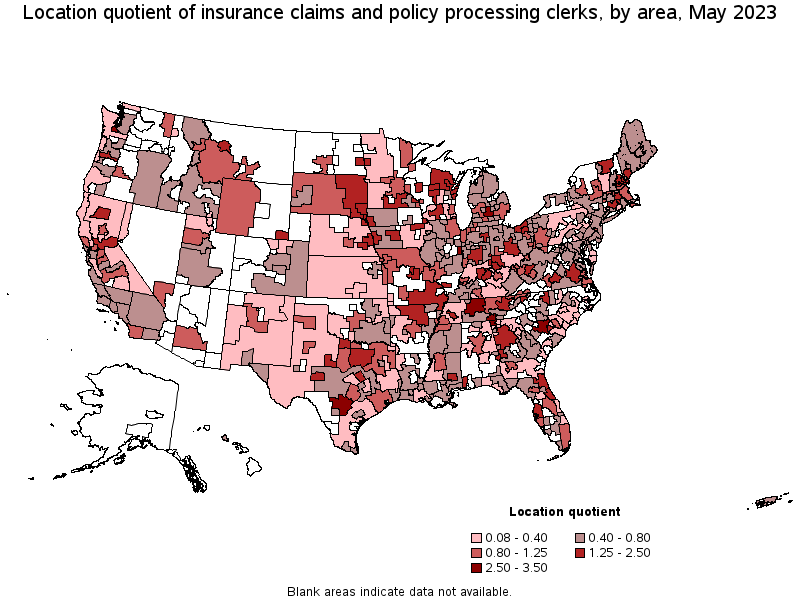
States and areas with the highest published employment, location quotients, and wages for Insurance Claims and Policy Processing Clerks are provided. For a list of all areas with employment in Insurance Claims and Policy Processing Clerks, see the Create Customized Tables function.
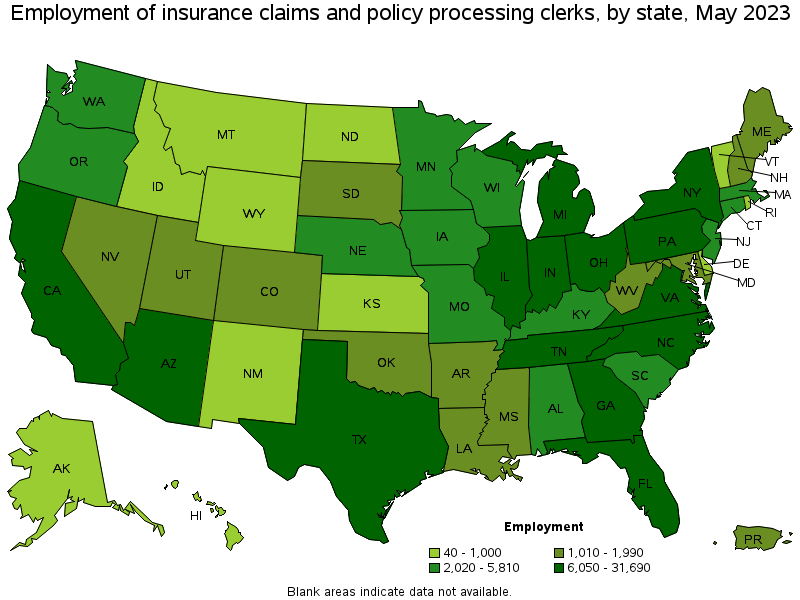
States with the highest employment level in Insurance Claims and Policy Processing Clerks:
| State | Employment (1) | Employment per thousand jobs | Location quotient (9) | Hourly mean wage | Annual mean wage (2) |
|---|---|---|---|---|---|
| Texas | 31,690 | 2.34 | 1.47 | $ 25.50 | $ 53,030 |
| California | 24,390 | 1.36 | 0.85 | $ 24.81 | $ 51,600 |
| Florida | 19,810 | 2.07 | 1.30 | $ 22.72 | $ 47,260 |
| Ohio | 14,870 | 2.72 | 1.71 | $ 23.96 | $ 49,830 |
| Tennessee | 10,840 | 3.37 | 2.12 | $ 21.31 | $ 44,320 |
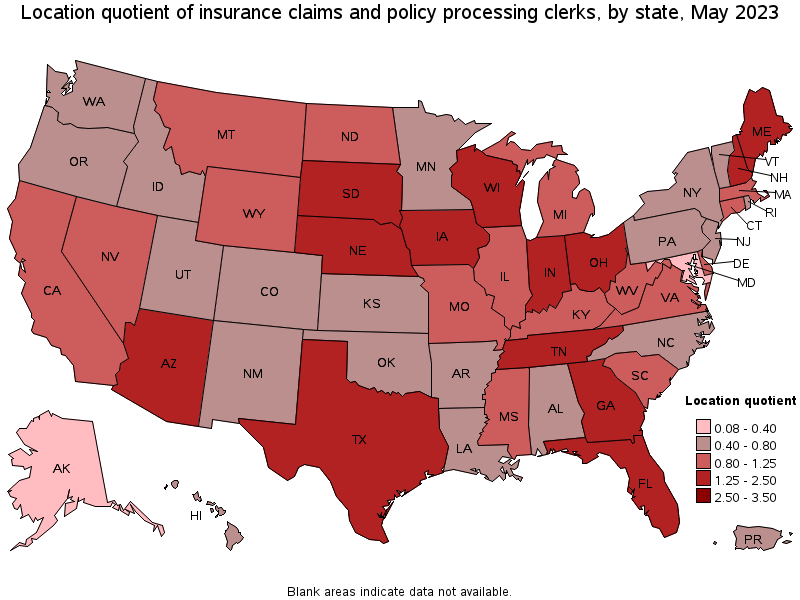
States with the highest concentration of jobs and location quotients in Insurance Claims and Policy Processing Clerks:
| State | Employment (1) | Employment per thousand jobs | Location quotient (9) | Hourly mean wage | Annual mean wage (2) |
|---|---|---|---|---|---|
| Tennessee | 10,840 | 3.37 | 2.12 | $ 21.31 | $ 44,320 |
| Ohio | 14,870 | 2.72 | 1.71 | $ 23.96 | $ 49,830 |
| South Dakota | 1,100 | 2.48 | 1.56 | $ 19.31 | $ 40,160 |
| Texas | 31,690 | 2.34 | 1.47 | $ 25.50 | $ 53,030 |
| Maine | 1,420 | 2.28 | 1.43 | $ 23.64 | $ 49,170 |
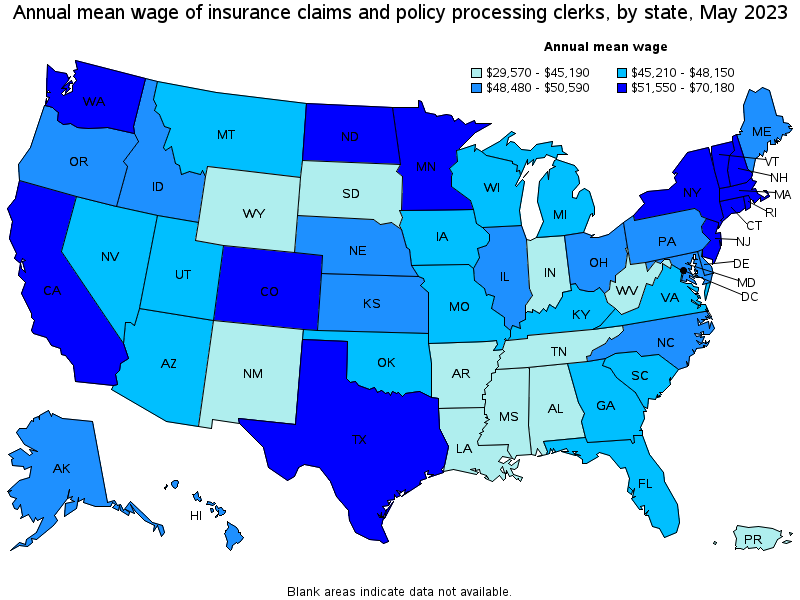
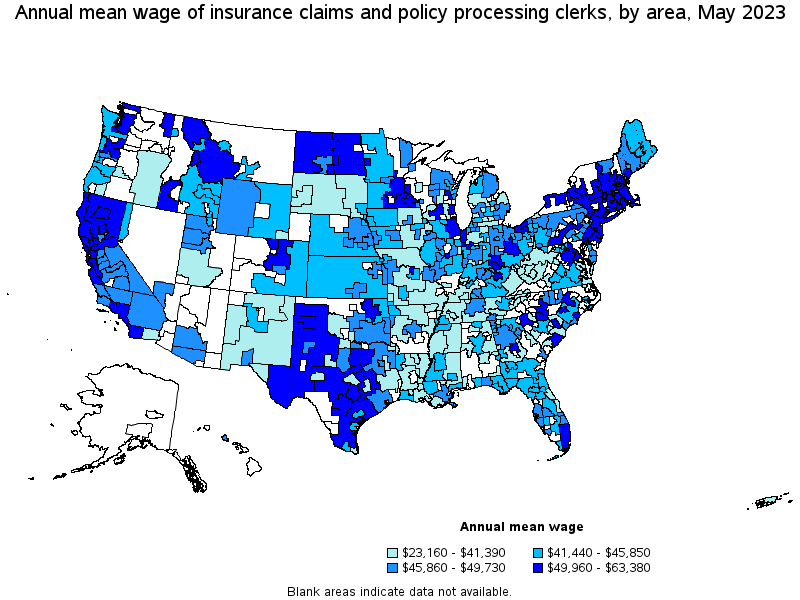
Top paying states for Insurance Claims and Policy Processing Clerks:
| State | Employment (1) | Employment per thousand jobs | Location quotient (9) | Hourly mean wage | Annual mean wage (2) |
|---|---|---|---|---|---|
| District of Columbia | (8) | (8) | (8) | $ 33.74 | $ 70,180 |
| Washington | 3,140 | 0.90 | 0.56 | $ 28.28 | $ 58,820 |
| New Hampshire | 1,340 | 1.99 | 1.25 | $ 27.84 | $ 57,900 |
| New York | 6,770 | 0.72 | 0.45 | $ 27.70 | $ 57,620 |
| Rhode Island | 550 | 1.13 | 0.71 | $ 27.59 | $ 57,380 |
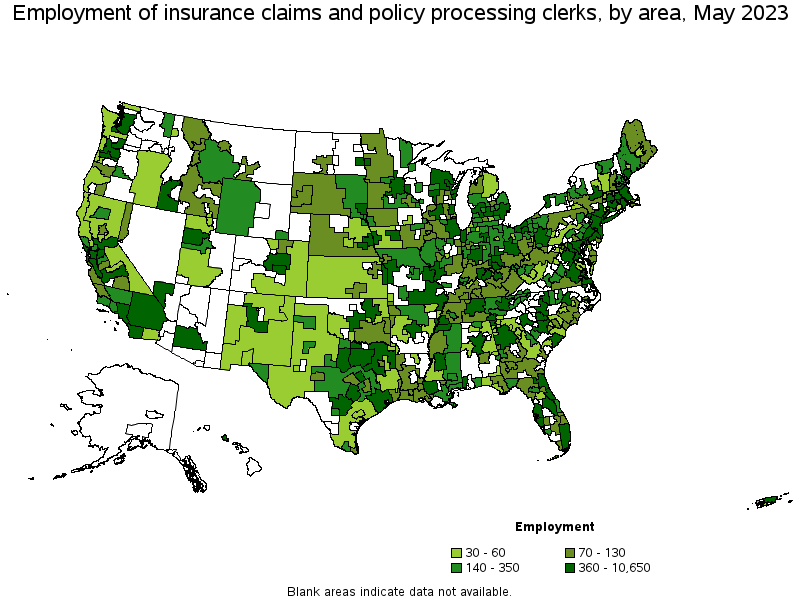
Metropolitan areas with the highest employment level in Insurance Claims and Policy Processing Clerks:
| Metropolitan area | Employment (1) | Employment per thousand jobs | Location quotient (9) | Hourly mean wage | Annual mean wage (2) |
|---|---|---|---|---|---|
| Dallas-Fort Worth-Arlington, TX | 10,650 | 2.69 | 1.69 | $ 28.04 | $ 58,320 |
| New York-Newark-Jersey City, NY-NJ-PA | 7,220 | 0.76 | 0.48 | $ 28.45 | $ 59,180 |
| Los Angeles-Long Beach-Anaheim, CA | 6,650 | 1.08 | 0.68 | $ 24.69 | $ 51,360 |
| Atlanta-Sandy Springs-Roswell, GA | 6,630 | 2.35 | 1.48 | $ 23.03 | $ 47,900 |
| Chicago-Naperville-Elgin, IL-IN-WI | 6,380 | 1.42 | 0.89 | $ 25.41 | $ 52,860 |
| Houston-The Woodlands-Sugar Land, TX | 5,440 | 1.71 | 1.07 | $ 22.42 | $ 46,630 |
| San Antonio-New Braunfels, TX | 4,840 | 4.44 | 2.79 | $ 26.92 | $ 55,990 |
| Tampa-St. Petersburg-Clearwater, FL | 4,550 | 3.22 | 2.02 | $ 23.08 | $ 48,000 |
| Phoenix-Mesa-Scottsdale, AZ | 4,520 | 1.98 | 1.24 | $ 22.47 | $ 46,740 |
| Nashville-Davidson--Murfreesboro--Franklin, TN | 4,310 | 4.01 | 2.52 | $ 22.21 | $ 46,190 |
Metropolitan areas with the highest concentration of jobs and location quotients in Insurance Claims and Policy Processing Clerks:
| Metropolitan area | Employment (1) | Employment per thousand jobs | Location quotient (9) | Hourly mean wage | Annual mean wage (2) |
|---|---|---|---|---|---|
| Olympia-Tumwater, WA | 670 | 5.42 | 3.40 | $ 26.34 | $ 54,780 |
| Danville, IL | 120 | 4.81 | 3.02 | $ 18.64 | $ 38,780 |
| Lansing-East Lansing, MI | 960 | 4.53 | 2.85 | $ 20.49 | $ 42,610 |
| San Antonio-New Braunfels, TX | 4,840 | 4.44 | 2.79 | $ 26.92 | $ 55,990 |
| Chattanooga, TN-GA | 1,120 | 4.29 | 2.69 | $ 22.87 | $ 47,570 |
| Columbia, SC | 1,610 | 4.22 | 2.65 | $ 21.49 | $ 44,700 |
| Nashville-Davidson--Murfreesboro--Franklin, TN | 4,310 | 4.01 | 2.52 | $ 22.21 | $ 46,190 |
| Wausau, WI | 270 | 3.90 | 2.45 | $ 23.17 | $ 48,200 |
| Portland-South Portland, ME | 790 | 3.80 | 2.39 | $ 24.31 | $ 50,570 |
| Des Moines-West Des Moines, IA | 1,460 | 3.80 | 2.39 | $ 23.04 | $ 47,930 |
Top paying metropolitan areas for Insurance Claims and Policy Processing Clerks:
| Metropolitan area | Employment (1) | Employment per thousand jobs | Location quotient (9) | Hourly mean wage | Annual mean wage (2) |
|---|---|---|---|---|---|
| Seattle-Tacoma-Bellevue, WA | 1,660 | 0.80 | 0.50 | $ 29.93 | $ 62,260 |
| San Francisco-Oakland-Hayward, CA | 2,310 | 0.95 | 0.60 | $ 29.65 | $ 61,670 |
| Hartford-West Hartford-East Hartford, CT | 1,320 | 2.35 | 1.47 | $ 28.91 | $ 60,130 |
| Waco, TX | 370 | 2.97 | 1.87 | $ 28.90 | $ 60,110 |
| Denver-Aurora-Lakewood, CO | 1,180 | 0.74 | 0.47 | $ 28.75 | $ 59,800 |
| New York-Newark-Jersey City, NY-NJ-PA | 7,220 | 0.76 | 0.48 | $ 28.45 | $ 59,180 |
| Manchester, NH | 280 | 2.57 | 1.61 | $ 28.37 | $ 59,020 |
| Dallas-Fort Worth-Arlington, TX | 10,650 | 2.69 | 1.69 | $ 28.04 | $ 58,320 |
| Spokane-Spokane Valley, WA | 330 | 1.30 | 0.82 | $ 27.79 | $ 57,800 |
| Boston-Cambridge-Nashua, MA-NH | 3,710 | 1.34 | 0.84 | $ 27.75 | $ 57,720 |
Nonmetropolitan areas with the highest employment in Insurance Claims and Policy Processing Clerks:
| Nonmetropolitan area | Employment (1) | Employment per thousand jobs | Location quotient (9) | Hourly mean wage | Annual mean wage (2) |
|---|---|---|---|---|---|
| Northeastern Wisconsin nonmetropolitan area | 470 | 2.38 | 1.50 | $ 23.89 | $ 49,680 |
| North Texas Region of Texas nonmetropolitan area | 390 | 1.41 | 0.89 | $ 22.57 | $ 46,950 |
| Southeast Missouri nonmetropolitan area | 390 | 2.40 | 1.51 | $ 19.21 | $ 39,950 |
| East South Dakota nonmetropolitan area | 340 | 2.58 | 1.62 | $ 17.70 | $ 36,820 |
| North Northeastern Ohio nonmetropolitan area (noncontiguous) | 310 | 0.95 | 0.60 | $ 22.27 | $ 46,310 |
Nonmetropolitan areas with the highest concentration of jobs and location quotients in Insurance Claims and Policy Processing Clerks:
| Nonmetropolitan area | Employment (1) | Employment per thousand jobs | Location quotient (9) | Hourly mean wage | Annual mean wage (2) |
|---|---|---|---|---|---|
| East South Dakota nonmetropolitan area | 340 | 2.58 | 1.62 | $ 17.70 | $ 36,820 |
| Southeast Missouri nonmetropolitan area | 390 | 2.40 | 1.51 | $ 19.21 | $ 39,950 |
| Northeastern Wisconsin nonmetropolitan area | 470 | 2.38 | 1.50 | $ 23.89 | $ 49,680 |
| Northern Vermont nonmetropolitan area | 150 | 2.17 | 1.36 | $ 22.70 | $ 47,210 |
| Central New Hampshire nonmetropolitan area | 200 | 2.12 | 1.33 | $ 30.47 | $ 63,380 |
Top paying nonmetropolitan areas for Insurance Claims and Policy Processing Clerks:
| Nonmetropolitan area | Employment (1) | Employment per thousand jobs | Location quotient (9) | Hourly mean wage | Annual mean wage (2) |
|---|---|---|---|---|---|
| Central New Hampshire nonmetropolitan area | 200 | 2.12 | 1.33 | $ 30.47 | $ 63,380 |
| West Central-Southwest New Hampshire nonmetropolitan area | 110 | 1.12 | 0.71 | $ 29.23 | $ 60,800 |
| Massachusetts nonmetropolitan area | 90 | 1.51 | 0.95 | $ 28.34 | $ 58,940 |
| Hill Country Region of Texas nonmetropolitan area | 200 | 0.97 | 0.61 | $ 27.80 | $ 57,830 |
| North Valley-Northern Mountains Region of California nonmetropolitan area | 40 | 0.37 | 0.23 | $ 25.85 | $ 53,770 |
These estimates are calculated with data collected from employers in all industry sectors, all metropolitan and nonmetropolitan areas, and all states and the District of Columbia. The top employment and wage figures are provided above. The complete list is available in the downloadable XLS files.
The percentile wage estimate is the value of a wage below which a certain percent of workers fall. The median wage is the 50th percentile wage estimate—50 percent of workers earn less than the median and 50 percent of workers earn more than the median. More about percentile wages.
(1) Estimates for detailed occupations do not sum to the totals because the totals include occupations not shown separately. Estimates do not include self-employed workers.
(2) Annual wages have been calculated by multiplying the hourly mean wage by a "year-round, full-time" hours figure of 2,080 hours; for those occupations where there is not an hourly wage published, the annual wage has been directly calculated from the reported survey data.
(3) The relative standard error (RSE) is a measure of the reliability of a survey statistic. The smaller the relative standard error, the more precise the estimate.
(8) Estimate not released.
(9) The location quotient is the ratio of the area concentration of occupational employment to the national average concentration. A location quotient greater than one indicates the occupation has a higher share of employment than average, and a location quotient less than one indicates the occupation is less prevalent in the area than average.
Other OEWS estimates and related information:
May 2023 National Occupational Employment and Wage Estimates
May 2023 State Occupational Employment and Wage Estimates
May 2023 Metropolitan and Nonmetropolitan Area Occupational Employment and Wage Estimates
May 2023 National Industry-Specific Occupational Employment and Wage Estimates
Last Modified Date: April 3, 2024