
An official website of the United States government
An official website of the United States government
The .gov means it's official.
Federal government websites often end in .gov or .mil. Before sharing sensitive information,
make sure you're on a federal government site.
The site is secure.
The
https:// ensures that you are connecting to the official website and that any
information you provide is encrypted and transmitted securely.
All office and administrative support workers not listed separately.
Employment estimate and mean wage estimates for Office and Administrative Support Workers, All Other:
| Employment (1) | Employment RSE (3) |
Mean hourly wage |
Mean annual wage (2) |
Wage RSE (3) |
|---|---|---|---|---|
| 172,020 | 1.0 % | $ 22.41 | $ 46,620 | 0.4 % |
Percentile wage estimates for Office and Administrative Support Workers, All Other:
| Percentile | 10% | 25% | 50% (Median) |
75% | 90% |
|---|---|---|---|---|---|
| Hourly Wage | $ 13.99 | $ 16.60 | $ 20.78 | $ 25.84 | $ 32.24 |
| Annual Wage (2) | $ 29,100 | $ 34,520 | $ 43,230 | $ 53,740 | $ 67,060 |
Industries with the highest published employment and wages for Office and Administrative Support Workers, All Other are provided. For a list of all industries with employment in Office and Administrative Support Workers, All Other, see the Create Customized Tables function.
Industries with the highest levels of employment in Office and Administrative Support Workers, All Other:
| Industry | Employment (1) | Percent of industry employment | Hourly mean wage | Annual mean wage (2) |
|---|---|---|---|---|
| Colleges, Universities, and Professional Schools | 35,200 | 1.14 | $ 20.31 | $ 42,250 |
| Local Government, excluding Schools and Hospitals (OEWS Designation) | 17,580 | 0.32 | $ 20.36 | $ 42,340 |
| Federal, State, and Local Government, excluding State and Local Government Schools and Hospitals and the U.S. Postal Service (OEWS Designation) | 12,210 | 0.57 | $ 26.23 | $ 54,560 |
| State Government, excluding Schools and Hospitals (OEWS Designation) | 7,980 | 0.38 | $ 23.04 | $ 47,910 |
| Elementary and Secondary Schools | 7,040 | 0.08 | $ 22.77 | $ 47,360 |
Industries with the highest concentration of employment in Office and Administrative Support Workers, All Other:
| Industry | Employment (1) | Percent of industry employment | Hourly mean wage | Annual mean wage (2) |
|---|---|---|---|---|
| Colleges, Universities, and Professional Schools | 35,200 | 1.14 | $ 20.31 | $ 42,250 |
| Federal, State, and Local Government, excluding State and Local Government Schools and Hospitals and the U.S. Postal Service (OEWS Designation) | 12,210 | 0.57 | $ 26.23 | $ 54,560 |
| Junior Colleges | 3,170 | 0.50 | $ 20.63 | $ 42,910 |
| State Government, excluding Schools and Hospitals (OEWS Designation) | 7,980 | 0.38 | $ 23.04 | $ 47,910 |
| Local Government, excluding Schools and Hospitals (OEWS Designation) | 17,580 | 0.32 | $ 20.36 | $ 42,340 |
Top paying industries for Office and Administrative Support Workers, All Other:
| Industry | Employment (1) | Percent of industry employment | Hourly mean wage | Annual mean wage (2) |
|---|---|---|---|---|
| Business Schools and Computer and Management Training | 70 | 0.08 | $ 39.24 | $ 81,610 |
| Electric Power Generation, Transmission and Distribution | 160 | 0.04 | $ 31.87 | $ 66,290 |
| Rental and Leasing Services (5322, 5323, and 5324 only) | 520 | 0.15 | $ 31.57 | $ 65,660 |
| Oil and Gas Extraction | (8) | (8) | $ 31.44 | $ 65,390 |
| Nonscheduled Air Transportation | 110 | 0.19 | $ 31.43 | $ 65,370 |
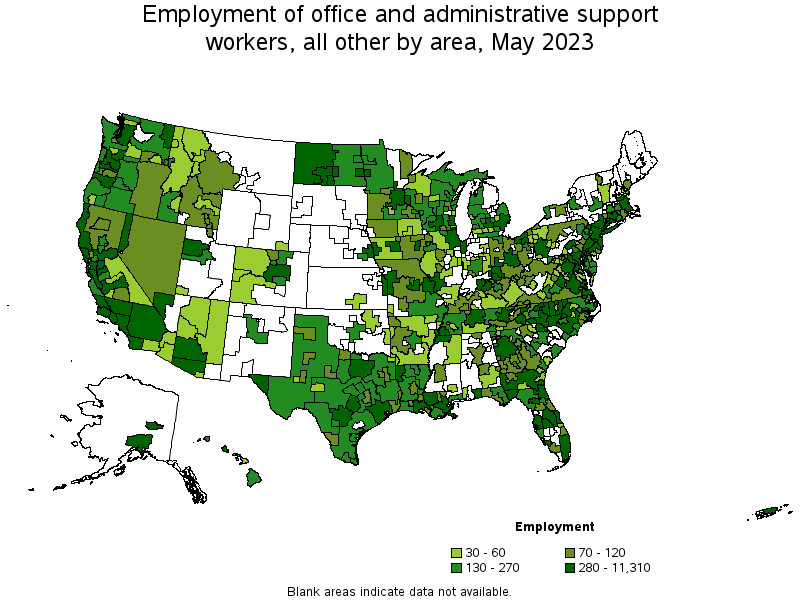
States and areas with the highest published employment, location quotients, and wages for Office and Administrative Support Workers, All Other are provided. For a list of all areas with employment in Office and Administrative Support Workers, All Other, see the Create Customized Tables function.
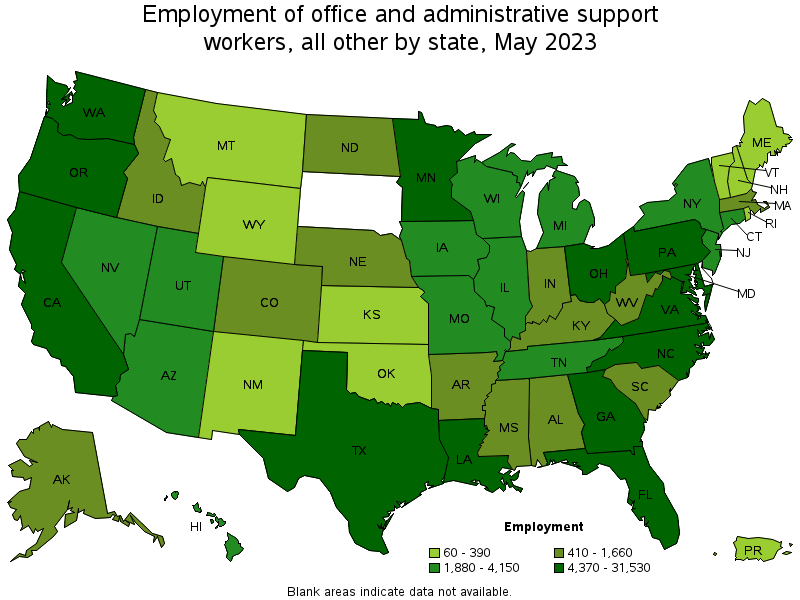
States with the highest employment level in Office and Administrative Support Workers, All Other:
| State | Employment (1) | Employment per thousand jobs | Location quotient (9) | Hourly mean wage | Annual mean wage (2) |
|---|---|---|---|---|---|
| California | 31,530 | 1.76 | 1.55 | $ 25.71 | $ 53,470 |
| Florida | 18,720 | 1.96 | 1.73 | $ 21.17 | $ 44,030 |
| Texas | 11,660 | 0.86 | 0.76 | $ 20.60 | $ 42,840 |
| Maryland | 8,560 | 3.20 | 2.82 | $ 24.07 | $ 50,060 |
| North Carolina | 7,380 | 1.54 | 1.36 | $ 21.88 | $ 45,510 |
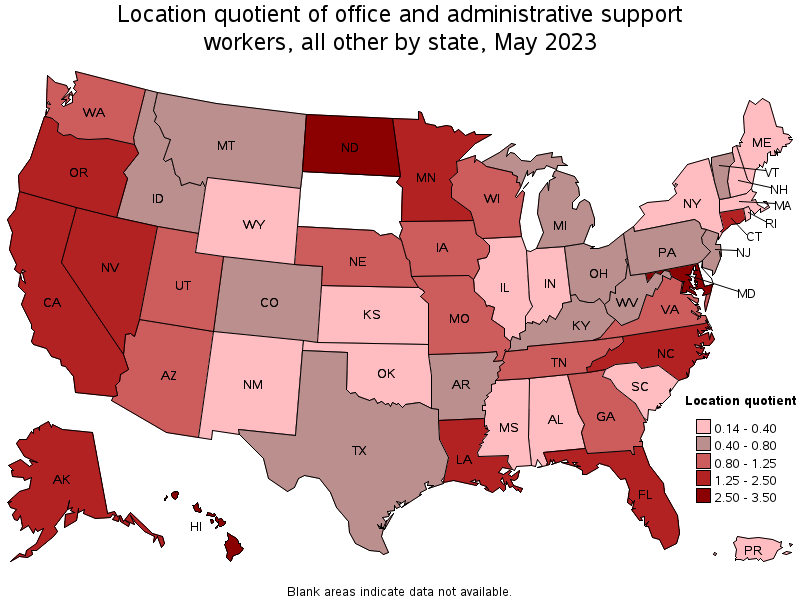
States with the highest concentration of jobs and location quotients in Office and Administrative Support Workers, All Other:
| State | Employment (1) | Employment per thousand jobs | Location quotient (9) | Hourly mean wage | Annual mean wage (2) |
|---|---|---|---|---|---|
| North Dakota | 1,520 | 3.64 | 3.22 | $ 26.71 | $ 55,550 |
| Hawaii | 2,210 | 3.58 | 3.16 | $ 14.97 | $ 31,130 |
| Maryland | 8,560 | 3.20 | 2.82 | $ 24.07 | $ 50,060 |
| Alaska | 830 | 2.68 | 2.36 | $ 21.77 | $ 45,280 |
| Louisiana | 4,880 | 2.64 | 2.33 | $ 20.88 | $ 43,440 |
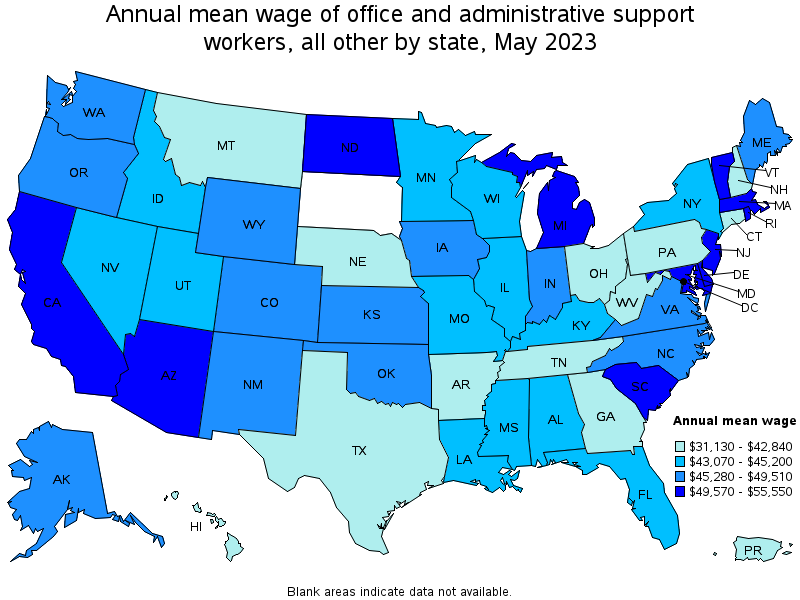
Top paying states for Office and Administrative Support Workers, All Other:
| State | Employment (1) | Employment per thousand jobs | Location quotient (9) | Hourly mean wage | Annual mean wage (2) |
|---|---|---|---|---|---|
| North Dakota | 1,520 | 3.64 | 3.22 | $ 26.71 | $ 55,550 |
| Massachusetts | 1,560 | 0.43 | 0.38 | $ 26.66 | $ 55,460 |
| Rhode Island | 100 | 0.20 | 0.18 | $ 26.52 | $ 55,170 |
| Vermont | 180 | 0.61 | 0.54 | $ 25.73 | $ 53,510 |
| California | 31,530 | 1.76 | 1.55 | $ 25.71 | $ 53,470 |
Metropolitan areas with the highest employment level in Office and Administrative Support Workers, All Other:
| Metropolitan area | Employment (1) | Employment per thousand jobs | Location quotient (9) | Hourly mean wage | Annual mean wage (2) |
|---|---|---|---|---|---|
| Los Angeles-Long Beach-Anaheim, CA | 11,310 | 1.83 | 1.61 | $ 25.57 | $ 53,190 |
| Washington-Arlington-Alexandria, DC-VA-MD-WV | 6,120 | 1.98 | 1.75 | $ 25.92 | $ 53,910 |
| Minneapolis-St. Paul-Bloomington, MN-WI | 5,510 | 2.88 | 2.54 | $ 21.71 | $ 45,160 |
| Baltimore-Columbia-Towson, MD | 4,830 | 3.71 | 3.27 | $ 24.25 | $ 50,440 |
| San Francisco-Oakland-Hayward, CA | 4,010 | 1.65 | 1.46 | $ 28.73 | $ 59,760 |
| New York-Newark-Jersey City, NY-NJ-PA | 3,910 | 0.41 | 0.36 | $ 22.45 | $ 46,700 |
| Miami-Fort Lauderdale-West Palm Beach, FL | 3,670 | 1.35 | 1.19 | $ 22.31 | $ 46,410 |
| Gainesville, FL | 3,270 | 23.16 | 20.44 | $ 20.34 | $ 42,310 |
| Atlanta-Sandy Springs-Roswell, GA | 3,000 | 1.06 | 0.94 | $ 21.82 | $ 45,380 |
| San Diego-Carlsbad, CA | 2,970 | 1.95 | 1.72 | $ 27.10 | $ 56,360 |
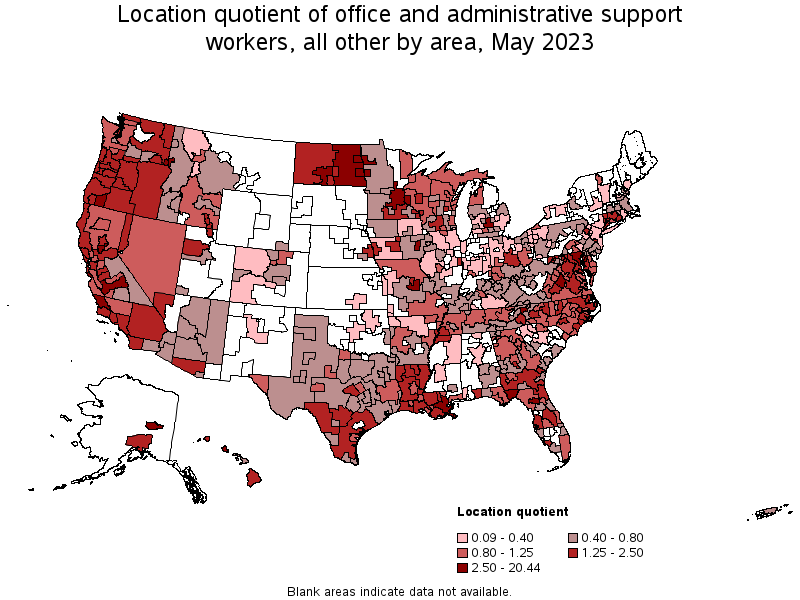
Metropolitan areas with the highest concentration of jobs and location quotients in Office and Administrative Support Workers, All Other:
| Metropolitan area | Employment (1) | Employment per thousand jobs | Location quotient (9) | Hourly mean wage | Annual mean wage (2) |
|---|---|---|---|---|---|
| Gainesville, FL | 3,270 | 23.16 | 20.44 | $ 20.34 | $ 42,310 |
| Jefferson City, MO | 1,040 | 13.86 | 12.23 | $ 18.75 | $ 39,000 |
| Tallahassee, FL | 2,100 | 11.60 | 10.24 | $ 18.64 | $ 38,760 |
| Fairbanks, AK | 390 | 11.04 | 9.74 | $ 17.92 | $ 37,270 |
| Johnson City, TN | 630 | 7.74 | 6.84 | $ 15.70 | $ 32,650 |
| Lewiston, ID-WA | 150 | 5.46 | 4.82 | $ 19.20 | $ 39,940 |
| Iowa City, IA | 490 | 5.45 | 4.81 | $ 25.23 | $ 52,480 |
| Lansing-East Lansing, MI | 1,010 | 4.77 | 4.21 | $ 28.20 | $ 58,660 |
| Santa Cruz-Watsonville, CA | 460 | 4.70 | 4.15 | $ 20.04 | $ 41,680 |
| San Luis Obispo-Paso Robles-Arroyo Grande, CA | 560 | 4.65 | 4.10 | $ 19.93 | $ 41,440 |
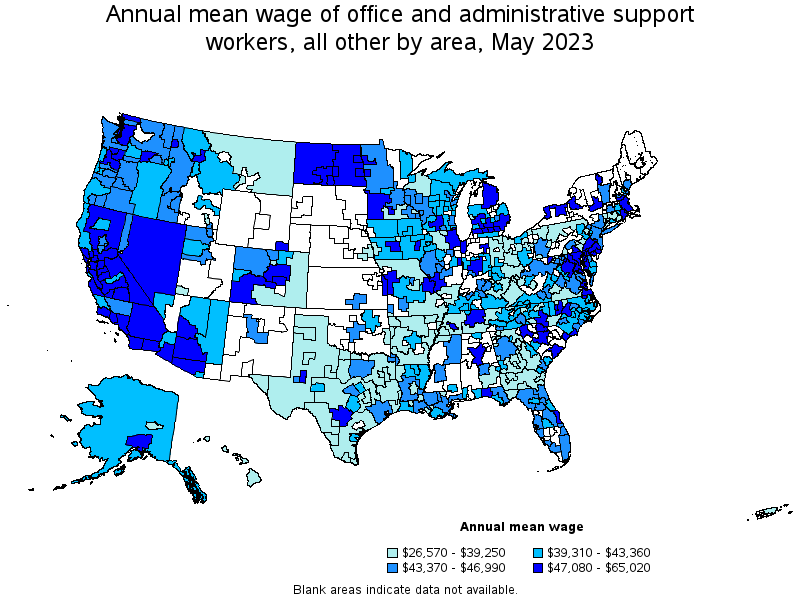
Top paying metropolitan areas for Office and Administrative Support Workers, All Other:
| Metropolitan area | Employment (1) | Employment per thousand jobs | Location quotient (9) | Hourly mean wage | Annual mean wage (2) |
|---|---|---|---|---|---|
| San Jose-Sunnyvale-Santa Clara, CA | 1,460 | 1.28 | 1.13 | $ 31.26 | $ 65,020 |
| San Francisco-Oakland-Hayward, CA | 4,010 | 1.65 | 1.46 | $ 28.73 | $ 59,760 |
| Trenton, NJ | 340 | 1.44 | 1.27 | $ 28.50 | $ 59,280 |
| Napa, CA | 70 | 0.94 | 0.83 | $ 28.47 | $ 59,220 |
| Santa Maria-Santa Barbara, CA | 380 | 1.86 | 1.64 | $ 28.22 | $ 58,700 |
| Lansing-East Lansing, MI | 1,010 | 4.77 | 4.21 | $ 28.20 | $ 58,660 |
| Bismarck, ND | 330 | 4.57 | 4.03 | $ 27.94 | $ 58,120 |
| Burlington-South Burlington, VT | 120 | 1.01 | 0.89 | $ 27.88 | $ 58,000 |
| Vallejo-Fairfield, CA | 170 | 1.24 | 1.09 | $ 27.31 | $ 56,800 |
| Anchorage, AK | 310 | 1.80 | 1.59 | $ 27.14 | $ 56,450 |
Nonmetropolitan areas with the highest employment in Office and Administrative Support Workers, All Other:
| Nonmetropolitan area | Employment (1) | Employment per thousand jobs | Location quotient (9) | Hourly mean wage | Annual mean wage (2) |
|---|---|---|---|---|---|
| Piedmont North Carolina nonmetropolitan area | 340 | 1.34 | 1.18 | $ 18.87 | $ 39,250 |
| Southeast Coastal North Carolina nonmetropolitan area | 330 | 1.35 | 1.19 | $ 19.23 | $ 40,000 |
| South Georgia nonmetropolitan area | 310 | 1.63 | 1.44 | $ 15.04 | $ 31,270 |
| North Coast Region of California nonmetropolitan area | 290 | 2.73 | 2.41 | $ 19.21 | $ 39,970 |
| West North Dakota nonmetropolitan area | 290 | 2.50 | 2.21 | $ 25.85 | $ 53,770 |
Nonmetropolitan areas with the highest concentration of jobs and location quotients in Office and Administrative Support Workers, All Other:
| Nonmetropolitan area | Employment (1) | Employment per thousand jobs | Location quotient (9) | Hourly mean wage | Annual mean wage (2) |
|---|---|---|---|---|---|
| East North Dakota nonmetropolitan area | 230 | 3.77 | 3.33 | $ 26.60 | $ 55,340 |
| North Coast Region of California nonmetropolitan area | 290 | 2.73 | 2.41 | $ 19.21 | $ 39,970 |
| Maryland nonmetropolitan area | 150 | 2.65 | 2.34 | $ 25.26 | $ 52,550 |
| Hawaii / Kauai nonmetropolitan area | 260 | 2.59 | 2.28 | $ 16.57 | $ 34,460 |
| West North Dakota nonmetropolitan area | 290 | 2.50 | 2.21 | $ 25.85 | $ 53,770 |
Top paying nonmetropolitan areas for Office and Administrative Support Workers, All Other:
| Nonmetropolitan area | Employment (1) | Employment per thousand jobs | Location quotient (9) | Hourly mean wage | Annual mean wage (2) |
|---|---|---|---|---|---|
| East North Dakota nonmetropolitan area | 230 | 3.77 | 3.33 | $ 26.60 | $ 55,340 |
| West North Dakota nonmetropolitan area | 290 | 2.50 | 2.21 | $ 25.85 | $ 53,770 |
| Maryland nonmetropolitan area | 150 | 2.65 | 2.34 | $ 25.26 | $ 52,550 |
| Southwest Colorado nonmetropolitan area | 50 | 0.44 | 0.39 | $ 24.62 | $ 51,210 |
| Eastern Sierra-Mother Lode Region of California nonmetropolitan area | 50 | 0.81 | 0.71 | $ 24.44 | $ 50,830 |
These estimates are calculated with data collected from employers in all industry sectors, all metropolitan and nonmetropolitan areas, and all states and the District of Columbia. The top employment and wage figures are provided above. The complete list is available in the downloadable XLS files.
The percentile wage estimate is the value of a wage below which a certain percent of workers fall. The median wage is the 50th percentile wage estimate—50 percent of workers earn less than the median and 50 percent of workers earn more than the median. More about percentile wages.
(1) Estimates for detailed occupations do not sum to the totals because the totals include occupations not shown separately. Estimates do not include self-employed workers.
(2) Annual wages have been calculated by multiplying the hourly mean wage by a "year-round, full-time" hours figure of 2,080 hours; for those occupations where there is not an hourly wage published, the annual wage has been directly calculated from the reported survey data.
(3) The relative standard error (RSE) is a measure of the reliability of a survey statistic. The smaller the relative standard error, the more precise the estimate.
(8) Estimate not released.
(9) The location quotient is the ratio of the area concentration of occupational employment to the national average concentration. A location quotient greater than one indicates the occupation has a higher share of employment than average, and a location quotient less than one indicates the occupation is less prevalent in the area than average.
Other OEWS estimates and related information:
May 2023 National Occupational Employment and Wage Estimates
May 2023 State Occupational Employment and Wage Estimates
May 2023 Metropolitan and Nonmetropolitan Area Occupational Employment and Wage Estimates
May 2023 National Industry-Specific Occupational Employment and Wage Estimates
Last Modified Date: April 3, 2024