
An official website of the United States government
An official website of the United States government
The .gov means it's official.
Federal government websites often end in .gov or .mil. Before sharing sensitive information,
make sure you're on a federal government site.
The site is secure.
The
https:// ensures that you are connecting to the official website and that any
information you provide is encrypted and transmitted securely.
Operate equipment used for applying concrete, asphalt, or other materials to road beds, parking lots, or airport runways and taxiways or for tamping gravel, dirt, or other materials. Includes concrete and asphalt paving machine operators, form tampers, tamping machine operators, and stone spreader operators.
Employment estimate and mean wage estimates for Paving, Surfacing, and Tamping Equipment Operators:
| Employment (1) | Employment RSE (3) |
Mean hourly wage |
Mean annual wage (2) |
Wage RSE (3) |
|---|---|---|---|---|
| 43,080 | 2.9 % | $ 26.53 | $ 55,170 | 0.9 % |
Percentile wage estimates for Paving, Surfacing, and Tamping Equipment Operators:
| Percentile | 10% | 25% | 50% (Median) |
75% | 90% |
|---|---|---|---|---|---|
| Hourly Wage | $ 17.54 | $ 20.00 | $ 23.55 | $ 30.00 | $ 39.29 |
| Annual Wage (2) | $ 36,470 | $ 41,600 | $ 48,980 | $ 62,400 | $ 81,730 |
Industries with the highest published employment and wages for Paving, Surfacing, and Tamping Equipment Operators are provided. For a list of all industries with employment in Paving, Surfacing, and Tamping Equipment Operators, see the Create Customized Tables function.
Industries with the highest levels of employment in Paving, Surfacing, and Tamping Equipment Operators:
| Industry | Employment (1) | Percent of industry employment | Hourly mean wage | Annual mean wage (2) |
|---|---|---|---|---|
| Other Specialty Trade Contractors | 16,270 | 2.09 | $ 25.09 | $ 52,180 |
| Highway, Street, and Bridge Construction | 14,080 | 3.83 | $ 29.07 | $ 60,460 |
| Local Government, excluding Schools and Hospitals (OEWS Designation) | 4,330 | 0.08 | $ 25.05 | $ 52,110 |
| Petroleum and Coal Products Manufacturing | 1,310 | 1.21 | $ 31.59 | $ 65,700 |
| Other Heavy and Civil Engineering Construction | 1,260 | 0.99 | $ 23.16 | $ 48,170 |
Industries with the highest concentration of employment in Paving, Surfacing, and Tamping Equipment Operators:
| Industry | Employment (1) | Percent of industry employment | Hourly mean wage | Annual mean wage (2) |
|---|---|---|---|---|
| Highway, Street, and Bridge Construction | 14,080 | 3.83 | $ 29.07 | $ 60,460 |
| Other Specialty Trade Contractors | 16,270 | 2.09 | $ 25.09 | $ 52,180 |
| Petroleum and Coal Products Manufacturing | 1,310 | 1.21 | $ 31.59 | $ 65,700 |
| Other Heavy and Civil Engineering Construction | 1,260 | 0.99 | $ 23.16 | $ 48,170 |
| Support Activities for Road Transportation | 210 | 0.19 | $ 21.75 | $ 45,230 |
Top paying industries for Paving, Surfacing, and Tamping Equipment Operators:
| Industry | Employment (1) | Percent of industry employment | Hourly mean wage | Annual mean wage (2) |
|---|---|---|---|---|
| Rail Transportation | 90 | 0.05 | $ 34.99 | $ 72,770 |
| Nonresidential Building Construction | 300 | 0.04 | $ 32.99 | $ 68,610 |
| Petroleum and Coal Products Manufacturing | 1,310 | 1.21 | $ 31.59 | $ 65,700 |
| Services to Buildings and Dwellings | 120 | 0.01 | $ 29.71 | $ 61,790 |
| Nonmetallic Mineral Mining and Quarrying | 90 | 0.09 | $ 29.58 | $ 61,520 |
States and areas with the highest published employment, location quotients, and wages for Paving, Surfacing, and Tamping Equipment Operators are provided. For a list of all areas with employment in Paving, Surfacing, and Tamping Equipment Operators, see the Create Customized Tables function.
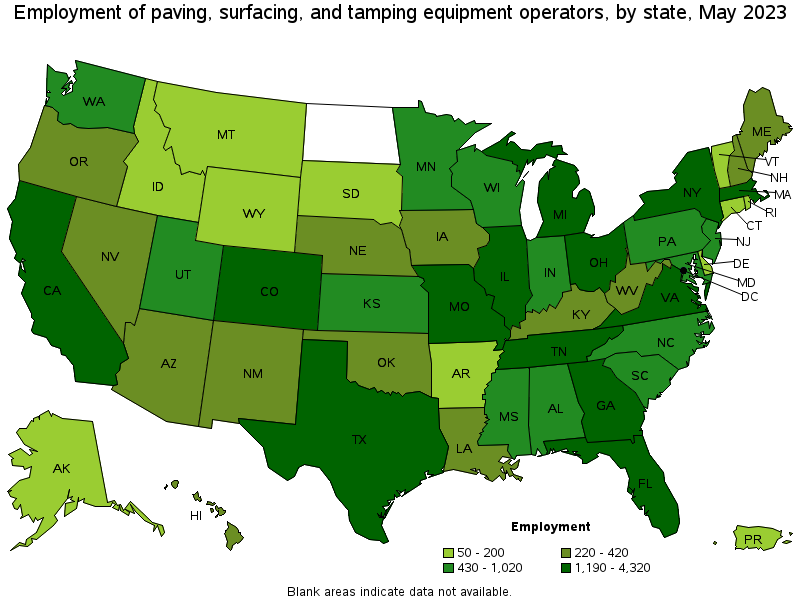
States with the highest employment level in Paving, Surfacing, and Tamping Equipment Operators:
| State | Employment (1) | Employment per thousand jobs | Location quotient (9) | Hourly mean wage | Annual mean wage (2) |
|---|---|---|---|---|---|
| Texas | 4,320 | 0.32 | 1.12 | $ 21.53 | $ 44,770 |
| Florida | 3,240 | 0.34 | 1.20 | $ 21.30 | $ 44,310 |
| New York | 3,200 | 0.34 | 1.20 | $ 29.13 | $ 60,590 |
| Michigan | 2,440 | 0.56 | 1.98 | $ 25.25 | $ 52,520 |
| Ohio | 2,180 | 0.40 | 1.41 | $ 30.58 | $ 63,600 |
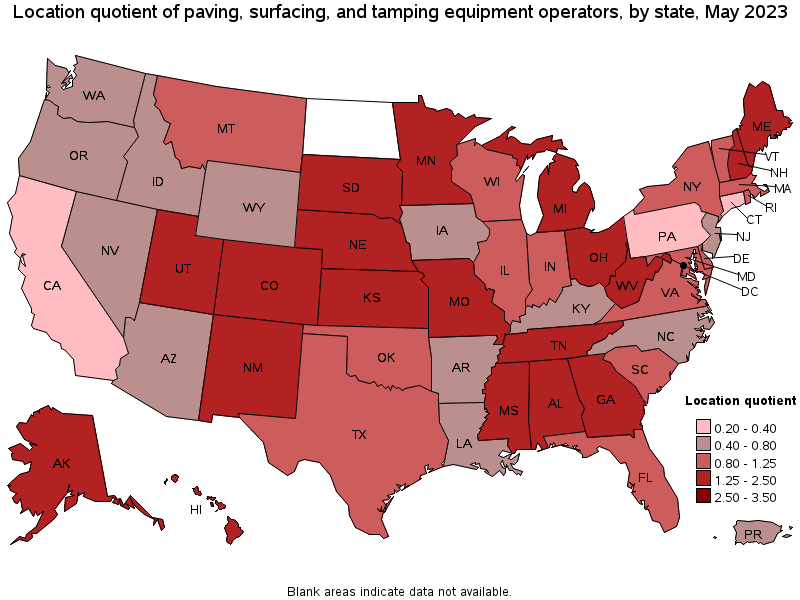
States with the highest concentration of jobs and location quotients in Paving, Surfacing, and Tamping Equipment Operators:
| State | Employment (1) | Employment per thousand jobs | Location quotient (9) | Hourly mean wage | Annual mean wage (2) |
|---|---|---|---|---|---|
| Maine | 410 | 0.66 | 2.31 | $ 26.05 | $ 54,170 |
| Colorado | 1,720 | 0.61 | 2.14 | $ 24.71 | $ 51,400 |
| Michigan | 2,440 | 0.56 | 1.98 | $ 25.25 | $ 52,520 |
| Missouri | 1,580 | 0.55 | 1.93 | $ 28.65 | $ 59,590 |
| New Hampshire | 340 | 0.50 | 1.77 | $ 27.55 | $ 57,300 |
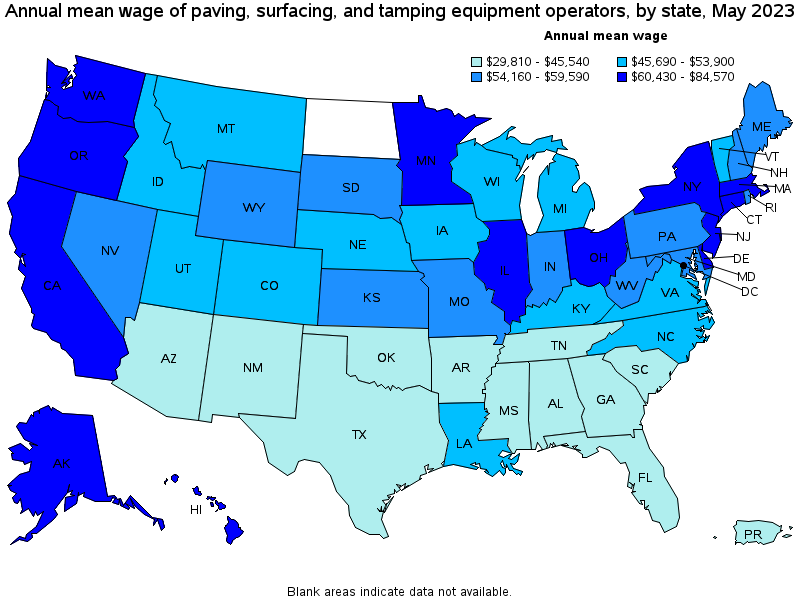
Top paying states for Paving, Surfacing, and Tamping Equipment Operators:
| State | Employment (1) | Employment per thousand jobs | Location quotient (9) | Hourly mean wage | Annual mean wage (2) |
|---|---|---|---|---|---|
| Hawaii | 260 | 0.42 | 1.47 | $ 40.66 | $ 84,570 |
| California | 1,760 | 0.10 | 0.35 | $ 40.54 | $ 84,320 |
| Washington | 580 | 0.17 | 0.58 | $ 36.98 | $ 76,910 |
| Minnesota | 1,020 | 0.35 | 1.25 | $ 35.46 | $ 73,760 |
| Alaska | 110 | 0.37 | 1.29 | $ 34.42 | $ 71,600 |
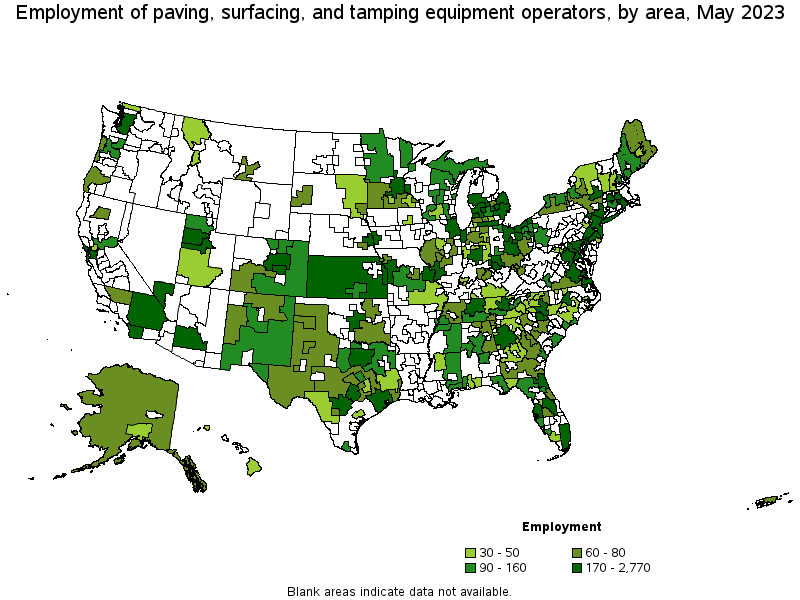
Metropolitan areas with the highest employment level in Paving, Surfacing, and Tamping Equipment Operators:
| Metropolitan area | Employment (1) | Employment per thousand jobs | Location quotient (9) | Hourly mean wage | Annual mean wage (2) |
|---|---|---|---|---|---|
| New York-Newark-Jersey City, NY-NJ-PA | 2,770 | 0.29 | 1.03 | $ 31.09 | $ 64,660 |
| Chicago-Naperville-Elgin, IL-IN-WI | 1,550 | 0.34 | 1.21 | $ 33.79 | $ 70,280 |
| Houston-The Woodlands-Sugar Land, TX | 1,140 | 0.36 | 1.27 | $ 21.33 | $ 44,360 |
| Atlanta-Sandy Springs-Roswell, GA | 1,090 | 0.39 | 1.37 | $ 22.65 | $ 47,100 |
| Detroit-Warren-Dearborn, MI | 960 | 0.51 | 1.79 | $ 25.85 | $ 53,770 |
| Dallas-Fort Worth-Arlington, TX | 870 | 0.22 | 0.77 | $ 23.52 | $ 48,920 |
| Denver-Aurora-Lakewood, CO | 830 | 0.52 | 1.84 | $ 24.77 | $ 51,530 |
| Washington-Arlington-Alexandria, DC-VA-MD-WV | 820 | 0.27 | 0.94 | $ 28.21 | $ 58,670 |
| St. Louis, MO-IL | 720 | 0.55 | 1.92 | $ 30.34 | $ 63,110 |
| Miami-Fort Lauderdale-West Palm Beach, FL | 590 | 0.22 | 0.77 | $ 21.74 | $ 45,210 |
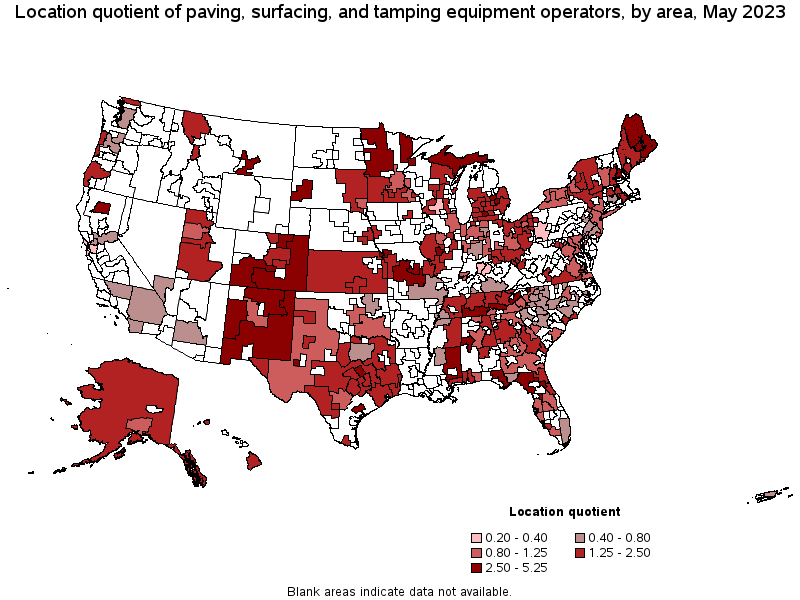
Metropolitan areas with the highest concentration of jobs and location quotients in Paving, Surfacing, and Tamping Equipment Operators:
| Metropolitan area | Employment (1) | Employment per thousand jobs | Location quotient (9) | Hourly mean wage | Annual mean wage (2) |
|---|---|---|---|---|---|
| Battle Creek, MI | 80 | 1.49 | 5.25 | $ 26.52 | $ 55,150 |
| St. Joseph, MO-KS | 80 | 1.44 | 5.08 | $ 33.79 | $ 70,290 |
| Flint, MI | 170 | 1.31 | 4.61 | $ 24.56 | $ 51,090 |
| Greeley, CO | 140 | 1.25 | 4.41 | $ 25.51 | $ 53,060 |
| Jefferson City, MO | 80 | 1.07 | 3.76 | $ 27.57 | $ 57,350 |
| Odessa, TX | 80 | 0.98 | 3.47 | $ 22.55 | $ 46,900 |
| The Villages, FL | 40 | 0.93 | 3.27 | $ 20.71 | $ 43,070 |
| Redding, CA | 60 | 0.91 | 3.20 | $ 46.44 | $ 96,600 |
| Rapid City, SD | 60 | 0.87 | 3.06 | $ 25.40 | $ 52,830 |
| Tuscaloosa, AL | 90 | 0.82 | 2.90 | $ 18.25 | $ 37,960 |
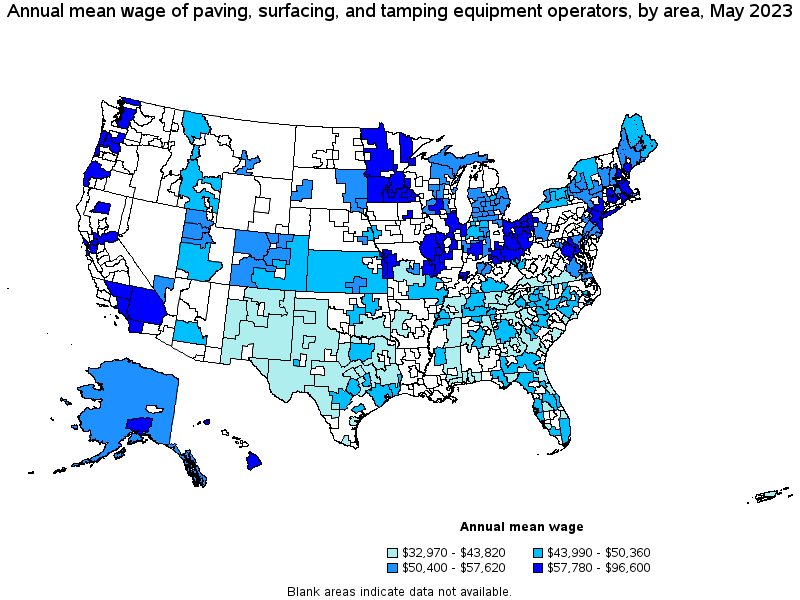
Top paying metropolitan areas for Paving, Surfacing, and Tamping Equipment Operators:
| Metropolitan area | Employment (1) | Employment per thousand jobs | Location quotient (9) | Hourly mean wage | Annual mean wage (2) |
|---|---|---|---|---|---|
| Redding, CA | 60 | 0.91 | 3.20 | $ 46.44 | $ 96,600 |
| Sacramento--Roseville--Arden-Arcade, CA | 150 | 0.14 | 0.50 | $ 43.33 | $ 90,130 |
| San Francisco-Oakland-Hayward, CA | 270 | 0.11 | 0.39 | $ 42.89 | $ 89,210 |
| Anchorage, AK | 50 | 0.27 | 0.97 | $ 42.31 | $ 87,990 |
| Vallejo-Fairfield, CA | 30 | 0.22 | 0.78 | $ 41.67 | $ 86,670 |
| Los Angeles-Long Beach-Anaheim, CA | (8) | (8) | (8) | $ 41.29 | $ 85,880 |
| Champaign-Urbana, IL | 60 | 0.60 | 2.10 | $ 40.76 | $ 84,780 |
| Riverside-San Bernardino-Ontario, CA | 210 | 0.13 | 0.45 | $ 39.18 | $ 81,500 |
| Seattle-Tacoma-Bellevue, WA | 340 | 0.16 | 0.57 | $ 38.57 | $ 80,230 |
| Springfield, IL | 80 | 0.79 | 2.79 | $ 38.18 | $ 79,410 |
Nonmetropolitan areas with the highest employment in Paving, Surfacing, and Tamping Equipment Operators:
| Nonmetropolitan area | Employment (1) | Employment per thousand jobs | Location quotient (9) | Hourly mean wage | Annual mean wage (2) |
|---|---|---|---|---|---|
| Kansas nonmetropolitan area | 180 | 0.45 | 1.59 | $ 22.00 | $ 45,760 |
| North Northeastern Ohio nonmetropolitan area (noncontiguous) | 170 | 0.53 | 1.86 | $ 32.02 | $ 66,600 |
| Balance of Lower Peninsula of Michigan nonmetropolitan area | 170 | 0.65 | 2.28 | $ 24.70 | $ 51,380 |
| Northwest Minnesota nonmetropolitan area | 140 | 0.74 | 2.60 | $ 32.93 | $ 68,500 |
| Northeast Mississippi nonmetropolitan area | 130 | 0.59 | 2.07 | $ 19.81 | $ 41,210 |
Nonmetropolitan areas with the highest concentration of jobs and location quotients in Paving, Surfacing, and Tamping Equipment Operators:
| Nonmetropolitan area | Employment (1) | Employment per thousand jobs | Location quotient (9) | Hourly mean wage | Annual mean wage (2) |
|---|---|---|---|---|---|
| Eastern and Southern Colorado nonmetropolitan area | 90 | 1.36 | 4.78 | $ 21.73 | $ 45,200 |
| Central New Hampshire nonmetropolitan area | 110 | 1.17 | 4.14 | $ 28.93 | $ 60,180 |
| Northern New Mexico nonmetropolitan area | 80 | 1.02 | 3.61 | $ 19.31 | $ 40,160 |
| North Florida nonmetropolitan area | 120 | 1.00 | 3.53 | $ 21.73 | $ 45,190 |
| South Central Tennessee nonmetropolitan area | 110 | 0.98 | 3.47 | $ 21.52 | $ 44,750 |
Top paying nonmetropolitan areas for Paving, Surfacing, and Tamping Equipment Operators:
| Nonmetropolitan area | Employment (1) | Employment per thousand jobs | Location quotient (9) | Hourly mean wage | Annual mean wage (2) |
|---|---|---|---|---|---|
| Hawaii / Kauai nonmetropolitan area | 40 | 0.38 | 1.34 | $ 41.78 | $ 86,910 |
| Southwest Minnesota nonmetropolitan area | 60 | 0.48 | 1.69 | $ 32.95 | $ 68,530 |
| Northwest Minnesota nonmetropolitan area | 140 | 0.74 | 2.60 | $ 32.93 | $ 68,500 |
| North Northeastern Ohio nonmetropolitan area (noncontiguous) | 170 | 0.53 | 1.86 | $ 32.02 | $ 66,600 |
| Southeast Minnesota nonmetropolitan area | 70 | 0.48 | 1.70 | $ 31.94 | $ 66,430 |
These estimates are calculated with data collected from employers in all industry sectors, all metropolitan and nonmetropolitan areas, and all states and the District of Columbia. The top employment and wage figures are provided above. The complete list is available in the downloadable XLS files.
The percentile wage estimate is the value of a wage below which a certain percent of workers fall. The median wage is the 50th percentile wage estimate—50 percent of workers earn less than the median and 50 percent of workers earn more than the median. More about percentile wages.
(1) Estimates for detailed occupations do not sum to the totals because the totals include occupations not shown separately. Estimates do not include self-employed workers.
(2) Annual wages have been calculated by multiplying the hourly mean wage by a "year-round, full-time" hours figure of 2,080 hours; for those occupations where there is not an hourly wage published, the annual wage has been directly calculated from the reported survey data.
(3) The relative standard error (RSE) is a measure of the reliability of a survey statistic. The smaller the relative standard error, the more precise the estimate.
(8) Estimate not released.
(9) The location quotient is the ratio of the area concentration of occupational employment to the national average concentration. A location quotient greater than one indicates the occupation has a higher share of employment than average, and a location quotient less than one indicates the occupation is less prevalent in the area than average.
Other OEWS estimates and related information:
May 2023 National Occupational Employment and Wage Estimates
May 2023 State Occupational Employment and Wage Estimates
May 2023 Metropolitan and Nonmetropolitan Area Occupational Employment and Wage Estimates
May 2023 National Industry-Specific Occupational Employment and Wage Estimates
Last Modified Date: April 3, 2024