
An official website of the United States government
An official website of the United States government
The .gov means it's official.
Federal government websites often end in .gov or .mil. Before sharing sensitive information,
make sure you're on a federal government site.
The site is secure.
The
https:// ensures that you are connecting to the official website and that any
information you provide is encrypted and transmitted securely.
Install, maintain, and repair electrical wiring, equipment, and fixtures. Ensure that work is in accordance with relevant codes. May install or service street lights, intercom systems, or electrical control systems. Excludes �Security and Fire Alarm Systems Installers� (49-2098).
Employment estimate and mean wage estimates for Electricians:
| Employment (1) | Employment RSE (3) |
Mean hourly wage |
Mean annual wage (2) |
Wage RSE (3) |
|---|---|---|---|---|
| 712,580 | 0.6 % | $ 32.60 | $ 67,810 | 0.4 % |
Percentile wage estimates for Electricians:
| Percentile | 10% | 25% | 50% (Median) |
75% | 90% |
|---|---|---|---|---|---|
| Hourly Wage | $ 18.49 | $ 23.13 | $ 29.61 | $ 38.59 | $ 50.09 |
| Annual Wage (2) | $ 38,470 | $ 48,100 | $ 61,590 | $ 80,260 | $ 104,180 |
Industries with the highest published employment and wages for Electricians are provided. For a list of all industries with employment in Electricians, see the Create Customized Tables function.
Industries with the highest levels of employment in Electricians:
| Industry | Employment (1) | Percent of industry employment | Hourly mean wage | Annual mean wage (2) |
|---|---|---|---|---|
| Building Equipment Contractors | 522,600 | 21.46 | $ 32.20 | $ 66,980 |
| Employment Services | 24,590 | 0.66 | $ 27.11 | $ 56,390 |
| Local Government, excluding Schools and Hospitals (OEWS Designation) | 15,280 | 0.28 | $ 38.61 | $ 80,310 |
| Nonresidential Building Construction | 13,140 | 1.53 | $ 33.64 | $ 69,980 |
| Utility System Construction | 11,130 | 1.93 | $ 34.45 | $ 71,660 |
Industries with the highest concentration of employment in Electricians:
| Industry | Employment (1) | Percent of industry employment | Hourly mean wage | Annual mean wage (2) |
|---|---|---|---|---|
| Building Equipment Contractors | 522,600 | 21.46 | $ 32.20 | $ 66,980 |
| Coal Mining | 1,720 | 4.10 | $ 39.05 | $ 81,220 |
| Ship and Boat Building | 4,730 | 3.09 | $ 29.09 | $ 60,500 |
| Iron and Steel Mills and Ferroalloy Manufacturing | 2,390 | 2.85 | $ 28.84 | $ 59,990 |
| Metal Ore Mining | 1,110 | 2.61 | $ 37.99 | $ 79,010 |
Top paying industries for Electricians:
| Industry | Employment (1) | Percent of industry employment | Hourly mean wage | Annual mean wage (2) |
|---|---|---|---|---|
| Natural Gas Distribution | 650 | 0.57 | $ 56.08 | $ 116,650 |
| Independent Artists, Writers, and Performers | (8) | (8) | $ 55.32 | $ 115,070 |
| Communications Equipment Manufacturing | (8) | (8) | $ 48.38 | $ 100,640 |
| Petroleum and Coal Products Manufacturing | 1,250 | 1.15 | $ 48.20 | $ 100,260 |
| Promoters of Performing Arts, Sports, and Similar Events | 630 | 0.39 | $ 48.00 | $ 99,830 |
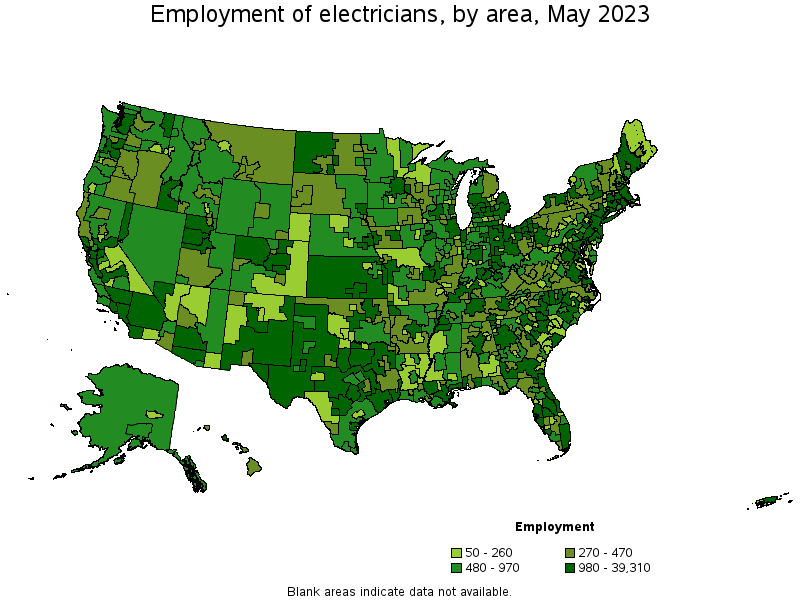
States and areas with the highest published employment, location quotients, and wages for Electricians are provided. For a list of all areas with employment in Electricians, see the Create Customized Tables function.
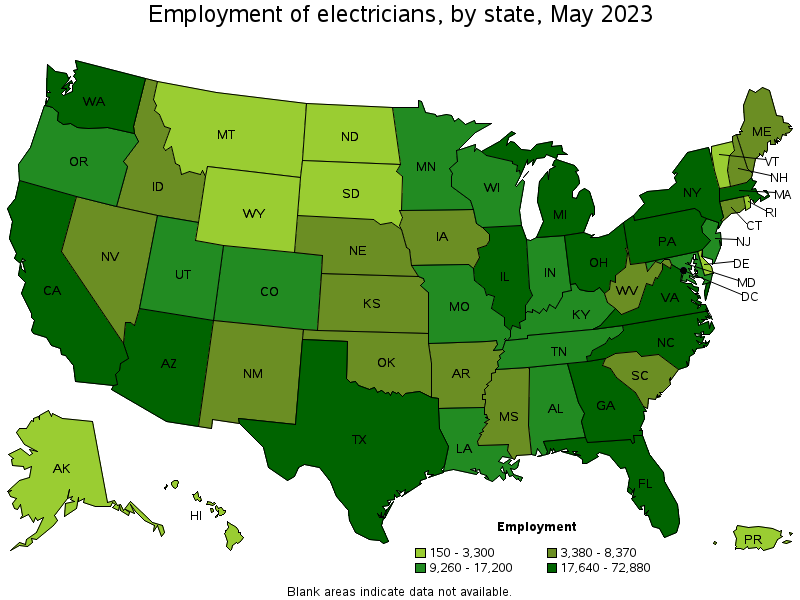
States with the highest employment level in Electricians:
| State | Employment (1) | Employment per thousand jobs | Location quotient (9) | Hourly mean wage | Annual mean wage (2) |
|---|---|---|---|---|---|
| California | 72,880 | 4.06 | 0.87 | $ 40.54 | $ 84,330 |
| Texas | 70,580 | 5.21 | 1.11 | $ 27.09 | $ 56,350 |
| Florida | 46,690 | 4.88 | 1.04 | $ 25.18 | $ 52,380 |
| New York | 40,670 | 4.33 | 0.92 | $ 40.17 | $ 83,550 |
| Ohio | 24,430 | 4.47 | 0.95 | $ 30.94 | $ 64,360 |
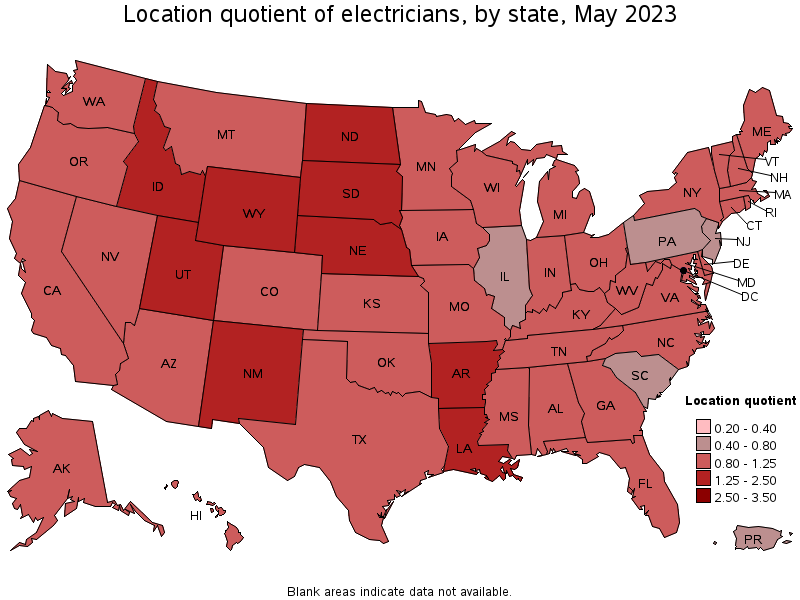
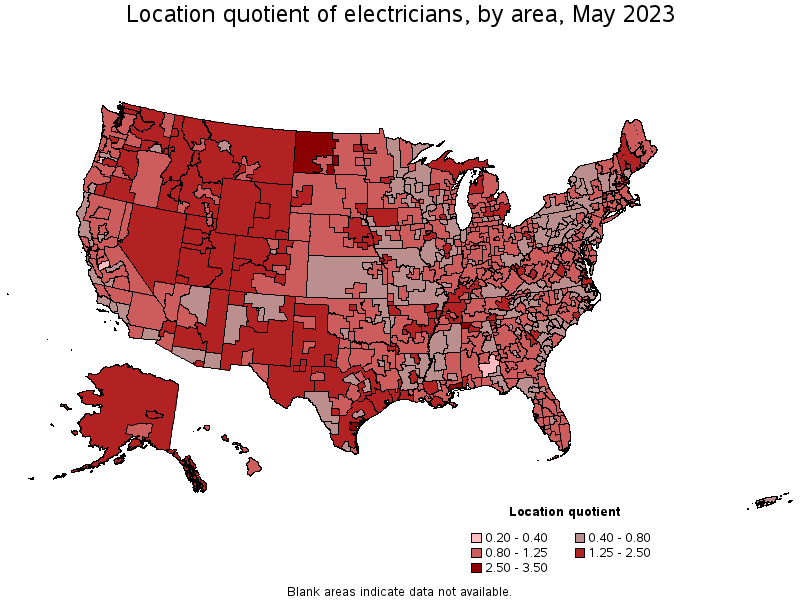
States with the highest concentration of jobs and location quotients in Electricians:
| State | Employment (1) | Employment per thousand jobs | Location quotient (9) | Hourly mean wage | Annual mean wage (2) |
|---|---|---|---|---|---|
| Wyoming | 2,370 | 8.67 | 1.85 | $ 32.69 | $ 68,000 |
| North Dakota | 3,180 | 7.61 | 1.62 | $ 35.02 | $ 72,850 |
| Utah | 11,350 | 6.76 | 1.44 | $ 28.73 | $ 59,760 |
| Nebraska | 6,160 | 6.15 | 1.31 | $ 28.79 | $ 59,890 |
| Idaho | 5,050 | 6.14 | 1.31 | $ 26.56 | $ 55,240 |
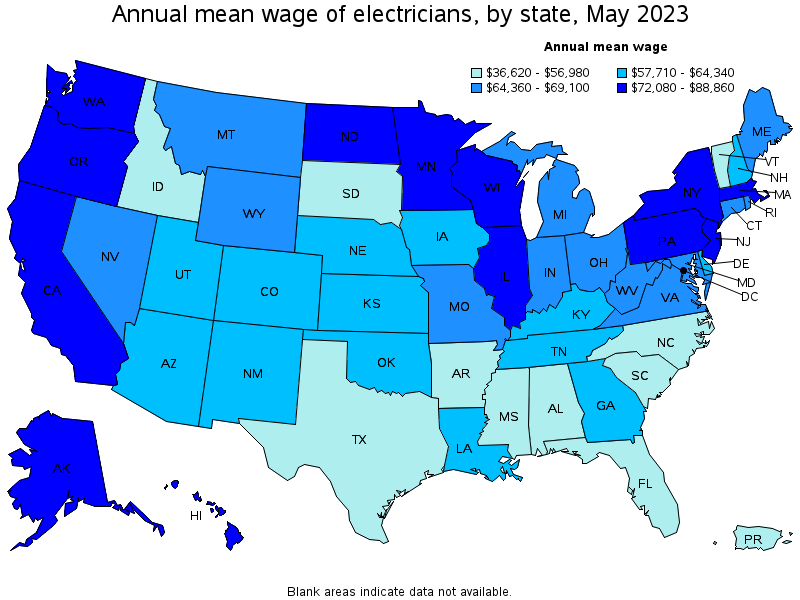
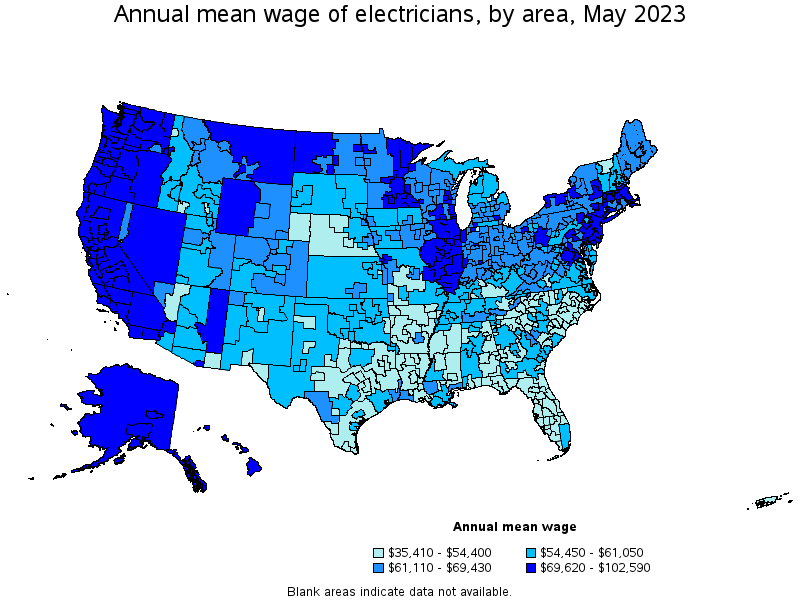
Top paying states for Electricians:
| State | Employment (1) | Employment per thousand jobs | Location quotient (9) | Hourly mean wage | Annual mean wage (2) |
|---|---|---|---|---|---|
| District of Columbia | 1,860 | 2.65 | 0.57 | $ 42.72 | $ 88,860 |
| Washington | 18,820 | 5.38 | 1.15 | $ 42.61 | $ 88,620 |
| Hawaii | 3,300 | 5.35 | 1.14 | $ 42.44 | $ 88,280 |
| Illinois | 21,890 | 3.64 | 0.78 | $ 42.33 | $ 88,040 |
| Oregon | 9,260 | 4.77 | 1.02 | $ 41.03 | $ 85,330 |
Metropolitan areas with the highest employment level in Electricians:
| Metropolitan area | Employment (1) | Employment per thousand jobs | Location quotient (9) | Hourly mean wage | Annual mean wage (2) |
|---|---|---|---|---|---|
| New York-Newark-Jersey City, NY-NJ-PA | 39,310 | 4.14 | 0.88 | $ 41.18 | $ 85,650 |
| Houston-The Woodlands-Sugar Land, TX | 19,600 | 6.16 | 1.31 | $ 28.33 | $ 58,920 |
| Los Angeles-Long Beach-Anaheim, CA | 19,520 | 3.16 | 0.67 | $ 39.95 | $ 83,090 |
| Dallas-Fort Worth-Arlington, TX | 18,730 | 4.72 | 1.01 | $ 27.38 | $ 56,950 |
| Chicago-Naperville-Elgin, IL-IN-WI | 15,860 | 3.52 | 0.75 | $ 44.02 | $ 91,560 |
| Boston-Cambridge-Nashua, MA-NH | 15,010 | 5.43 | 1.16 | $ 39.61 | $ 82,380 |
| Washington-Arlington-Alexandria, DC-VA-MD-WV | 14,850 | 4.80 | 1.02 | $ 36.47 | $ 75,850 |
| Phoenix-Mesa-Scottsdale, AZ | 14,240 | 6.22 | 1.33 | $ 28.58 | $ 59,450 |
| Miami-Fort Lauderdale-West Palm Beach, FL | 12,400 | 4.55 | 0.97 | $ 26.46 | $ 55,030 |
| Atlanta-Sandy Springs-Roswell, GA | 12,160 | 4.32 | 0.92 | $ 28.52 | $ 59,330 |
Metropolitan areas with the highest concentration of jobs and location quotients in Electricians:
| Metropolitan area | Employment (1) | Employment per thousand jobs | Location quotient (9) | Hourly mean wage | Annual mean wage (2) |
|---|---|---|---|---|---|
| Florence-Muscle Shoals, AL | 690 | 12.51 | 2.67 | $ 28.18 | $ 58,600 |
| Kokomo, IN | 430 | 12.41 | 2.64 | $ 38.52 | $ 80,110 |
| Gulfport-Biloxi-Pascagoula, MS | 1,840 | 12.17 | 2.59 | $ 29.55 | $ 61,470 |
| Corpus Christi, TX | 2,260 | 12.05 | 2.57 | $ 26.65 | $ 55,430 |
| Bremerton-Silverdale, WA | 1,080 | 11.66 | 2.48 | $ 33.68 | $ 70,050 |
| Casper, WY | 400 | 10.36 | 2.21 | $ 30.66 | $ 63,770 |
| Decatur, IL | 460 | 9.88 | 2.11 | $ 42.33 | $ 88,050 |
| Mount Vernon-Anacortes, WA | 490 | 9.71 | 2.07 | $ 46.16 | $ 96,000 |
| Beaumont-Port Arthur, TX | 1,480 | 9.52 | 2.03 | $ 29.60 | $ 61,570 |
| Alexandria, LA | 550 | 9.25 | 1.97 | $ 25.91 | $ 53,900 |
Top paying metropolitan areas for Electricians:
| Metropolitan area | Employment (1) | Employment per thousand jobs | Location quotient (9) | Hourly mean wage | Annual mean wage (2) |
|---|---|---|---|---|---|
| San Jose-Sunnyvale-Santa Clara, CA | 5,110 | 4.47 | 0.95 | $ 49.32 | $ 102,590 |
| San Francisco-Oakland-Hayward, CA | 10,500 | 4.34 | 0.92 | $ 49.15 | $ 102,230 |
| Mount Vernon-Anacortes, WA | 490 | 9.71 | 2.07 | $ 46.16 | $ 96,000 |
| Seattle-Tacoma-Bellevue, WA | 9,710 | 4.67 | 1.00 | $ 45.54 | $ 94,730 |
| Kennewick-Richland, WA | 910 | 7.31 | 1.56 | $ 44.05 | $ 91,620 |
| Chicago-Naperville-Elgin, IL-IN-WI | 15,860 | 3.52 | 0.75 | $ 44.02 | $ 91,560 |
| Urban Honolulu, HI | 2,610 | 5.94 | 1.27 | $ 43.21 | $ 89,870 |
| Bellingham, WA | 650 | 7.19 | 1.53 | $ 42.92 | $ 89,280 |
| Portland-Vancouver-Hillsboro, OR-WA | 6,770 | 5.61 | 1.20 | $ 42.88 | $ 89,190 |
| Decatur, IL | 460 | 9.88 | 2.11 | $ 42.33 | $ 88,050 |
Nonmetropolitan areas with the highest employment in Electricians:
| Nonmetropolitan area | Employment (1) | Employment per thousand jobs | Location quotient (9) | Hourly mean wage | Annual mean wage (2) |
|---|---|---|---|---|---|
| North Northeastern Ohio nonmetropolitan area (noncontiguous) | 1,590 | 4.90 | 1.04 | $ 30.97 | $ 64,410 |
| West North Dakota nonmetropolitan area | 1,490 | 13.00 | 2.77 | $ 37.60 | $ 78,200 |
| Balance of Lower Peninsula of Michigan nonmetropolitan area | 1,480 | 5.62 | 1.20 | $ 27.95 | $ 58,140 |
| West Texas Region of Texas nonmetropolitan area | 1,400 | 7.09 | 1.51 | $ 28.55 | $ 59,390 |
| West Northwestern Ohio nonmetropolitan area | 1,370 | 5.50 | 1.17 | $ 32.06 | $ 66,690 |
Nonmetropolitan areas with the highest concentration of jobs and location quotients in Electricians:
| Nonmetropolitan area | Employment (1) | Employment per thousand jobs | Location quotient (9) | Hourly mean wage | Annual mean wage (2) |
|---|---|---|---|---|---|
| West North Dakota nonmetropolitan area | 1,490 | 13.00 | 2.77 | $ 37.60 | $ 78,200 |
| Western Wyoming nonmetropolitan area | 880 | 8.85 | 1.89 | $ 34.44 | $ 71,630 |
| Eastern Wyoming nonmetropolitan area | 730 | 8.74 | 1.86 | $ 32.59 | $ 67,790 |
| Upper Peninsula of Michigan nonmetropolitan area | 950 | 8.67 | 1.85 | $ 29.02 | $ 60,370 |
| Eastern Utah nonmetropolitan area | 740 | 8.36 | 1.78 | $ 30.74 | $ 63,950 |
Top paying nonmetropolitan areas for Electricians:
| Nonmetropolitan area | Employment (1) | Employment per thousand jobs | Location quotient (9) | Hourly mean wage | Annual mean wage (2) |
|---|---|---|---|---|---|
| South Illinois nonmetropolitan area | 350 | 4.05 | 0.86 | $ 40.96 | $ 85,200 |
| Eastern Washington nonmetropolitan area | 640 | 6.15 | 1.31 | $ 40.84 | $ 84,950 |
| Alaska nonmetropolitan area | 630 | 6.08 | 1.29 | $ 40.10 | $ 83,420 |
| Central Oregon nonmetropolitan area | 410 | 6.47 | 1.38 | $ 39.22 | $ 81,570 |
| Hawaii / Kauai nonmetropolitan area | 400 | 3.98 | 0.85 | $ 38.79 | $ 80,680 |
These estimates are calculated with data collected from employers in all industry sectors, all metropolitan and nonmetropolitan areas, and all states and the District of Columbia. The top employment and wage figures are provided above. The complete list is available in the downloadable XLS files.
The percentile wage estimate is the value of a wage below which a certain percent of workers fall. The median wage is the 50th percentile wage estimate—50 percent of workers earn less than the median and 50 percent of workers earn more than the median. More about percentile wages.
(1) Estimates for detailed occupations do not sum to the totals because the totals include occupations not shown separately. Estimates do not include self-employed workers.
(2) Annual wages have been calculated by multiplying the hourly mean wage by a "year-round, full-time" hours figure of 2,080 hours; for those occupations where there is not an hourly wage published, the annual wage has been directly calculated from the reported survey data.
(3) The relative standard error (RSE) is a measure of the reliability of a survey statistic. The smaller the relative standard error, the more precise the estimate.
(8) Estimate not released.
(9) The location quotient is the ratio of the area concentration of occupational employment to the national average concentration. A location quotient greater than one indicates the occupation has a higher share of employment than average, and a location quotient less than one indicates the occupation is less prevalent in the area than average.
Other OEWS estimates and related information:
May 2023 National Occupational Employment and Wage Estimates
May 2023 State Occupational Employment and Wage Estimates
May 2023 Metropolitan and Nonmetropolitan Area Occupational Employment and Wage Estimates
May 2023 National Industry-Specific Occupational Employment and Wage Estimates
Last Modified Date: April 3, 2024