
An official website of the United States government
An official website of the United States government
The .gov means it's official.
Federal government websites often end in .gov or .mil. Before sharing sensitive information,
make sure you're on a federal government site.
The site is secure.
The
https:// ensures that you are connecting to the official website and that any
information you provide is encrypted and transmitted securely.
Cover roofs of structures with shingles, slate, asphalt, aluminum, wood, or related materials. May spray roofs, sidings, and walls with material to bind, seal, insulate, or soundproof sections of structures.
Employment estimate and mean wage estimates for Roofers:
| Employment (1) | Employment RSE (3) |
Mean hourly wage |
Mean annual wage (2) |
Wage RSE (3) |
|---|---|---|---|---|
| 135,140 | 1.2 % | $ 26.85 | $ 55,840 | 0.7 % |
Percentile wage estimates for Roofers:
| Percentile | 10% | 25% | 50% (Median) |
75% | 90% |
|---|---|---|---|---|---|
| Hourly Wage | $ 17.42 | $ 21.23 | $ 24.05 | $ 29.97 | $ 38.39 |
| Annual Wage (2) | $ 36,240 | $ 44,150 | $ 50,030 | $ 62,330 | $ 79,850 |
Industries with the highest published employment and wages for Roofers are provided. For a list of all industries with employment in Roofers, see the Create Customized Tables function.
Industries with the highest levels of employment in Roofers:
| Industry | Employment (1) | Percent of industry employment | Hourly mean wage | Annual mean wage (2) |
|---|---|---|---|---|
| Foundation, Structure, and Building Exterior Contractors | 123,840 | 12.65 | $ 26.72 | $ 55,580 |
| Residential Building Construction | 3,400 | 0.37 | $ 28.10 | $ 58,460 |
| Nonresidential Building Construction | 1,910 | 0.22 | $ 31.09 | $ 64,670 |
| Building Equipment Contractors | 1,380 | 0.06 | $ 27.98 | $ 58,190 |
| Building Finishing Contractors | 1,190 | 0.14 | $ 32.01 | $ 66,580 |
Industries with the highest concentration of employment in Roofers:
| Industry | Employment (1) | Percent of industry employment | Hourly mean wage | Annual mean wage (2) |
|---|---|---|---|---|
| Foundation, Structure, and Building Exterior Contractors | 123,840 | 12.65 | $ 26.72 | $ 55,580 |
| Residential Building Construction | 3,400 | 0.37 | $ 28.10 | $ 58,460 |
| Other Wood Product Manufacturing | 870 | 0.35 | $ 21.58 | $ 44,880 |
| Nonresidential Building Construction | 1,910 | 0.22 | $ 31.09 | $ 64,670 |
| Building Finishing Contractors | 1,190 | 0.14 | $ 32.01 | $ 66,580 |
Top paying industries for Roofers:
| Industry | Employment (1) | Percent of industry employment | Hourly mean wage | Annual mean wage (2) |
|---|---|---|---|---|
| Local Government, excluding Schools and Hospitals (OEWS Designation) | 120 | (7) | $ 34.46 | $ 71,680 |
| Federal, State, and Local Government, excluding State and Local Government Schools and Hospitals and the U.S. Postal Service (OEWS Designation) | 40 | (7) | $ 33.45 | $ 69,580 |
| Building Finishing Contractors | 1,190 | 0.14 | $ 32.01 | $ 66,580 |
| Nonresidential Building Construction | 1,910 | 0.22 | $ 31.09 | $ 64,670 |
| Real Estate | 130 | 0.01 | $ 30.05 | $ 62,500 |
States and areas with the highest published employment, location quotients, and wages for Roofers are provided. For a list of all areas with employment in Roofers, see the Create Customized Tables function.
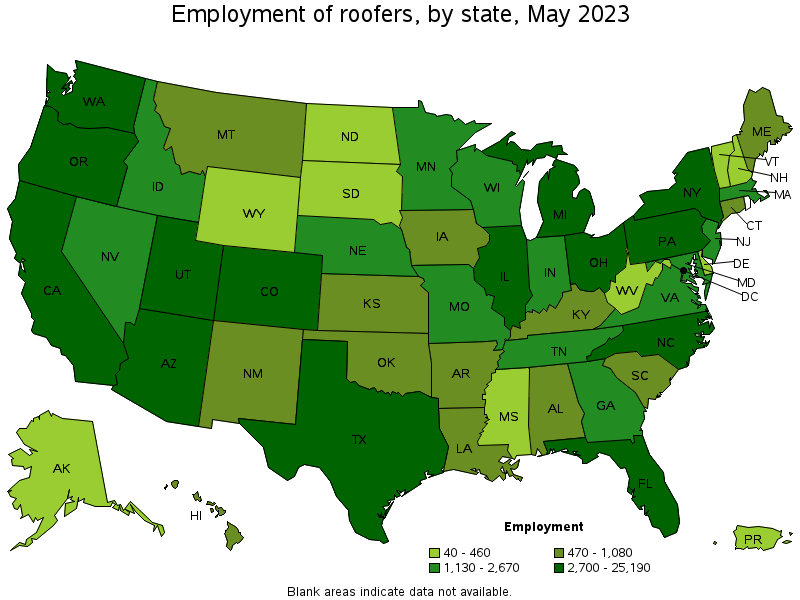
States with the highest employment level in Roofers:
| State | Employment (1) | Employment per thousand jobs | Location quotient (9) | Hourly mean wage | Annual mean wage (2) |
|---|---|---|---|---|---|
| Florida | 25,190 | 2.63 | 2.96 | $ 22.61 | $ 47,030 |
| California | 18,920 | 1.05 | 1.18 | $ 33.17 | $ 69,000 |
| Illinois | 6,240 | 1.04 | 1.17 | $ 33.71 | $ 70,110 |
| Texas | 5,990 | 0.44 | 0.50 | $ 21.39 | $ 44,480 |
| Washington | 5,560 | 1.59 | 1.79 | $ 32.27 | $ 67,110 |
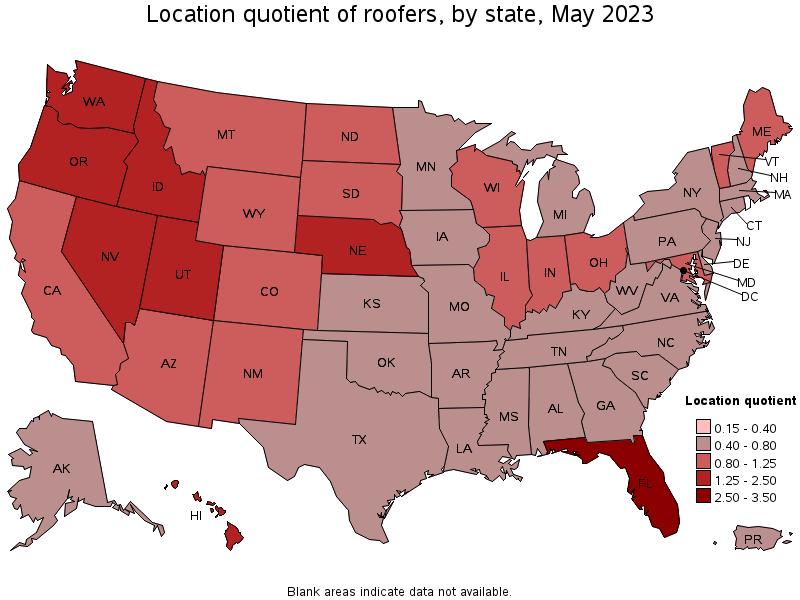
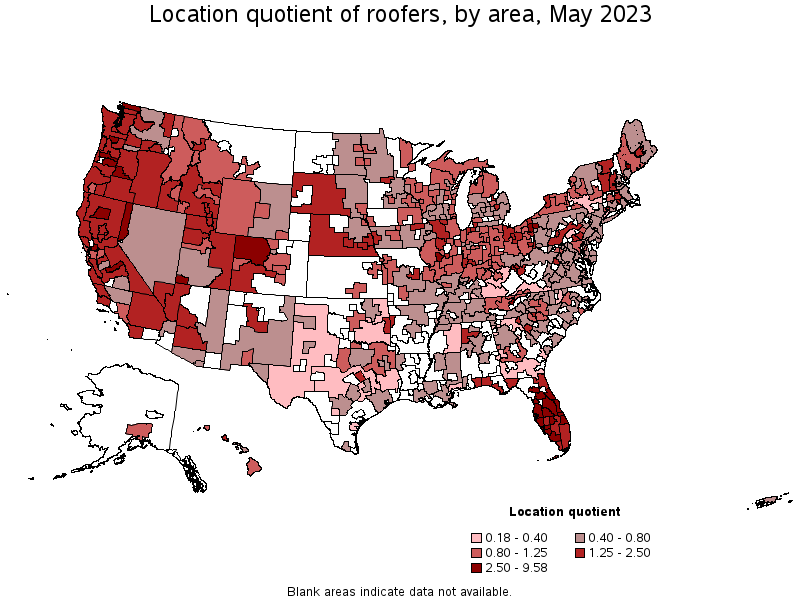
States with the highest concentration of jobs and location quotients in Roofers:
| State | Employment (1) | Employment per thousand jobs | Location quotient (9) | Hourly mean wage | Annual mean wage (2) |
|---|---|---|---|---|---|
| Florida | 25,190 | 2.63 | 2.96 | $ 22.61 | $ 47,030 |
| Oregon | 3,690 | 1.90 | 2.13 | $ 26.11 | $ 54,300 |
| Utah | 2,700 | 1.61 | 1.81 | $ 25.58 | $ 53,210 |
| Washington | 5,560 | 1.59 | 1.79 | $ 32.27 | $ 67,110 |
| Nebraska | 1,470 | 1.47 | 1.65 | $ 21.64 | $ 45,010 |
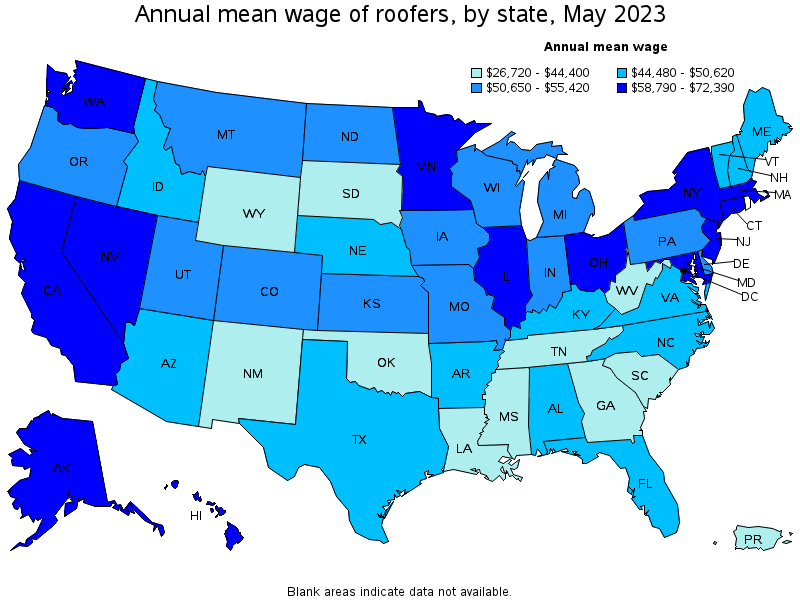
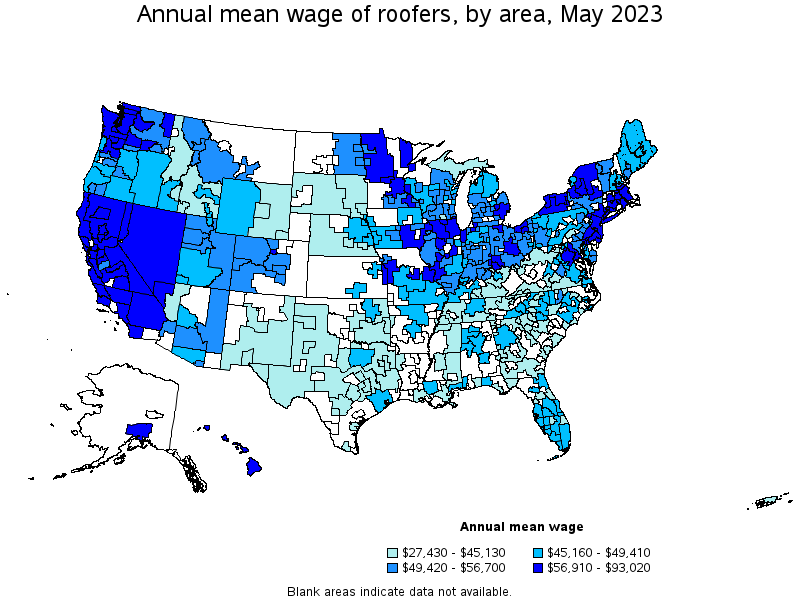
Top paying states for Roofers:
| State | Employment (1) | Employment per thousand jobs | Location quotient (9) | Hourly mean wage | Annual mean wage (2) |
|---|---|---|---|---|---|
| Massachusetts | 2,450 | 0.67 | 0.76 | $ 34.80 | $ 72,390 |
| Illinois | 6,240 | 1.04 | 1.17 | $ 33.71 | $ 70,110 |
| Connecticut | 820 | 0.49 | 0.55 | $ 33.26 | $ 69,170 |
| California | 18,920 | 1.05 | 1.18 | $ 33.17 | $ 69,000 |
| Alaska | 180 | 0.59 | 0.66 | $ 32.64 | $ 67,880 |
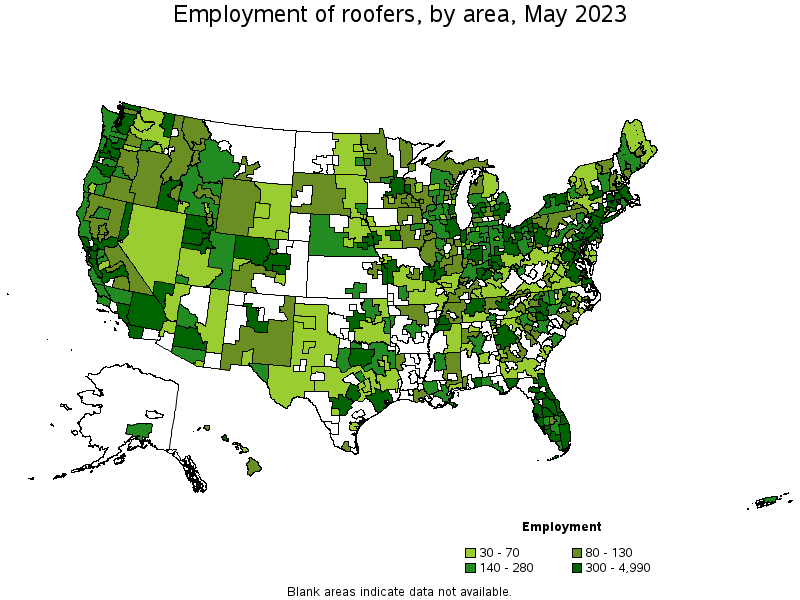
Metropolitan areas with the highest employment level in Roofers:
| Metropolitan area | Employment (1) | Employment per thousand jobs | Location quotient (9) | Hourly mean wage | Annual mean wage (2) |
|---|---|---|---|---|---|
| Miami-Fort Lauderdale-West Palm Beach, FL | 4,990 | 1.84 | 2.06 | $ 23.45 | $ 48,770 |
| Los Angeles-Long Beach-Anaheim, CA | 4,680 | 0.76 | 0.85 | $ 33.29 | $ 69,230 |
| Chicago-Naperville-Elgin, IL-IN-WI | 4,510 | 1.00 | 1.13 | $ 35.23 | $ 73,280 |
| New York-Newark-Jersey City, NY-NJ-PA | 3,690 | 0.39 | 0.44 | $ 34.18 | $ 71,090 |
| Orlando-Kissimmee-Sanford, FL | 3,590 | 2.63 | 2.95 | $ 22.52 | $ 46,850 |
| Tampa-St. Petersburg-Clearwater, FL | 3,340 | 2.36 | 2.66 | $ 22.81 | $ 47,440 |
| Seattle-Tacoma-Bellevue, WA | 2,930 | 1.41 | 1.58 | $ 34.49 | $ 71,740 |
| Phoenix-Mesa-Scottsdale, AZ | 2,610 | 1.14 | 1.28 | $ 24.22 | $ 50,380 |
| Cape Coral-Fort Myers, FL | 2,480 | 8.52 | 9.58 | $ 22.52 | $ 46,830 |
| Dallas-Fort Worth-Arlington, TX | 2,320 | 0.58 | 0.66 | $ 22.51 | $ 46,820 |
Metropolitan areas with the highest concentration of jobs and location quotients in Roofers:
| Metropolitan area | Employment (1) | Employment per thousand jobs | Location quotient (9) | Hourly mean wage | Annual mean wage (2) |
|---|---|---|---|---|---|
| Cape Coral-Fort Myers, FL | 2,480 | 8.52 | 9.58 | $ 22.52 | $ 46,830 |
| Sebastian-Vero Beach, FL | 400 | 7.29 | 8.19 | $ 22.70 | $ 47,220 |
| Punta Gorda, FL | 380 | 7.22 | 8.11 | $ 23.59 | $ 49,060 |
| North Port-Sarasota-Bradenton, FL | 1,970 | 6.09 | 6.84 | $ 22.63 | $ 47,060 |
| Port St. Lucie, FL | 860 | 5.24 | 5.89 | $ 21.65 | $ 45,030 |
| Vallejo-Fairfield, CA | 700 | 5.12 | 5.75 | $ 33.42 | $ 69,520 |
| Naples-Immokalee-Marco Island, FL | 770 | 4.71 | 5.30 | $ 23.74 | $ 49,380 |
| Sebring, FL | 120 | 4.22 | 4.74 | $ 19.38 | $ 40,320 |
| Homosassa Springs, FL | 140 | 4.04 | 4.54 | $ 20.20 | $ 42,020 |
| Longview, WA | 160 | 3.94 | 4.43 | $ 28.55 | $ 59,380 |
Top paying metropolitan areas for Roofers:
| Metropolitan area | Employment (1) | Employment per thousand jobs | Location quotient (9) | Hourly mean wage | Annual mean wage (2) |
|---|---|---|---|---|---|
| Worcester, MA-CT | 370 | 1.31 | 1.47 | $ 44.72 | $ 93,020 |
| Danbury, CT | 70 | 0.89 | 1.00 | $ 39.38 | $ 81,900 |
| San Jose-Sunnyvale-Santa Clara, CA | 1,390 | 1.22 | 1.37 | $ 38.72 | $ 80,540 |
| Springfield, MA-CT | 340 | 1.06 | 1.19 | $ 36.94 | $ 76,830 |
| San Francisco-Oakland-Hayward, CA | 2,200 | 0.91 | 1.02 | $ 36.67 | $ 76,280 |
| New Haven, CT | 180 | 0.60 | 0.68 | $ 36.55 | $ 76,030 |
| Chicago-Naperville-Elgin, IL-IN-WI | 4,510 | 1.00 | 1.13 | $ 35.23 | $ 73,280 |
| Seattle-Tacoma-Bellevue, WA | 2,930 | 1.41 | 1.58 | $ 34.49 | $ 71,740 |
| New York-Newark-Jersey City, NY-NJ-PA | 3,690 | 0.39 | 0.44 | $ 34.18 | $ 71,090 |
| Minneapolis-St. Paul-Bloomington, MN-WI | 1,310 | 0.69 | 0.77 | $ 33.86 | $ 70,420 |
Nonmetropolitan areas with the highest employment in Roofers:
| Nonmetropolitan area | Employment (1) | Employment per thousand jobs | Location quotient (9) | Hourly mean wage | Annual mean wage (2) |
|---|---|---|---|---|---|
| North Northeastern Ohio nonmetropolitan area (noncontiguous) | 460 | 1.42 | 1.60 | $ 25.60 | $ 53,240 |
| Northwest Colorado nonmetropolitan area | 360 | 2.85 | 3.20 | $ 25.30 | $ 52,610 |
| Western Washington nonmetropolitan area | 260 | 2.01 | 2.26 | $ 29.30 | $ 60,930 |
| North Texas Region of Texas nonmetropolitan area | 240 | 0.87 | 0.98 | $ 21.23 | $ 44,150 |
| Northwest Illinois nonmetropolitan area | 230 | 1.79 | 2.02 | $ 31.63 | $ 65,800 |
Nonmetropolitan areas with the highest concentration of jobs and location quotients in Roofers:
| Nonmetropolitan area | Employment (1) | Employment per thousand jobs | Location quotient (9) | Hourly mean wage | Annual mean wage (2) |
|---|---|---|---|---|---|
| Northwest Colorado nonmetropolitan area | 360 | 2.85 | 3.20 | $ 25.30 | $ 52,610 |
| North Coast Region of California nonmetropolitan area | 220 | 2.09 | 2.35 | $ 29.17 | $ 60,680 |
| Eastern Utah nonmetropolitan area | 180 | 2.06 | 2.32 | $ 24.31 | $ 50,570 |
| Western Washington nonmetropolitan area | 260 | 2.01 | 2.26 | $ 29.30 | $ 60,930 |
| South Florida nonmetropolitan area | 160 | 1.90 | 2.14 | $ 23.18 | $ 48,210 |
Top paying nonmetropolitan areas for Roofers:
| Nonmetropolitan area | Employment (1) | Employment per thousand jobs | Location quotient (9) | Hourly mean wage | Annual mean wage (2) |
|---|---|---|---|---|---|
| Capital/Northern New York nonmetropolitan area | 70 | 0.48 | 0.54 | $ 32.14 | $ 66,840 |
| Northwest Illinois nonmetropolitan area | 230 | 1.79 | 2.02 | $ 31.63 | $ 65,800 |
| Southwest New York nonmetropolitan area | 150 | 0.86 | 0.97 | $ 30.57 | $ 63,590 |
| Eastern Sierra-Mother Lode Region of California nonmetropolitan area | 100 | 1.69 | 1.90 | $ 30.41 | $ 63,250 |
| North Valley-Northern Mountains Region of California nonmetropolitan area | 130 | 1.24 | 1.39 | $ 30.06 | $ 62,520 |
These estimates are calculated with data collected from employers in all industry sectors, all metropolitan and nonmetropolitan areas, and all states and the District of Columbia. The top employment and wage figures are provided above. The complete list is available in the downloadable XLS files.
The percentile wage estimate is the value of a wage below which a certain percent of workers fall. The median wage is the 50th percentile wage estimate—50 percent of workers earn less than the median and 50 percent of workers earn more than the median. More about percentile wages.
(1) Estimates for detailed occupations do not sum to the totals because the totals include occupations not shown separately. Estimates do not include self-employed workers.
(2) Annual wages have been calculated by multiplying the hourly mean wage by a "year-round, full-time" hours figure of 2,080 hours; for those occupations where there is not an hourly wage published, the annual wage has been directly calculated from the reported survey data.
(3) The relative standard error (RSE) is a measure of the reliability of a survey statistic. The smaller the relative standard error, the more precise the estimate.
(7) The value is less than .005 percent of industry employment.
(9) The location quotient is the ratio of the area concentration of occupational employment to the national average concentration. A location quotient greater than one indicates the occupation has a higher share of employment than average, and a location quotient less than one indicates the occupation is less prevalent in the area than average.
Other OEWS estimates and related information:
May 2023 National Occupational Employment and Wage Estimates
May 2023 State Occupational Employment and Wage Estimates
May 2023 Metropolitan and Nonmetropolitan Area Occupational Employment and Wage Estimates
May 2023 National Industry-Specific Occupational Employment and Wage Estimates
Last Modified Date: April 3, 2024