
An official website of the United States government
An official website of the United States government
The .gov means it's official.
Federal government websites often end in .gov or .mil. Before sharing sensitive information,
make sure you're on a federal government site.
The site is secure.
The
https:// ensures that you are connecting to the official website and that any
information you provide is encrypted and transmitted securely.
Operate or tend machines to prepare industrial or consumer products for storage or shipment. Includes cannery workers who pack food products.
Employment estimate and mean wage estimates for Packaging and Filling Machine Operators and Tenders:
| Employment (1) | Employment RSE (3) |
Mean hourly wage |
Mean annual wage (2) |
Wage RSE (3) |
|---|---|---|---|---|
| 371,600 | 0.8 % | $ 19.81 | $ 41,200 | 0.3 % |
Percentile wage estimates for Packaging and Filling Machine Operators and Tenders:
| Percentile | 10% | 25% | 50% (Median) |
75% | 90% |
|---|---|---|---|---|---|
| Hourly Wage | $ 14.45 | $ 16.56 | $ 18.43 | $ 22.38 | $ 26.96 |
| Annual Wage (2) | $ 30,050 | $ 34,440 | $ 38,330 | $ 46,540 | $ 56,070 |
Industries with the highest published employment and wages for Packaging and Filling Machine Operators and Tenders are provided. For a list of all industries with employment in Packaging and Filling Machine Operators and Tenders, see the Create Customized Tables function.
Industries with the highest levels of employment in Packaging and Filling Machine Operators and Tenders:
| Industry | Employment (1) | Percent of industry employment | Hourly mean wage | Annual mean wage (2) |
|---|---|---|---|---|
| Animal Slaughtering and Processing | 32,370 | 5.96 | $ 18.73 | $ 38,960 |
| Other Food Manufacturing | 31,640 | 12.19 | $ 19.93 | $ 41,460 |
| Employment Services | 31,000 | 0.83 | $ 16.40 | $ 34,110 |
| Pharmaceutical and Medicine Manufacturing | 30,600 | 8.95 | $ 20.75 | $ 43,160 |
| Fruit and Vegetable Preserving and Specialty Food Manufacturing | 26,210 | 15.34 | $ 18.99 | $ 39,490 |
Industries with the highest concentration of employment in Packaging and Filling Machine Operators and Tenders:
| Industry | Employment (1) | Percent of industry employment | Hourly mean wage | Annual mean wage (2) |
|---|---|---|---|---|
| Fruit and Vegetable Preserving and Specialty Food Manufacturing | 26,210 | 15.34 | $ 18.99 | $ 39,490 |
| Dairy Product Manufacturing | 22,270 | 13.72 | $ 21.95 | $ 45,660 |
| Grain and Oilseed Milling | 7,960 | 12.25 | $ 23.45 | $ 48,780 |
| Other Food Manufacturing | 31,640 | 12.19 | $ 19.93 | $ 41,460 |
| Tobacco Manufacturing | 1,300 | 11.56 | $ 22.13 | $ 46,040 |
Top paying industries for Packaging and Filling Machine Operators and Tenders:
| Industry | Employment (1) | Percent of industry employment | Hourly mean wage | Annual mean wage (2) |
|---|---|---|---|---|
| Aerospace Product and Parts Manufacturing | 100 | 0.02 | $ 33.60 | $ 69,900 |
| Pulp, Paper, and Paperboard Mills | 720 | 0.82 | $ 27.37 | $ 56,930 |
| Scientific Research and Development Services | 500 | 0.05 | $ 25.84 | $ 53,740 |
| Petroleum and Coal Products Manufacturing | 1,460 | 1.35 | $ 24.09 | $ 50,110 |
| Nonmetallic Mineral Mining and Quarrying | 640 | 0.65 | $ 23.58 | $ 49,050 |
States and areas with the highest published employment, location quotients, and wages for Packaging and Filling Machine Operators and Tenders are provided. For a list of all areas with employment in Packaging and Filling Machine Operators and Tenders, see the Create Customized Tables function.
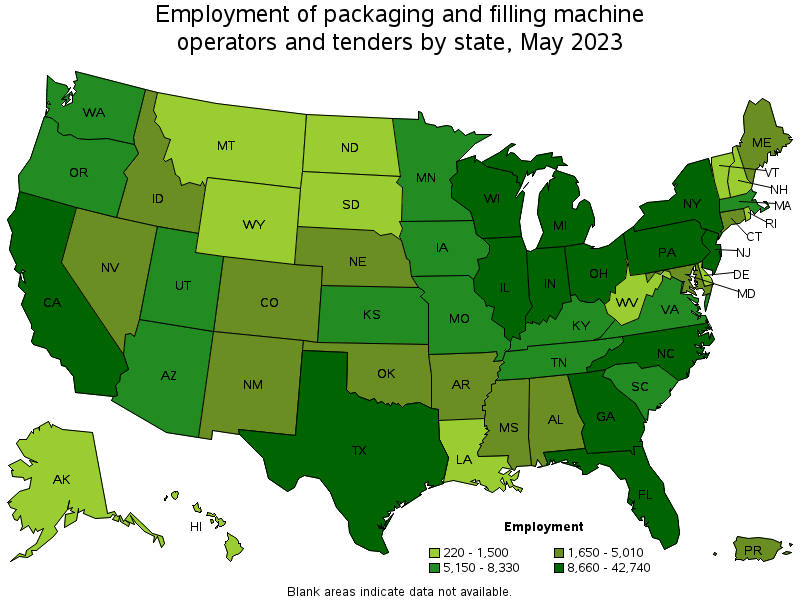
States with the highest employment level in Packaging and Filling Machine Operators and Tenders:
| State | Employment (1) | Employment per thousand jobs | Location quotient (9) | Hourly mean wage | Annual mean wage (2) |
|---|---|---|---|---|---|
| California | 42,740 | 2.38 | 0.97 | $ 20.64 | $ 42,920 |
| Illinois | 25,570 | 4.25 | 1.74 | $ 20.78 | $ 43,210 |
| Pennsylvania | 21,790 | 3.66 | 1.50 | $ 20.99 | $ 43,670 |
| Texas | 21,310 | 1.57 | 0.64 | $ 17.57 | $ 36,550 |
| Wisconsin | 18,490 | 6.41 | 2.62 | $ 19.86 | $ 41,320 |
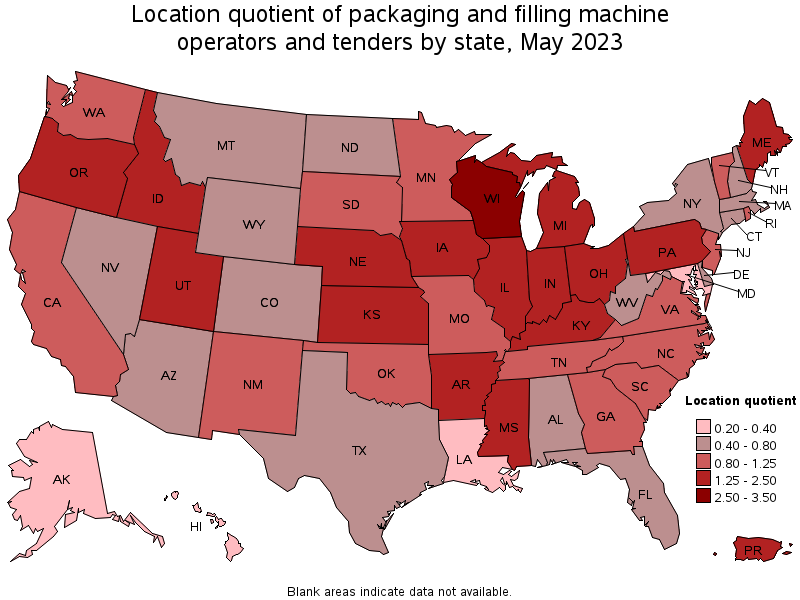
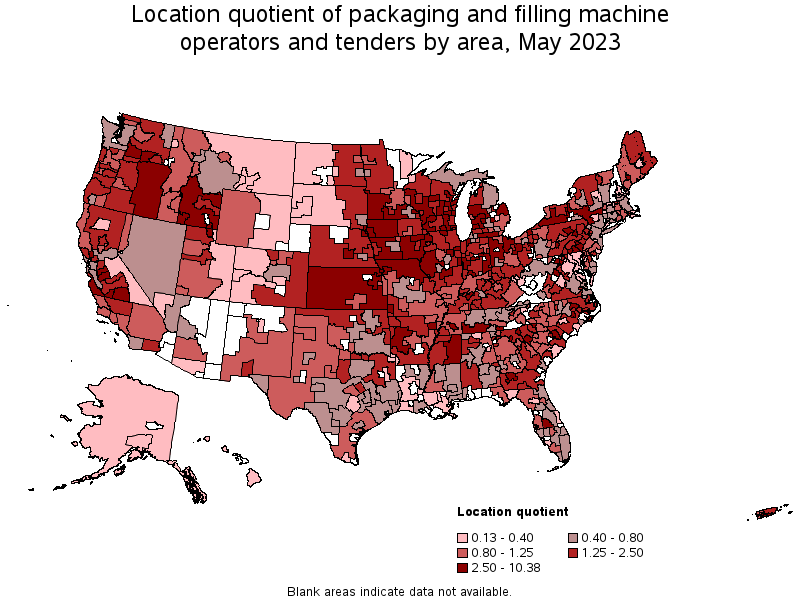
States with the highest concentration of jobs and location quotients in Packaging and Filling Machine Operators and Tenders:
| State | Employment (1) | Employment per thousand jobs | Location quotient (9) | Hourly mean wage | Annual mean wage (2) |
|---|---|---|---|---|---|
| Wisconsin | 18,490 | 6.41 | 2.62 | $ 19.86 | $ 41,320 |
| Kansas | 7,800 | 5.52 | 2.26 | $ 19.04 | $ 39,600 |
| Iowa | 8,070 | 5.22 | 2.13 | $ 20.85 | $ 43,380 |
| Illinois | 25,570 | 4.25 | 1.74 | $ 20.78 | $ 43,210 |
| Arkansas | 5,010 | 3.94 | 1.61 | $ 18.48 | $ 38,440 |
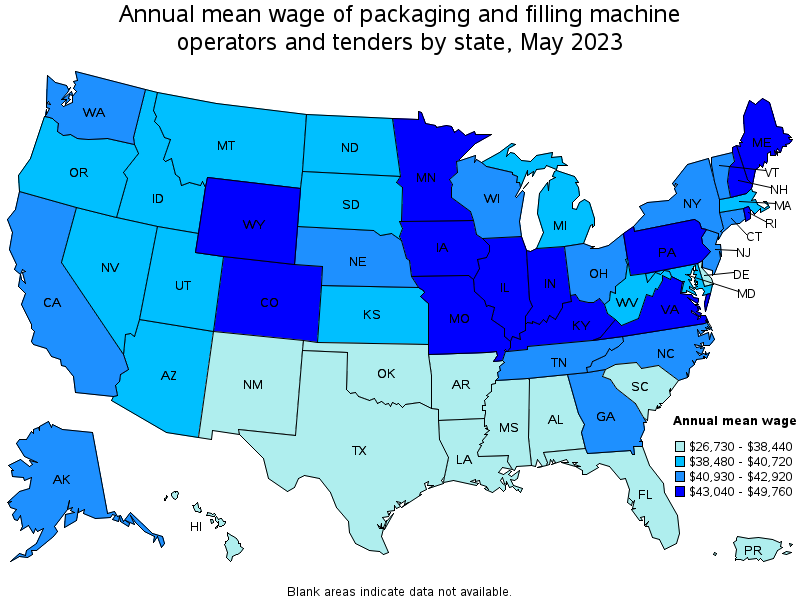
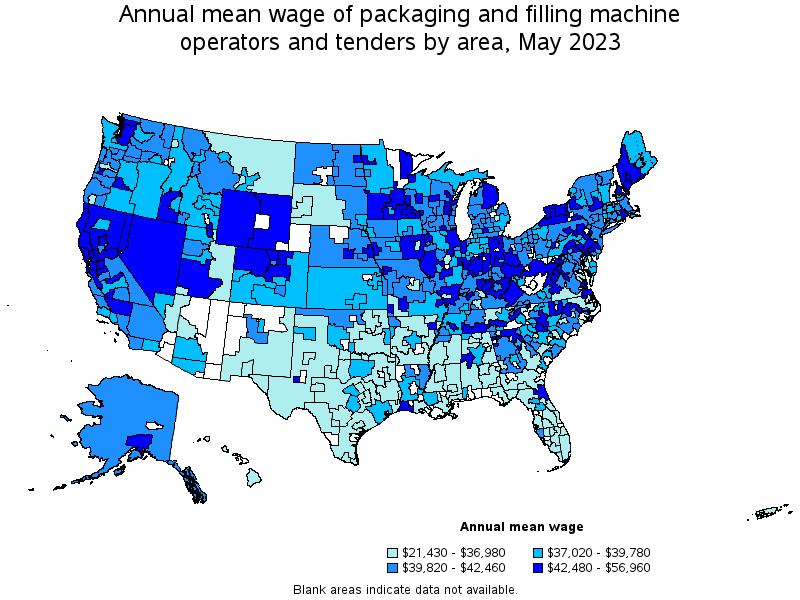
Top paying states for Packaging and Filling Machine Operators and Tenders:
| State | Employment (1) | Employment per thousand jobs | Location quotient (9) | Hourly mean wage | Annual mean wage (2) |
|---|---|---|---|---|---|
| New Hampshire | 660 | 0.97 | 0.40 | $ 23.92 | $ 49,760 |
| Wyoming | 320 | 1.18 | 0.48 | $ 23.26 | $ 48,370 |
| Rhode Island | 1,100 | 2.25 | 0.92 | $ 21.59 | $ 44,910 |
| Colorado | 4,540 | 1.60 | 0.65 | $ 21.28 | $ 44,250 |
| Virginia | 7,790 | 1.96 | 0.80 | $ 21.19 | $ 44,080 |
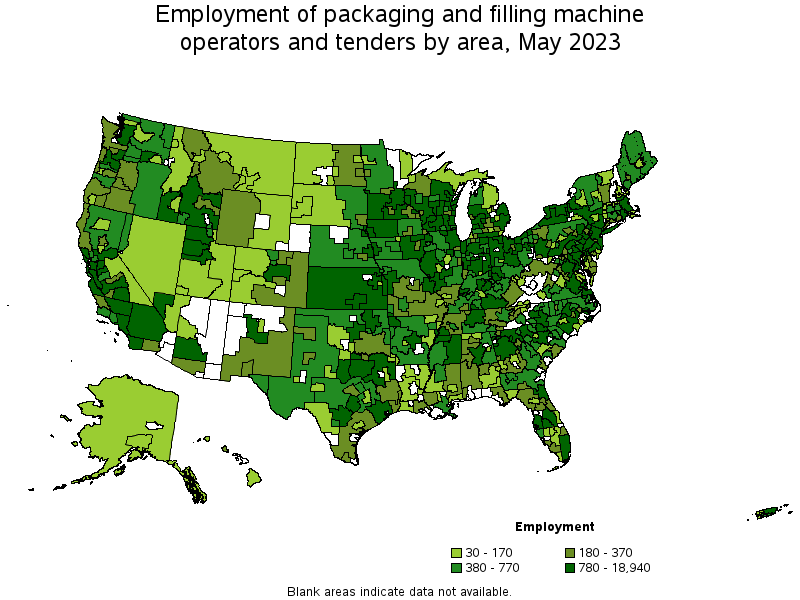
Metropolitan areas with the highest employment level in Packaging and Filling Machine Operators and Tenders:
| Metropolitan area | Employment (1) | Employment per thousand jobs | Location quotient (9) | Hourly mean wage | Annual mean wage (2) |
|---|---|---|---|---|---|
| Chicago-Naperville-Elgin, IL-IN-WI | 18,940 | 4.20 | 1.72 | $ 21.41 | $ 44,540 |
| New York-Newark-Jersey City, NY-NJ-PA | 14,630 | 1.54 | 0.63 | $ 19.71 | $ 40,990 |
| Los Angeles-Long Beach-Anaheim, CA | 12,580 | 2.03 | 0.83 | $ 19.56 | $ 40,680 |
| Dallas-Fort Worth-Arlington, TX | 7,540 | 1.90 | 0.78 | $ 17.85 | $ 37,120 |
| Philadelphia-Camden-Wilmington, PA-NJ-DE-MD | 6,820 | 2.41 | 0.99 | $ 21.41 | $ 44,530 |
| Atlanta-Sandy Springs-Roswell, GA | 5,870 | 2.08 | 0.85 | $ 20.18 | $ 41,980 |
| Phoenix-Mesa-Scottsdale, AZ | 4,490 | 1.96 | 0.80 | $ 18.79 | $ 39,080 |
| St. Louis, MO-IL | 4,470 | 3.37 | 1.38 | $ 20.21 | $ 42,030 |
| Boston-Cambridge-Nashua, MA-NH | 4,450 | 1.61 | 0.66 | $ 19.73 | $ 41,030 |
| Cincinnati, OH-KY-IN | 4,350 | 4.02 | 1.64 | $ 19.79 | $ 41,170 |
Metropolitan areas with the highest concentration of jobs and location quotients in Packaging and Filling Machine Operators and Tenders:
| Metropolitan area | Employment (1) | Employment per thousand jobs | Location quotient (9) | Hourly mean wage | Annual mean wage (2) |
|---|---|---|---|---|---|
| Sheboygan, WI | 1,210 | 20.19 | 8.25 | $ 19.85 | $ 41,280 |
| Twin Falls, ID | 730 | 14.97 | 6.12 | $ 19.48 | $ 40,520 |
| Gettysburg, PA | 480 | 14.76 | 6.03 | $ 18.10 | $ 37,640 |
| Owensboro, KY | 760 | 14.73 | 6.02 | $ 23.66 | $ 49,220 |
| St. Joseph, MO-KS | 720 | 13.60 | 5.56 | $ 22.42 | $ 46,640 |
| Grand Island, NE | 480 | 11.31 | 4.62 | $ 21.20 | $ 44,100 |
| Jonesboro, AR | 660 | 11.27 | 4.61 | $ 21.32 | $ 44,340 |
| Jackson, TN | 770 | 11.25 | 4.60 | $ 22.48 | $ 46,760 |
| Modesto, CA | 2,120 | 11.06 | 4.52 | $ 25.25 | $ 52,520 |
| Green Bay, WI | 1,850 | 10.79 | 4.41 | $ 20.58 | $ 42,810 |
Top paying metropolitan areas for Packaging and Filling Machine Operators and Tenders:
| Metropolitan area | Employment (1) | Employment per thousand jobs | Location quotient (9) | Hourly mean wage | Annual mean wage (2) |
|---|---|---|---|---|---|
| Fort Collins, CO | 700 | 4.01 | 1.64 | $ 27.38 | $ 56,960 |
| Battle Creek, MI | 220 | 4.13 | 1.69 | $ 27.01 | $ 56,190 |
| Syracuse, NY | 790 | 2.68 | 1.09 | $ 25.61 | $ 53,270 |
| Modesto, CA | 2,120 | 11.06 | 4.52 | $ 25.25 | $ 52,520 |
| Cedar Rapids, IA | 1,380 | 9.85 | 4.03 | $ 25.04 | $ 52,070 |
| Lynchburg, VA | 470 | 4.89 | 2.00 | $ 24.72 | $ 51,420 |
| Durham-Chapel Hill, NC | 460 | 1.36 | 0.55 | $ 24.29 | $ 50,520 |
| Lake Charles, LA | 60 | 0.63 | 0.26 | $ 24.27 | $ 50,470 |
| Virginia Beach-Norfolk-Newport News, VA-NC | 970 | 1.32 | 0.54 | $ 23.99 | $ 49,900 |
| Corvallis, OR | 80 | 1.99 | 0.81 | $ 23.98 | $ 49,880 |
Nonmetropolitan areas with the highest employment in Packaging and Filling Machine Operators and Tenders:
| Nonmetropolitan area | Employment (1) | Employment per thousand jobs | Location quotient (9) | Hourly mean wage | Annual mean wage (2) |
|---|---|---|---|---|---|
| Kansas nonmetropolitan area | 3,950 | 10.17 | 4.16 | $ 18.60 | $ 38,680 |
| West Northwestern Ohio nonmetropolitan area | 2,550 | 10.23 | 4.18 | $ 21.35 | $ 44,410 |
| South Central Wisconsin nonmetropolitan area | 2,530 | 12.26 | 5.01 | $ 19.42 | $ 40,400 |
| North Northeastern Ohio nonmetropolitan area (noncontiguous) | 2,250 | 6.90 | 2.82 | $ 19.82 | $ 41,230 |
| Balance of Lower Peninsula of Michigan nonmetropolitan area | 2,140 | 8.16 | 3.34 | $ 20.06 | $ 41,710 |
Nonmetropolitan areas with the highest concentration of jobs and location quotients in Packaging and Filling Machine Operators and Tenders:
| Nonmetropolitan area | Employment (1) | Employment per thousand jobs | Location quotient (9) | Hourly mean wage | Annual mean wage (2) |
|---|---|---|---|---|---|
| South Central Wisconsin nonmetropolitan area | 2,530 | 12.26 | 5.01 | $ 19.42 | $ 40,400 |
| Western Wisconsin nonmetropolitan area | 1,440 | 10.60 | 4.33 | $ 19.51 | $ 40,580 |
| West Northwestern Ohio nonmetropolitan area | 2,550 | 10.23 | 4.18 | $ 21.35 | $ 44,410 |
| Kansas nonmetropolitan area | 3,950 | 10.17 | 4.16 | $ 18.60 | $ 38,680 |
| Southeast Iowa nonmetropolitan area | 1,950 | 9.20 | 3.76 | $ 21.61 | $ 44,940 |
Top paying nonmetropolitan areas for Packaging and Filling Machine Operators and Tenders:
| Nonmetropolitan area | Employment (1) | Employment per thousand jobs | Location quotient (9) | Hourly mean wage | Annual mean wage (2) |
|---|---|---|---|---|---|
| Western Wyoming nonmetropolitan area | 200 | 1.99 | 0.81 | $ 24.31 | $ 50,570 |
| South Central Tennessee nonmetropolitan area | 690 | 6.18 | 2.53 | $ 23.84 | $ 49,590 |
| Central Kentucky nonmetropolitan area | 700 | 3.75 | 1.53 | $ 23.21 | $ 48,280 |
| Southwest New York nonmetropolitan area | 1,110 | 6.52 | 2.66 | $ 23.18 | $ 48,210 |
| Northwest Colorado nonmetropolitan area | 50 | 0.41 | 0.17 | $ 22.83 | $ 47,490 |
These estimates are calculated with data collected from employers in all industry sectors, all metropolitan and nonmetropolitan areas, and all states and the District of Columbia. The top employment and wage figures are provided above. The complete list is available in the downloadable XLS files.
The percentile wage estimate is the value of a wage below which a certain percent of workers fall. The median wage is the 50th percentile wage estimate—50 percent of workers earn less than the median and 50 percent of workers earn more than the median. More about percentile wages.
(1) Estimates for detailed occupations do not sum to the totals because the totals include occupations not shown separately. Estimates do not include self-employed workers.
(2) Annual wages have been calculated by multiplying the hourly mean wage by a "year-round, full-time" hours figure of 2,080 hours; for those occupations where there is not an hourly wage published, the annual wage has been directly calculated from the reported survey data.
(3) The relative standard error (RSE) is a measure of the reliability of a survey statistic. The smaller the relative standard error, the more precise the estimate.
(9) The location quotient is the ratio of the area concentration of occupational employment to the national average concentration. A location quotient greater than one indicates the occupation has a higher share of employment than average, and a location quotient less than one indicates the occupation is less prevalent in the area than average.
Other OEWS estimates and related information:
May 2023 National Occupational Employment and Wage Estimates
May 2023 State Occupational Employment and Wage Estimates
May 2023 Metropolitan and Nonmetropolitan Area Occupational Employment and Wage Estimates
May 2023 National Industry-Specific Occupational Employment and Wage Estimates
Last Modified Date: April 3, 2024