
An official website of the United States government
An official website of the United States government
The .gov means it's official.
Federal government websites often end in .gov or .mil. Before sharing sensitive information,
make sure you're on a federal government site.
The site is secure.
The
https:// ensures that you are connecting to the official website and that any
information you provide is encrypted and transmitted securely.
Help production workers by performing duties requiring less skill. Duties include supplying or holding materials or tools, and cleaning work area and equipment. Apprentice workers are classified in the appropriate production occupations (51-0000).
Employment estimate and mean wage estimates for Helpers--Production Workers:
| Employment (1) | Employment RSE (3) |
Mean hourly wage |
Mean annual wage (2) |
Wage RSE (3) |
|---|---|---|---|---|
| 181,810 | 1.0 % | $ 18.35 | $ 38,160 | 0.4 % |
Percentile wage estimates for Helpers--Production Workers:
| Percentile | 10% | 25% | 50% (Median) |
75% | 90% |
|---|---|---|---|---|---|
| Hourly Wage | $ 13.76 | $ 15.58 | $ 17.65 | $ 20.48 | $ 24.00 |
| Annual Wage (2) | $ 28,630 | $ 32,400 | $ 36,700 | $ 42,600 | $ 49,910 |
Industries with the highest published employment and wages for Helpers--Production Workers are provided. For a list of all industries with employment in Helpers--Production Workers, see the Create Customized Tables function.
Industries with the highest levels of employment in Helpers--Production Workers:
| Industry | Employment (1) | Percent of industry employment | Hourly mean wage | Annual mean wage (2) |
|---|---|---|---|---|
| Employment Services | 23,960 | 0.64 | $ 15.78 | $ 32,830 |
| Animal Slaughtering and Processing | 19,250 | 3.54 | $ 17.95 | $ 37,340 |
| Converted Paper Product Manufacturing | 9,650 | 3.54 | $ 20.09 | $ 41,790 |
| Fabricated Metal Product Manufacturing (3323 and 3324 only) | 9,010 | 1.81 | $ 17.98 | $ 37,400 |
| Printing and Related Support Activities | 8,000 | 2.12 | $ 17.29 | $ 35,960 |
Industries with the highest concentration of employment in Helpers--Production Workers:
| Industry | Employment (1) | Percent of industry employment | Hourly mean wage | Annual mean wage (2) |
|---|---|---|---|---|
| Animal Slaughtering and Processing | 19,250 | 3.54 | $ 17.95 | $ 37,340 |
| Converted Paper Product Manufacturing | 9,650 | 3.54 | $ 20.09 | $ 41,790 |
| Pulp, Paper, and Paperboard Mills | 2,410 | 2.73 | $ 24.58 | $ 51,120 |
| Coating, Engraving, Heat Treating, and Allied Activities | 3,270 | 2.50 | $ 17.97 | $ 37,380 |
| Sawmills and Wood Preservation | 2,190 | 2.38 | $ 17.80 | $ 37,020 |
Top paying industries for Helpers--Production Workers:
| Industry | Employment (1) | Percent of industry employment | Hourly mean wage | Annual mean wage (2) |
|---|---|---|---|---|
| Rail Transportation | 60 | 0.03 | $ 32.98 | $ 68,590 |
| Coal Mining | 50 | 0.12 | $ 25.83 | $ 53,730 |
| Motor Vehicle Manufacturing | 550 | 0.19 | $ 24.89 | $ 51,770 |
| Pulp, Paper, and Paperboard Mills | 2,410 | 2.73 | $ 24.58 | $ 51,120 |
| Aerospace Product and Parts Manufacturing | 930 | 0.18 | $ 24.16 | $ 50,250 |
States and areas with the highest published employment, location quotients, and wages for Helpers--Production Workers are provided. For a list of all areas with employment in Helpers--Production Workers, see the Create Customized Tables function.
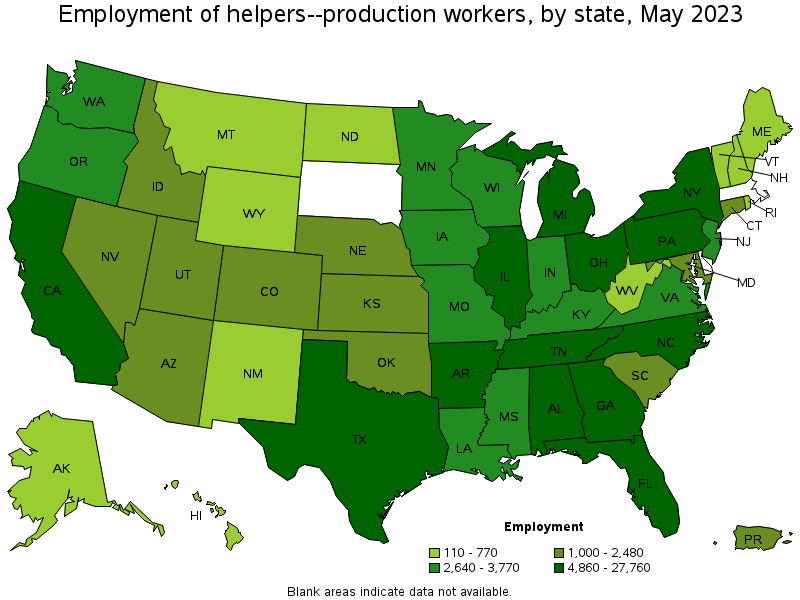
States with the highest employment level in Helpers--Production Workers:
| State | Employment (1) | Employment per thousand jobs | Location quotient (9) | Hourly mean wage | Annual mean wage (2) |
|---|---|---|---|---|---|
| Texas | 27,760 | 2.05 | 1.71 | $ 16.80 | $ 34,950 |
| California | 22,830 | 1.27 | 1.06 | $ 20.56 | $ 42,760 |
| Alabama | 9,350 | 4.55 | 3.80 | $ 16.25 | $ 33,790 |
| Illinois | 7,690 | 1.28 | 1.07 | $ 19.31 | $ 40,170 |
| North Carolina | 6,870 | 1.43 | 1.20 | $ 17.64 | $ 36,680 |
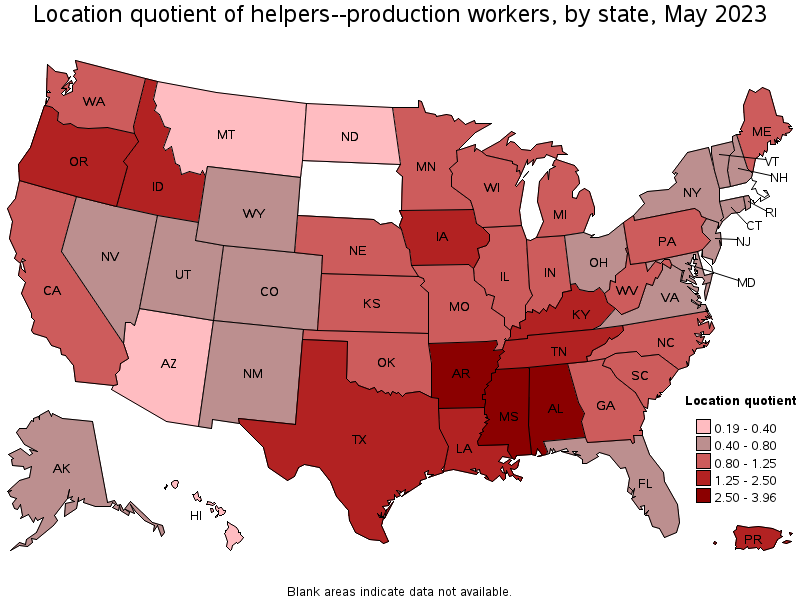
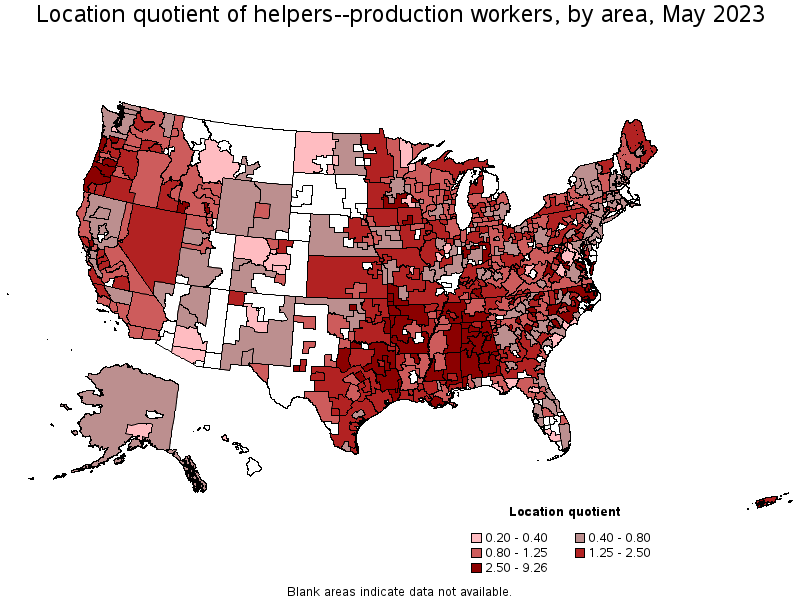
States with the highest concentration of jobs and location quotients in Helpers--Production Workers:
| State | Employment (1) | Employment per thousand jobs | Location quotient (9) | Hourly mean wage | Annual mean wage (2) |
|---|---|---|---|---|---|
| Arkansas | 6,030 | 4.74 | 3.96 | $ 17.42 | $ 36,230 |
| Alabama | 9,350 | 4.55 | 3.80 | $ 16.25 | $ 33,790 |
| Mississippi | 3,710 | 3.22 | 2.69 | $ 15.65 | $ 32,550 |
| Idaho | 1,890 | 2.29 | 1.92 | $ 17.37 | $ 36,140 |
| Texas | 27,760 | 2.05 | 1.71 | $ 16.80 | $ 34,950 |
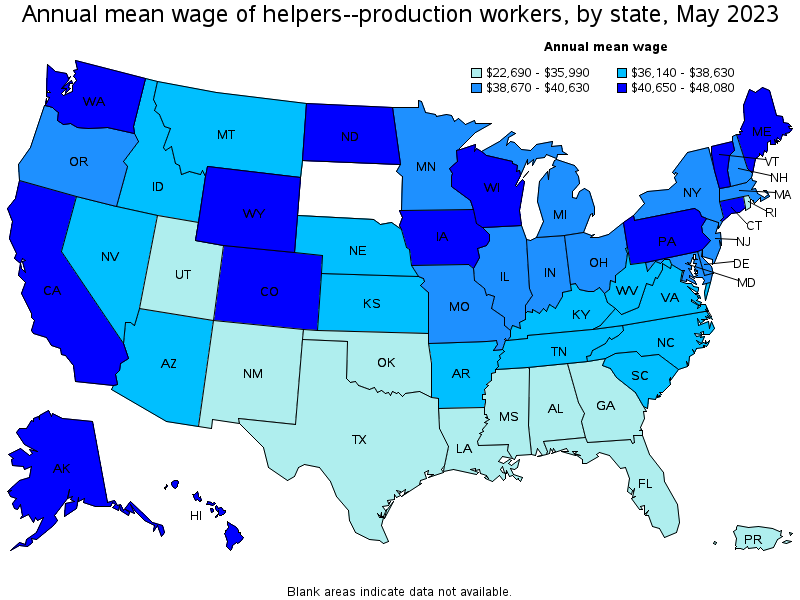
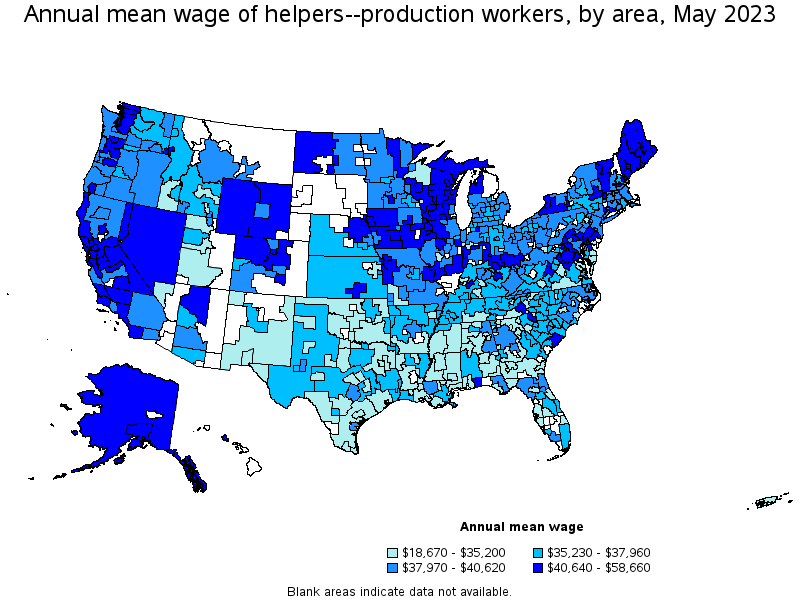
Top paying states for Helpers--Production Workers:
| State | Employment (1) | Employment per thousand jobs | Location quotient (9) | Hourly mean wage | Annual mean wage (2) |
|---|---|---|---|---|---|
| Wyoming | 200 | 0.72 | 0.61 | $ 23.11 | $ 48,080 |
| Alaska | 150 | 0.48 | 0.40 | $ 22.49 | $ 46,790 |
| Hawaii | 140 | 0.23 | 0.19 | $ 21.00 | $ 43,680 |
| Maine | 730 | 1.17 | 0.98 | $ 20.68 | $ 43,010 |
| California | 22,830 | 1.27 | 1.06 | $ 20.56 | $ 42,760 |
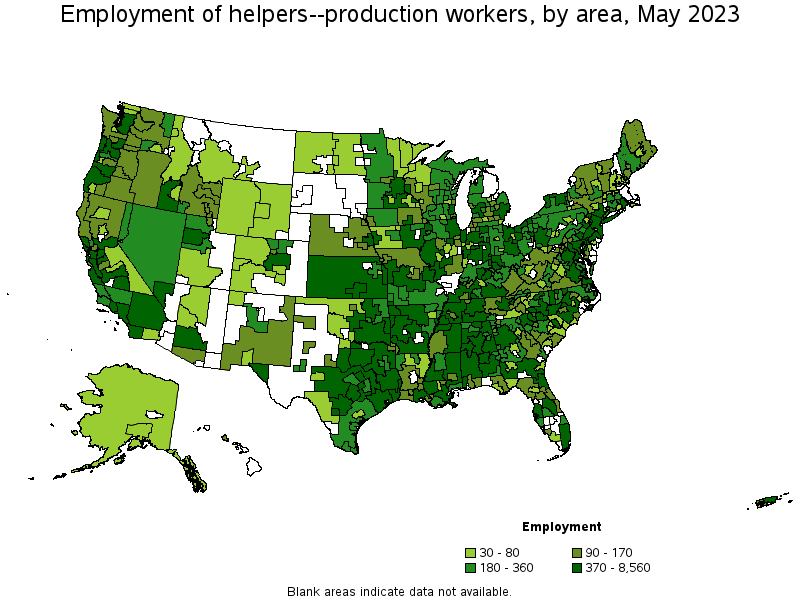
Metropolitan areas with the highest employment level in Helpers--Production Workers:
| Metropolitan area | Employment (1) | Employment per thousand jobs | Location quotient (9) | Hourly mean wage | Annual mean wage (2) |
|---|---|---|---|---|---|
| Los Angeles-Long Beach-Anaheim, CA | 8,560 | 1.38 | 1.16 | $ 20.06 | $ 41,730 |
| Dallas-Fort Worth-Arlington, TX | 7,360 | 1.85 | 1.55 | $ 17.42 | $ 36,220 |
| Houston-The Woodlands-Sugar Land, TX | 7,280 | 2.29 | 1.91 | $ 16.70 | $ 34,730 |
| Chicago-Naperville-Elgin, IL-IN-WI | 5,100 | 1.13 | 0.95 | $ 19.04 | $ 39,600 |
| New York-Newark-Jersey City, NY-NJ-PA | 4,690 | 0.49 | 0.41 | $ 19.37 | $ 40,300 |
| Atlanta-Sandy Springs-Roswell, GA | 2,360 | 0.84 | 0.70 | $ 18.25 | $ 37,970 |
| San Francisco-Oakland-Hayward, CA | 2,300 | 0.95 | 0.79 | $ 21.71 | $ 45,160 |
| San Diego-Carlsbad, CA | 2,130 | 1.40 | 1.17 | $ 21.54 | $ 44,790 |
| Riverside-San Bernardino-Ontario, CA | 2,100 | 1.26 | 1.05 | $ 19.53 | $ 40,620 |
| Philadelphia-Camden-Wilmington, PA-NJ-DE-MD | 2,060 | 0.73 | 0.61 | $ 19.87 | $ 41,320 |
Metropolitan areas with the highest concentration of jobs and location quotients in Helpers--Production Workers:
| Metropolitan area | Employment (1) | Employment per thousand jobs | Location quotient (9) | Hourly mean wage | Annual mean wage (2) |
|---|---|---|---|---|---|
| Morristown, TN | 430 | 9.23 | 7.71 | $ 16.04 | $ 33,360 |
| Decatur, AL | 350 | 6.12 | 5.11 | $ 17.14 | $ 35,660 |
| Gadsden, AL | 180 | 5.46 | 4.56 | $ 14.99 | $ 31,170 |
| Waterloo-Cedar Falls, IA | 460 | 5.38 | 4.49 | $ 20.13 | $ 41,870 |
| Waco, TX | 670 | 5.34 | 4.46 | $ 16.11 | $ 33,510 |
| Florence, SC | 440 | 5.02 | 4.19 | $ 17.90 | $ 37,230 |
| Florence-Muscle Shoals, AL | 260 | 4.72 | 3.94 | $ 13.95 | $ 29,020 |
| Fort Smith, AR-OK | 500 | 4.67 | 3.90 | $ 17.82 | $ 37,070 |
| Fayetteville-Springdale-Rogers, AR-MO | 1,240 | 4.65 | 3.88 | $ 18.21 | $ 37,870 |
| Tuscaloosa, AL | 480 | 4.63 | 3.87 | $ 16.42 | $ 34,150 |
Top paying metropolitan areas for Helpers--Production Workers:
| Metropolitan area | Employment (1) | Employment per thousand jobs | Location quotient (9) | Hourly mean wage | Annual mean wage (2) |
|---|---|---|---|---|---|
| Pittsfield, MA | 70 | 1.77 | 1.47 | $ 24.55 | $ 51,060 |
| Napa, CA | 280 | 3.55 | 2.96 | $ 24.54 | $ 51,030 |
| Oshkosh-Neenah, WI | 210 | 2.22 | 1.85 | $ 24.32 | $ 50,590 |
| Vallejo-Fairfield, CA | 160 | 1.13 | 0.95 | $ 24.12 | $ 50,160 |
| Anchorage, AK | 70 | 0.44 | 0.37 | $ 22.91 | $ 47,650 |
| Bangor, ME | 40 | 0.67 | 0.56 | $ 22.81 | $ 47,450 |
| Eau Claire, WI | 80 | 0.99 | 0.82 | $ 22.78 | $ 47,380 |
| Sioux City, IA-NE-SD | 120 | 1.37 | 1.15 | $ 22.47 | $ 46,730 |
| Wausau, WI | 110 | 1.65 | 1.37 | $ 22.28 | $ 46,340 |
| San Jose-Sunnyvale-Santa Clara, CA | 1,020 | 0.89 | 0.74 | $ 22.17 | $ 46,120 |
Nonmetropolitan areas with the highest employment in Helpers--Production Workers:
| Nonmetropolitan area | Employment (1) | Employment per thousand jobs | Location quotient (9) | Hourly mean wage | Annual mean wage (2) |
|---|---|---|---|---|---|
| Northeast Alabama nonmetropolitan area | 1,430 | 9.59 | 8.01 | $ 18.76 | $ 39,020 |
| North Texas Region of Texas nonmetropolitan area | 1,370 | 4.92 | 4.11 | $ 16.55 | $ 34,420 |
| Southeast Mississippi nonmetropolitan area | 1,080 | 7.34 | 6.13 | $ 15.44 | $ 32,120 |
| South Arkansas nonmetropolitan area | 1,010 | 10.97 | 9.16 | $ 16.84 | $ 35,030 |
| West Arkansas nonmetropolitan area | 970 | 11.09 | 9.26 | $ 16.94 | $ 35,230 |
Nonmetropolitan areas with the highest concentration of jobs and location quotients in Helpers--Production Workers:
| Nonmetropolitan area | Employment (1) | Employment per thousand jobs | Location quotient (9) | Hourly mean wage | Annual mean wage (2) |
|---|---|---|---|---|---|
| West Arkansas nonmetropolitan area | 970 | 11.09 | 9.26 | $ 16.94 | $ 35,230 |
| South Arkansas nonmetropolitan area | 1,010 | 10.97 | 9.16 | $ 16.84 | $ 35,030 |
| Southeast Alabama nonmetropolitan area | 850 | 9.82 | 8.20 | $ 15.68 | $ 32,620 |
| Northeast Alabama nonmetropolitan area | 1,430 | 9.59 | 8.01 | $ 18.76 | $ 39,020 |
| Southeast Mississippi nonmetropolitan area | 1,080 | 7.34 | 6.13 | $ 15.44 | $ 32,120 |
Top paying nonmetropolitan areas for Helpers--Production Workers:
| Nonmetropolitan area | Employment (1) | Employment per thousand jobs | Location quotient (9) | Hourly mean wage | Annual mean wage (2) |
|---|---|---|---|---|---|
| Western Wyoming nonmetropolitan area | 70 | 0.67 | 0.56 | $ 28.20 | $ 58,660 |
| Upper Peninsula of Michigan nonmetropolitan area | 180 | 1.64 | 1.37 | $ 26.47 | $ 55,060 |
| Northeast Minnesota nonmetropolitan area | 50 | 1.08 | 0.90 | $ 24.05 | $ 50,020 |
| Eastern Sierra-Mother Lode Region of California nonmetropolitan area | 60 | 1.01 | 0.85 | $ 22.81 | $ 47,440 |
| Alaska nonmetropolitan area | 60 | 0.56 | 0.47 | $ 22.41 | $ 46,620 |
These estimates are calculated with data collected from employers in all industry sectors, all metropolitan and nonmetropolitan areas, and all states and the District of Columbia. The top employment and wage figures are provided above. The complete list is available in the downloadable XLS files.
The percentile wage estimate is the value of a wage below which a certain percent of workers fall. The median wage is the 50th percentile wage estimate—50 percent of workers earn less than the median and 50 percent of workers earn more than the median. More about percentile wages.
(1) Estimates for detailed occupations do not sum to the totals because the totals include occupations not shown separately. Estimates do not include self-employed workers.
(2) Annual wages have been calculated by multiplying the hourly mean wage by a "year-round, full-time" hours figure of 2,080 hours; for those occupations where there is not an hourly wage published, the annual wage has been directly calculated from the reported survey data.
(3) The relative standard error (RSE) is a measure of the reliability of a survey statistic. The smaller the relative standard error, the more precise the estimate.
(9) The location quotient is the ratio of the area concentration of occupational employment to the national average concentration. A location quotient greater than one indicates the occupation has a higher share of employment than average, and a location quotient less than one indicates the occupation is less prevalent in the area than average.
Other OEWS estimates and related information:
May 2023 National Occupational Employment and Wage Estimates
May 2023 State Occupational Employment and Wage Estimates
May 2023 Metropolitan and Nonmetropolitan Area Occupational Employment and Wage Estimates
May 2023 National Industry-Specific Occupational Employment and Wage Estimates
Last Modified Date: April 3, 2024