
An official website of the United States government
An official website of the United States government
The .gov means it's official.
Federal government websites often end in .gov or .mil. Before sharing sensitive information,
make sure you're on a federal government site.
The site is secure.
The
https:// ensures that you are connecting to the official website and that any
information you provide is encrypted and transmitted securely.
Service automobiles, buses, trucks, boats, and other automotive or marine vehicles with fuel, lubricants, and accessories. Collect payment for services and supplies. May lubricate vehicle, change motor oil, refill antifreeze, or replace lights or other accessories, such as windshield wiper blades or fan belts. May repair or replace tires. Excludes �Cashiers� (41-2011).
Employment estimate and mean wage estimates for Automotive and Watercraft Service Attendants:
| Employment (1) | Employment RSE (3) |
Mean hourly wage |
Mean annual wage (2) |
Wage RSE (3) |
|---|---|---|---|---|
| 92,530 | 1.8 % | $ 16.60 | $ 34,530 | 0.4 % |
Percentile wage estimates for Automotive and Watercraft Service Attendants:
| Percentile | 10% | 25% | 50% (Median) |
75% | 90% |
|---|---|---|---|---|---|
| Hourly Wage | $ 13.19 | $ 14.25 | $ 16.26 | $ 17.87 | $ 21.07 |
| Annual Wage (2) | $ 27,430 | $ 29,640 | $ 33,820 | $ 37,170 | $ 43,830 |
Industries with the highest published employment and wages for Automotive and Watercraft Service Attendants are provided. For a list of all industries with employment in Automotive and Watercraft Service Attendants, see the Create Customized Tables function.
Industries with the highest levels of employment in Automotive and Watercraft Service Attendants:
| Industry | Employment (1) | Percent of industry employment | Hourly mean wage | Annual mean wage (2) |
|---|---|---|---|---|
| Automotive Repair and Maintenance | 36,770 | 3.67 | $ 16.03 | $ 33,340 |
| Automobile Dealers | 20,860 | 1.65 | $ 17.53 | $ 36,450 |
| Gasoline Stations | 16,070 | 1.66 | $ 15.47 | $ 32,190 |
| Food and Beverage Retailers (4451 and 4452 only) | 3,760 | 0.12 | $ 15.05 | $ 31,310 |
| General Merchandise Retailers | 3,400 | 0.11 | $ 21.68 | $ 45,090 |
Industries with the highest concentration of employment in Automotive and Watercraft Service Attendants:
| Industry | Employment (1) | Percent of industry employment | Hourly mean wage | Annual mean wage (2) |
|---|---|---|---|---|
| Automotive Repair and Maintenance | 36,770 | 3.67 | $ 16.03 | $ 33,340 |
| Gasoline Stations | 16,070 | 1.66 | $ 15.47 | $ 32,190 |
| Automobile Dealers | 20,860 | 1.65 | $ 17.53 | $ 36,450 |
| Fuel Dealers | 250 | 0.35 | $ 16.24 | $ 33,770 |
| Urban Transit Systems | 110 | 0.26 | $ 20.59 | $ 42,830 |
Top paying industries for Automotive and Watercraft Service Attendants:
| Industry | Employment (1) | Percent of industry employment | Hourly mean wage | Annual mean wage (2) |
|---|---|---|---|---|
| State Government, excluding Schools and Hospitals (OEWS Designation) | 90 | (7) | $ 25.84 | $ 53,750 |
| Other Specialty Trade Contractors | 110 | 0.01 | $ 25.46 | $ 52,970 |
| Highway, Street, and Bridge Construction | 30 | 0.01 | $ 23.52 | $ 48,920 |
| Federal, State, and Local Government, excluding State and Local Government Schools and Hospitals and the U.S. Postal Service (OEWS Designation) | 140 | 0.01 | $ 23.27 | $ 48,390 |
| Local Government, excluding Schools and Hospitals (OEWS Designation) | 1,070 | 0.02 | $ 21.91 | $ 45,560 |
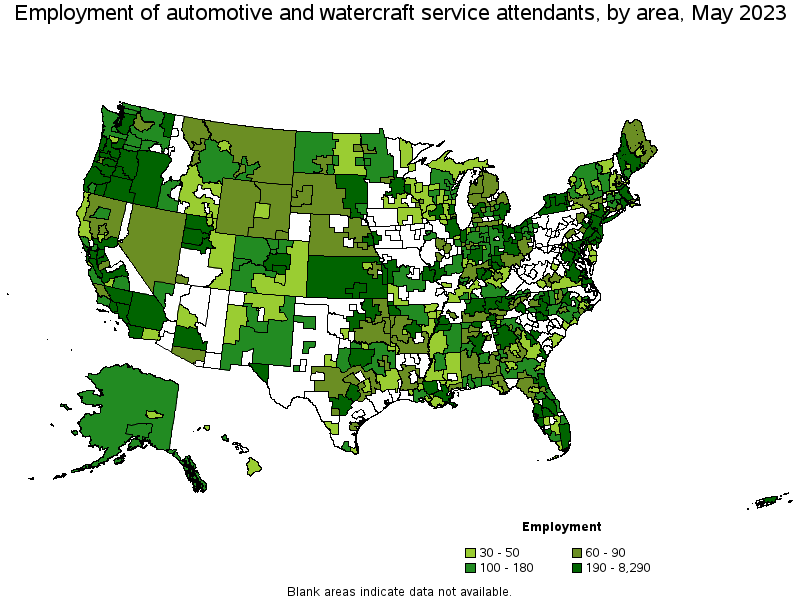
States and areas with the highest published employment, location quotients, and wages for Automotive and Watercraft Service Attendants are provided. For a list of all areas with employment in Automotive and Watercraft Service Attendants, see the Create Customized Tables function.
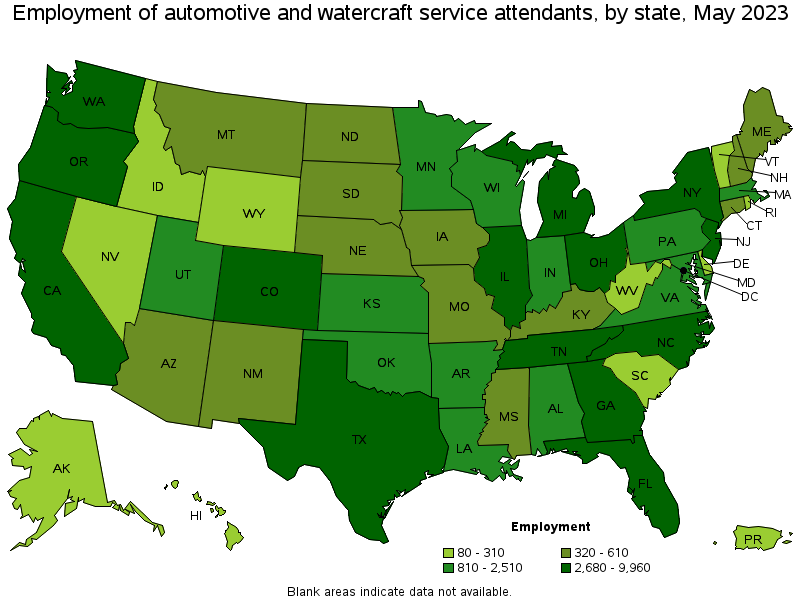
States with the highest employment level in Automotive and Watercraft Service Attendants:
| State | Employment (1) | Employment per thousand jobs | Location quotient (9) | Hourly mean wage | Annual mean wage (2) |
|---|---|---|---|---|---|
| California | 9,960 | 0.56 | 0.91 | $ 19.42 | $ 40,390 |
| New Jersey | 8,910 | 2.12 | 3.48 | $ 16.04 | $ 33,360 |
| Texas | 7,850 | 0.58 | 0.95 | $ 15.88 | $ 33,020 |
| Oregon | 5,950 | 3.06 | 5.02 | $ 16.73 | $ 34,800 |
| Florida | 5,320 | 0.56 | 0.91 | $ 16.46 | $ 34,240 |
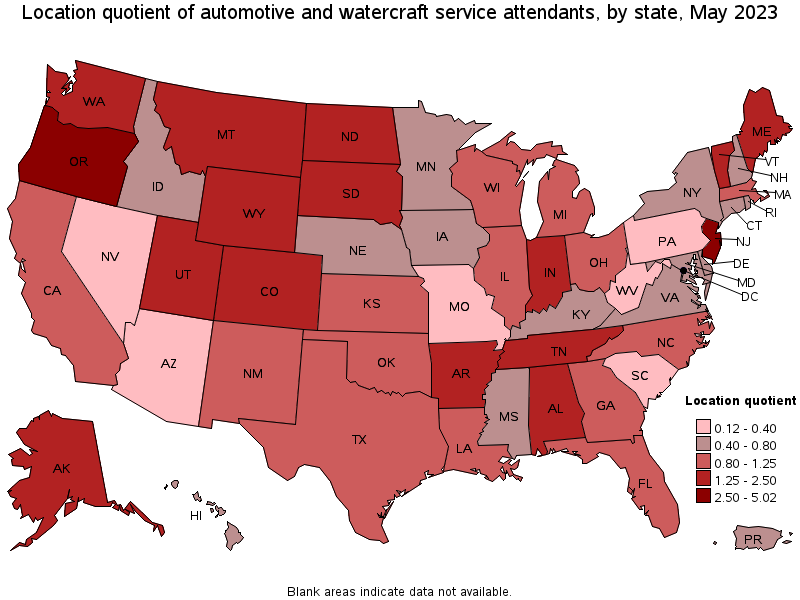
States with the highest concentration of jobs and location quotients in Automotive and Watercraft Service Attendants:
| State | Employment (1) | Employment per thousand jobs | Location quotient (9) | Hourly mean wage | Annual mean wage (2) |
|---|---|---|---|---|---|
| Oregon | 5,950 | 3.06 | 5.02 | $ 16.73 | $ 34,800 |
| New Jersey | 8,910 | 2.12 | 3.48 | $ 16.04 | $ 33,360 |
| South Dakota | 560 | 1.25 | 2.05 | $ 16.33 | $ 33,970 |
| North Dakota | 440 | 1.05 | 1.72 | $ 16.71 | $ 34,750 |
| Alabama | 2,150 | 1.05 | 1.72 | $ 14.75 | $ 30,670 |
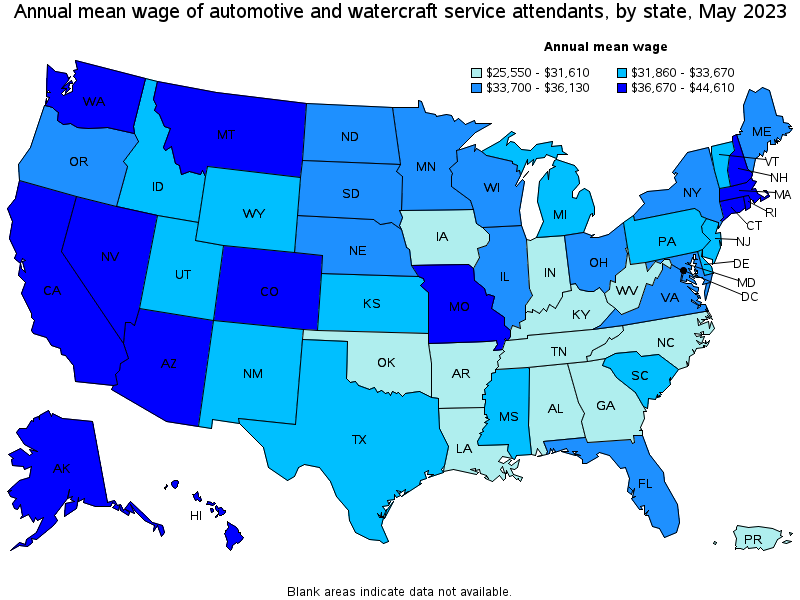
Top paying states for Automotive and Watercraft Service Attendants:
| State | Employment (1) | Employment per thousand jobs | Location quotient (9) | Hourly mean wage | Annual mean wage (2) |
|---|---|---|---|---|---|
| Hawaii | 210 | 0.34 | 0.56 | $ 21.45 | $ 44,610 |
| Connecticut | 600 | 0.36 | 0.59 | $ 20.01 | $ 41,620 |
| California | 9,960 | 0.56 | 0.91 | $ 19.42 | $ 40,390 |
| Alaska | 310 | 1.01 | 1.65 | $ 19.34 | $ 40,230 |
| Washington | 2,960 | 0.85 | 1.39 | $ 19.16 | $ 39,850 |
Metropolitan areas with the highest employment level in Automotive and Watercraft Service Attendants:
| Metropolitan area | Employment (1) | Employment per thousand jobs | Location quotient (9) | Hourly mean wage | Annual mean wage (2) |
|---|---|---|---|---|---|
| New York-Newark-Jersey City, NY-NJ-PA | 8,290 | 0.87 | 1.43 | $ 16.64 | $ 34,620 |
| Los Angeles-Long Beach-Anaheim, CA | 3,270 | 0.53 | 0.87 | $ 19.67 | $ 40,910 |
| Portland-Vancouver-Hillsboro, OR-WA | 2,560 | 2.12 | 3.48 | $ 17.57 | $ 36,550 |
| Dallas-Fort Worth-Arlington, TX | 2,100 | 0.53 | 0.87 | $ 16.27 | $ 33,840 |
| Chicago-Naperville-Elgin, IL-IN-WI | 2,090 | 0.46 | 0.76 | $ 17.91 | $ 37,250 |
| Philadelphia-Camden-Wilmington, PA-NJ-DE-MD | 2,000 | 0.71 | 1.16 | $ 15.64 | $ 32,530 |
| Atlanta-Sandy Springs-Roswell, GA | 1,590 | 0.56 | 0.93 | $ 14.37 | $ 29,890 |
| Boston-Cambridge-Nashua, MA-NH | 1,480 | 0.53 | 0.88 | $ 18.45 | $ 38,380 |
| Denver-Aurora-Lakewood, CO | 1,410 | 0.88 | 1.45 | $ 18.51 | $ 38,500 |
| Seattle-Tacoma-Bellevue, WA | 1,390 | 0.67 | 1.10 | $ 20.15 | $ 41,910 |
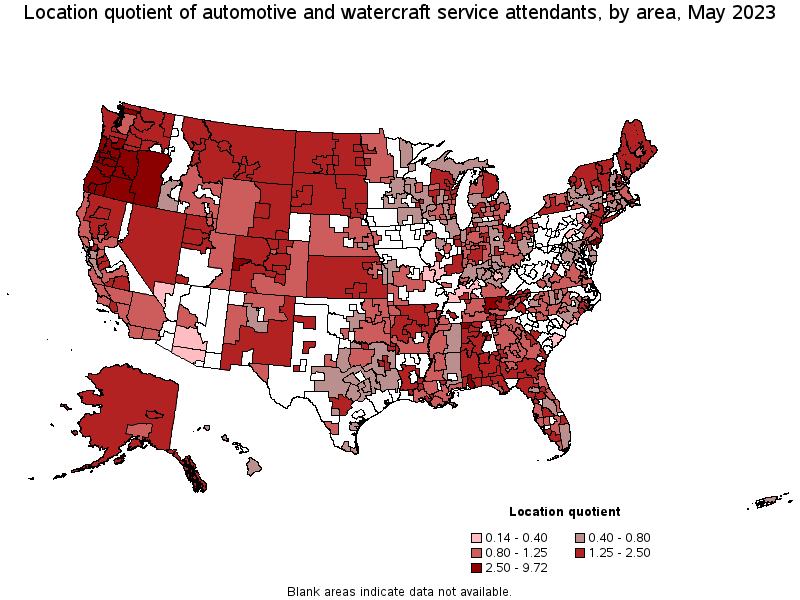
Metropolitan areas with the highest concentration of jobs and location quotients in Automotive and Watercraft Service Attendants:
| Metropolitan area | Employment (1) | Employment per thousand jobs | Location quotient (9) | Hourly mean wage | Annual mean wage (2) |
|---|---|---|---|---|---|
| Grants Pass, OR | 170 | 5.77 | 9.47 | $ 16.21 | $ 33,710 |
| Medford, OR | 390 | 4.48 | 7.35 | $ 16.43 | $ 34,170 |
| Vineland-Bridgeton, NJ | 270 | 4.31 | 7.08 | $ 15.25 | $ 31,720 |
| Albany, OR | 190 | 3.92 | 6.44 | $ 16.90 | $ 35,160 |
| Bend-Redmond, OR | 330 | 3.68 | 6.05 | $ 16.60 | $ 34,530 |
| Ocean City, NJ | 150 | 3.62 | 5.95 | $ 16.18 | $ 33,640 |
| Eugene, OR | 490 | 3.17 | 5.20 | $ 15.95 | $ 33,170 |
| Atlantic City-Hammonton, NJ | 380 | 3.03 | 4.97 | $ 15.59 | $ 32,430 |
| Salem, OR | 460 | 2.54 | 4.17 | $ 16.86 | $ 35,060 |
| Portland-Vancouver-Hillsboro, OR-WA | 2,560 | 2.12 | 3.48 | $ 17.57 | $ 36,550 |
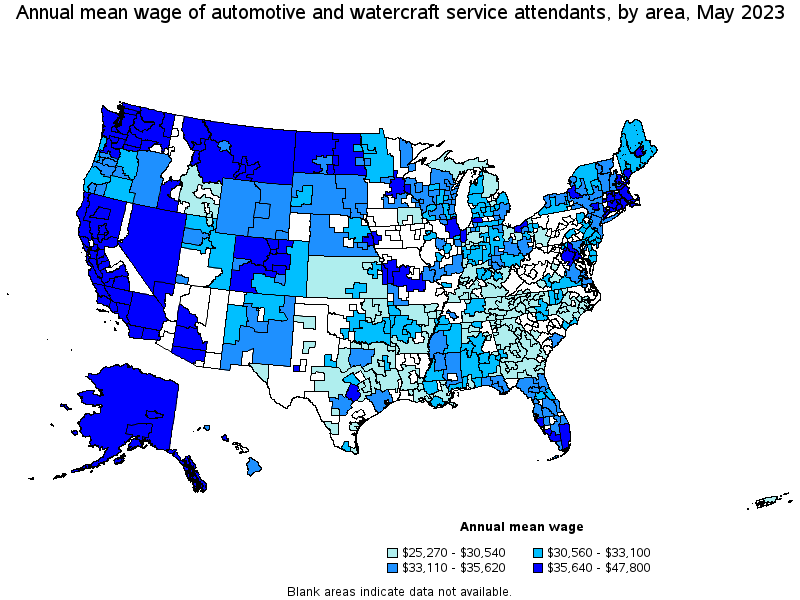
Top paying metropolitan areas for Automotive and Watercraft Service Attendants:
| Metropolitan area | Employment (1) | Employment per thousand jobs | Location quotient (9) | Hourly mean wage | Annual mean wage (2) |
|---|---|---|---|---|---|
| Urban Honolulu, HI | 160 | 0.36 | 0.58 | $ 22.98 | $ 47,800 |
| Norwich-New London-Westerly, CT-RI | 70 | 0.57 | 0.93 | $ 21.70 | $ 45,140 |
| San Jose-Sunnyvale-Santa Clara, CA | 400 | 0.35 | 0.57 | $ 21.61 | $ 44,940 |
| Fairbanks, AK | 40 | 1.19 | 1.95 | $ 21.48 | $ 44,670 |
| San Francisco-Oakland-Hayward, CA | 1,070 | 0.44 | 0.72 | $ 21.34 | $ 44,390 |
| El Centro, CA | 30 | 0.51 | 0.83 | $ 20.15 | $ 41,910 |
| Seattle-Tacoma-Bellevue, WA | 1,390 | 0.67 | 1.10 | $ 20.15 | $ 41,910 |
| Bridgeport-Stamford-Norwalk, CT | 170 | 0.43 | 0.70 | $ 20.14 | $ 41,900 |
| New Haven, CT | 90 | 0.32 | 0.53 | $ 20.02 | $ 41,630 |
| Danbury, CT | 30 | 0.45 | 0.74 | $ 19.77 | $ 41,120 |
Nonmetropolitan areas with the highest employment in Automotive and Watercraft Service Attendants:
| Nonmetropolitan area | Employment (1) | Employment per thousand jobs | Location quotient (9) | Hourly mean wage | Annual mean wage (2) |
|---|---|---|---|---|---|
| Coast Oregon nonmetropolitan area | 680 | 5.92 | 9.72 | $ 15.89 | $ 33,060 |
| Eastern Oregon nonmetropolitan area | 380 | 5.13 | 8.42 | $ 15.97 | $ 33,220 |
| Central Oregon nonmetropolitan area | 360 | 5.59 | 9.18 | $ 15.78 | $ 32,820 |
| Kansas nonmetropolitan area | 310 | 0.80 | 1.31 | $ 14.05 | $ 29,220 |
| Southwest Maine nonmetropolitan area | 270 | 1.41 | 2.31 | $ 15.77 | $ 32,790 |
Nonmetropolitan areas with the highest concentration of jobs and location quotients in Automotive and Watercraft Service Attendants:
| Nonmetropolitan area | Employment (1) | Employment per thousand jobs | Location quotient (9) | Hourly mean wage | Annual mean wage (2) |
|---|---|---|---|---|---|
| Coast Oregon nonmetropolitan area | 680 | 5.92 | 9.72 | $ 15.89 | $ 33,060 |
| Central Oregon nonmetropolitan area | 360 | 5.59 | 9.18 | $ 15.78 | $ 32,820 |
| Eastern Oregon nonmetropolitan area | 380 | 5.13 | 8.42 | $ 15.97 | $ 33,220 |
| North Central Tennessee nonmetropolitan area | 190 | 1.64 | 2.69 | $ 13.79 | $ 28,690 |
| East South Dakota nonmetropolitan area | 200 | 1.50 | 2.46 | $ 16.72 | $ 34,770 |
Top paying nonmetropolitan areas for Automotive and Watercraft Service Attendants:
| Nonmetropolitan area | Employment (1) | Employment per thousand jobs | Location quotient (9) | Hourly mean wage | Annual mean wage (2) |
|---|---|---|---|---|---|
| Massachusetts nonmetropolitan area | 40 | 0.68 | 1.11 | $ 19.33 | $ 40,210 |
| East-Central Montana nonmetropolitan area | 60 | 0.87 | 1.42 | $ 19.21 | $ 39,960 |
| North Coast Region of California nonmetropolitan area | 50 | 0.51 | 0.84 | $ 18.93 | $ 39,370 |
| Alaska nonmetropolitan area | 150 | 1.43 | 2.34 | $ 18.84 | $ 39,190 |
| North Valley-Northern Mountains Region of California nonmetropolitan area | 80 | 0.79 | 1.29 | $ 18.24 | $ 37,950 |
These estimates are calculated with data collected from employers in all industry sectors, all metropolitan and nonmetropolitan areas, and all states and the District of Columbia. The top employment and wage figures are provided above. The complete list is available in the downloadable XLS files.
The percentile wage estimate is the value of a wage below which a certain percent of workers fall. The median wage is the 50th percentile wage estimate—50 percent of workers earn less than the median and 50 percent of workers earn more than the median. More about percentile wages.
(1) Estimates for detailed occupations do not sum to the totals because the totals include occupations not shown separately. Estimates do not include self-employed workers.
(2) Annual wages have been calculated by multiplying the hourly mean wage by a "year-round, full-time" hours figure of 2,080 hours; for those occupations where there is not an hourly wage published, the annual wage has been directly calculated from the reported survey data.
(3) The relative standard error (RSE) is a measure of the reliability of a survey statistic. The smaller the relative standard error, the more precise the estimate.
(7) The value is less than .005 percent of industry employment.
(9) The location quotient is the ratio of the area concentration of occupational employment to the national average concentration. A location quotient greater than one indicates the occupation has a higher share of employment than average, and a location quotient less than one indicates the occupation is less prevalent in the area than average.
Other OEWS estimates and related information:
May 2023 National Occupational Employment and Wage Estimates
May 2023 State Occupational Employment and Wage Estimates
May 2023 Metropolitan and Nonmetropolitan Area Occupational Employment and Wage Estimates
May 2023 National Industry-Specific Occupational Employment and Wage Estimates
Last Modified Date: April 3, 2024