An official website of the United States government
An official website of the United States government
The .gov means it's official.
Federal government websites often end in .gov or .mil. Before sharing sensitive information,
make sure you're on a federal government site.
The site is secure.
The
https:// ensures that you are connecting to the official website and that any
information you provide is encrypted and transmitted securely.
January 2011
Private colleges employed a higher share of educators than State colleges did in May 2009—but also a higher share of managers. Education, training, and library occupations made up about 42 percent of employment in private sector colleges, universities, and professional schools, but 39 percent of employment in colleges owned by State government. The corresponding figures for management occupations were 8 and 6 percent, respectively. Overall, colleges, universities, and professional schools had employment of about 2.8 million in May 2009; about 41 percent of these jobs were found in the private sector, and about 58 percent in State government.1
After education, training, and library occupations, office and administrative support was the largest occupational group in this industry, making up 20 percent of employment in private colleges and a similar employment share of 19 percent in State colleges. In addition to education and management occupations, private colleges had a slightly higher share of arts, design, entertainment, sports, and media occupations than State colleges: 3 percent of total employment compared with 2 percent. State colleges had slightly higher shares of employment in computer and mathematical science; building and grounds cleaning and maintenance; and installation, maintenance, and repair occupations, although each of these occupational groups made up 4 percent or less of employment in both private and State colleges.
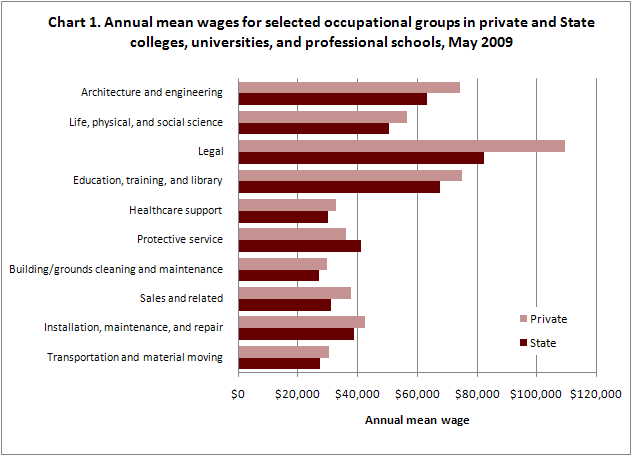
Private sector colleges had higher average wages in 12 of the 20 occupational groups for which both private and State college wages were available. Some of the groups with the largest wage differences between private and State colleges are shown in chart 1. Average wages for education, training, and library occupations were $7,250, or nearly 11 percent, higher per year in private sector colleges than in State colleges. Other groups had even larger wage differences. For example, the annual mean wage for legal occupations was approximately one-third, or $27,110, higher in private sector colleges, while average wages for architecture and engineering occupations were $10,830 (17 percent) higher in private sector colleges. Sales and related occupations had an annual mean wage of $37,640 in private sector colleges and $30,990 in State colleges, a difference of $6,650 or 21 percent.
Protective service was one of only two occupational groups for which wages were significantly higher in State colleges than in private colleges; the other was arts, design, entertainment, sports, and media occupations (not shown in the chart). Wage differences for six occupational groups, including business and financial operations occupations and healthcare practitioner and technical occupations, were not statistically significant.
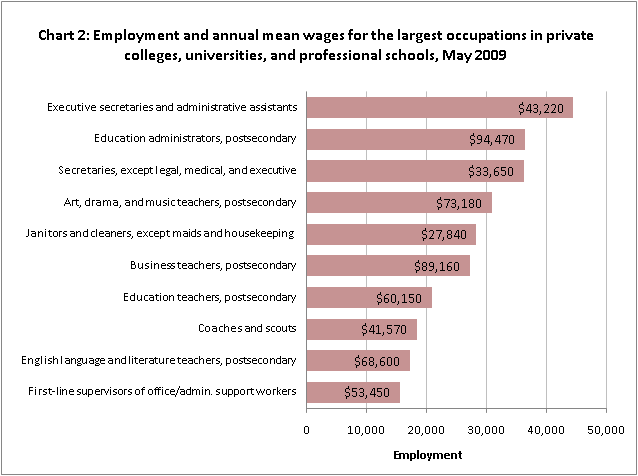
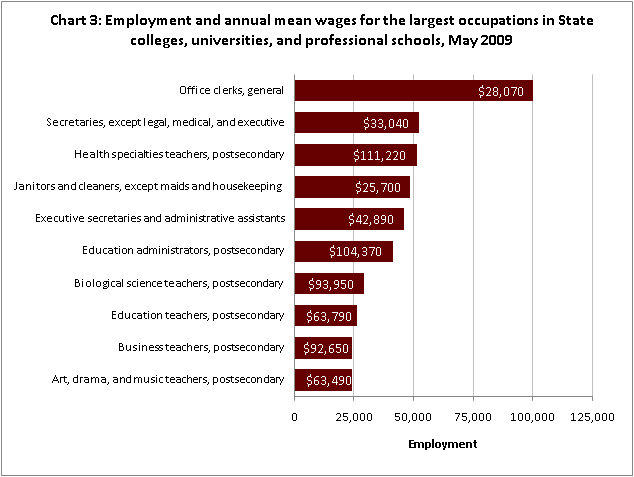
Most of the largest occupations in both private and State colleges were postsecondary teaching and office and administrative support jobs. The largest occupations in private and State colleges, excluding graduate assistants and residual (“all other”) occupations, are shown in charts 2 and 3. There is considerable overlap between the two charts: 7 of the 10 occupations are the same in both charts, including postsecondary education administrators; postsecondary art, drama, and music teachers; postsecondary business teachers, and postsecondary education teachers. Janitors; executive secretaries and administrative assistants; and secretaries, except legal, medical, and executive, were also among the largest occupations in both private and State colleges.
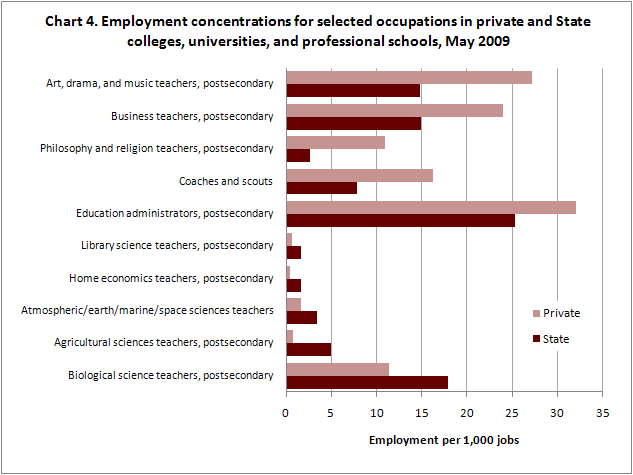
Employment concentrations for postsecondary education administrators, coaches and scouts, and selected postsecondary teaching occupations are shown in chart 4. Relative to total employment, both postsecondary education administrators and coaches and scouts were more prevalent in private colleges than in State colleges. Postsecondary education administrators represented 32 out of every 1,000 jobs in private sector colleges, compared with 25 out of every 1,000 jobs in State colleges. The employment share of coaches and scouts in private colleges was about double that in State colleges: coaches and scouts made up about 16 out of every 1,000 jobs in private colleges, but 8 out of every 1,000 jobs in State colleges. This large difference in employment shares is reflected in the employment estimates for coaches and scouts. Although private sector colleges had lower overall employment than State colleges, they employed a larger number of coaches and scouts—18,430 compared with 12,850.
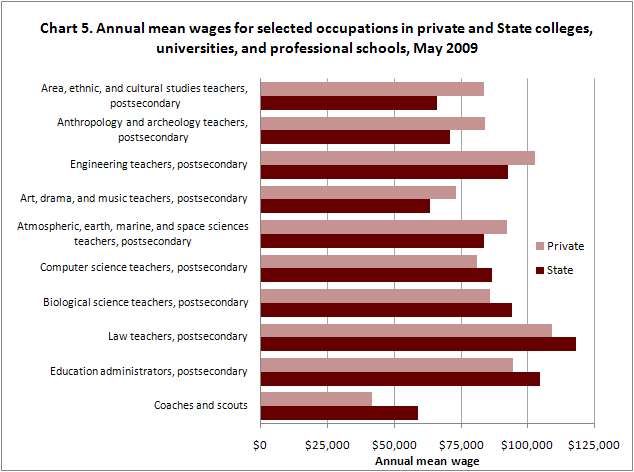
Wages tell a different story: State colleges had higher pay for both postsecondary education administrators and coaches and scouts. (Chart 5.) Postsecondary education administrators earned an average of $94,470 per year in private colleges, but $104,370—nearly $10,000 more—in State colleges. The wage difference for coaches and scouts was even greater. They earned an average of $41,570 annually in private colleges, compared with $58,810 in State colleges.
Postsecondary teaching occupations with high employment in private colleges also tended to have high employment in State colleges. For example, geography teachers and forestry and conservation science teachers were among the smallest postsecondary teaching occupations in both private and State colleges, while art, drama, and music; education; and business were among the largest postsecondary teaching specialties in both types of colleges.
However, measured in terms of employment per 1,000 jobs, many postsecondary teaching occupations tended to be more common in one type of college or the other. Some of the postsecondary teaching occupations with the largest differences in employment concentrations are shown in chart 4. For example, although art, drama, and music teachers were one of the largest postsecondary teaching occupations in both private and State colleges, they were significantly more prevalent in private colleges, making up 27 out of every 1,000 jobs in private colleges compared with 15 out of every 1,000 jobs in State colleges. The employment share of philosophy and religion teachers was more than 4 times as high in private colleges as in State colleges: 11 jobs per 1,000 compared with 2.6. On the other hand, State colleges had approximately 4 times as many postsecondary home economics teachers per 1,000 jobs as private colleges did, and 8 times as many agricultural sciences teachers per 1,000 jobs.
In general, postsecondary teaching occupations related to the social sciences; law and criminal justice; and the arts, communications, and humanities tended to have higher employment concentrations in private colleges; postsecondary teaching occupations that were more concentrated in State colleges were generally related to the physical or biological sciences, in addition to library science and home economics teachers. As well as the occupations shown in chart 4, postsecondary teaching occupations with higher employment shares in private colleges included psychology teachers, history teachers, and English language and literature teachers, while forestry and conservation science teachers and physics teachers made up a higher share of employment in State colleges.
Average wages for postsecondary teaching occupations varied widely by specialty, with the highest-paying occupations having annual mean wages of $90,000 or more, compared with $65,000 or less for the lowest-paying occupations. Like employment concentrations, wages for postsecondary teaching occupations tended to be highly correlated between private and State colleges. Among the highest-paying teaching occupations in both types of colleges were health specialties, law, engineering, and economics. Similarly, vocational education, recreation and fitness studies, education, and library science were some of the lowest-paying teaching specialties in both private and State colleges.
Despite the overall similarity of private and State college wages for postsecondary teaching occupations, large wage differences existed in some specialties, including those shown in chart 5. Postsecondary area, ethnic, and cultural studies teachers were not only more prevalent in private colleges, but also higher paid: the annual mean wage for this occupation was $83,730 in private colleges, nearly $18,000 more than in State colleges. Anthropology and archeology teachers earned an average of $12,930 more per year in private colleges, and annual mean wages for both engineering teachers and art, drama, and music teachers were about $10,000 higher in private colleges.
Though State colleges had lower average wages for the education, training, and library occupations as a group, this was not the case for every individual postsecondary teaching occupation. For example, postsecondary law teachers earned about $9,150 more on average in State colleges than in private ones. Computer science and biological science teachers were among the several other postsecondary teaching occupations for which State colleges paid higher wages.
OES data by ownership, including cross-industry data for the private sector and data by ownership for schools and hospitals, are available on the OES ownership data page. Complete May 2009 OES data are available from the OES home page. This highlight was prepared by Audrey Watson. For more information, please contact the OES program.
1Colleges, universities, and professional schools owned by local governments made up the remaining 1 percent of employment and are not discussed in this highlight. This industry includes schools that primarily grant bachelor’s and graduate degrees, and does not include other types of postsecondary institutions, such as junior colleges or technical and trade schools.
Last Modified Date: February 7, 2017