An official website of the United States government
 United States Department of Labor
September 2009
Americans rely daily on food services and drinking places for everything from a quick coffee break to social interactions and celebrations. All of this activity requires the services of many workers. In May 2008 this industry had over 9.6 million jobs (about 7 percent of national employment), making it the third largest industry in the country.

Click here to see these data in table format.
Although these establishments are ubiquitous in the American lifestyle, they are also low paying. Food services and drinking places pay average wages that are roughly half the national mean wage: the mean hourly wage for workers in this industry was $9.84 in May 2008, compared to the national mean hourly wage of $20.32.
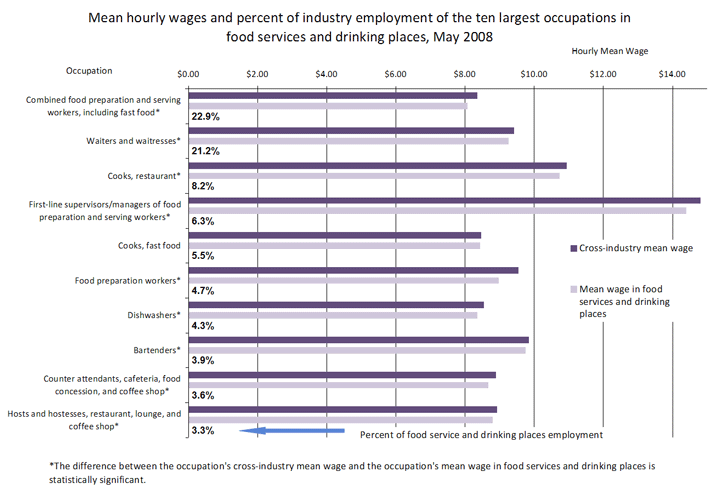
The industry’s low average wage is due to two factors: below-average wage rates for individual occupations, and the industry’s occupational mix. Workers in food services and drinking places can expect slightly lower mean wages than workers in the same occupation in other industries. For example, the ten largest occupations had mean wages between about 0.5 and 6.0 percent lower in this industry than in other industries, as illustrated in the chart above. This pattern also occurred among most occupations, including relatively higher paying occupations such as management.
However, the main reason for the low overall industry mean wage was the predominance of low paying and low skilled occupations within this industry: about 97 percent of industry employment was in occupations with mean wages below the national mean wage. The largest occupation in this industry, combined food preparation and serving workers, including fast food, made up 23 percent of industry employment and had a mean hourly wage of $8.07, while the second largest occupation, waiters and waitresses, with 21 percent of industry employment, had a mean hourly wage of $9.26, including tips. The higher paying occupations in this industry were mainly management occupations, such as food service managers and general and operations managers. Higher paying nonmanagement occupations had much lower employment. For example, dietitians and nutritionists had an hourly mean wage of $22.59 but had employment of 3,750, or about .04 percent of industry employment, and sales representatives, services, all other had an hourly mean wage of $27.42 but had employment of 2,950, or about .03 percent of industry employment. In general, these higher paying occupations required more formal training or experience than the majority of jobs in this industry.
The food services and drinking places industries comprise full-service restaurants, limited-service eating places, special food services, and drinking places (alcoholic beverages). In terms of employment, full-service restaurants was the largest of these four industries, making up 48 percent of total food services and drinking places employment, while limited-services eating places made up about 43 percent, special food services about 6 percent, and drinking places (alcoholic beverages) about 4 percent. In terms of overall mean wages, all four industries were below the national average, but there were marked pay differences between them. Limited-service eating places had the lowest mean wage ($9.06), while special food services had the highest mean wage ($12.10), in part because individual occupations tended to have the highest mean wages in this industry. The other two industries, drinking places and full-service restaurants, had overall mean wages of $10.08 and $10.26, respectively. Mean wages of the same occupation varied among the four food services and drinking places industries, but the trend was for occupational wages to be lowest in limited-service eating places. For example, fast food cooks earned the highest mean wage ($9.56) in special food services and the lowest mean wage ($8.37) in limited-service eating places.
While the food services and drinking places industry made up 7 percent of national employment, its occupational composition was not very diverse, as seen in Table 1. This industry employed some of the largest and lowest paying occupations in the U.S., including combined food preparation and serving workers, including fast food; waiters and waitresses; and food preparation workers, all shown in Table 1. Due to the higher replacement needs of jobs like these, and due to industry employment growth, job opportunities within the industry are projected to be very good for the period 2006-16, according to the Bureau of Labor Statistics’ Career Guide to Industries.
Complete OES data, including data for over 450 industries and industry aggregations, are available from the OES home page. This highlight was prepared by Rebecca Keller; for more information, please contact the OES program.
Last Modified Date: February 7, 2017