An official website of the United States government
An official website of the United States government
The .gov means it's official.
Federal government websites often end in .gov or .mil. Before sharing sensitive information,
make sure you're on a federal government site.
The site is secure.
The
https:// ensures that you are connecting to the official website and that any
information you provide is encrypted and transmitted securely.
U.S. nonfarm payroll employment continued to grow steadily in 2014, adding 3.1 million jobs, according to the Current Employment Statistics (CES) survey. This article uses CES data to discuss how private and public industry employment, hours, and earnings changed over the year. Job gains in 2014 were widespread across industries, with all broad industry groups experiencing employment increases. Employment growth was concentrated in the service-providing sector and led by industries that have been adding jobs for some time. However, even goods-producing industries saw an uptick in employment growth over the year.
| Date | Total nonfarm employment | Total private employment |
|---|---|---|
| Jan 2004 | 130,746 | 109,208 |
| Feb 2004 | 130,792 | 109,242 |
| Mar 2004 | 131,123 | 109,535 |
| Apr 2004 | 131,371 | 109,757 |
| May 2004 | 131,679 | 110,065 |
| Jun 2004 | 131,753 | 110,152 |
| Jul 2004 | 131,786 | 110,180 |
| Aug 2004 | 131,918 | 110,292 |
| Sep 2004 | 132,080 | 110,445 |
| Oct 2004 | 132,425 | 110,769 |
| Nov 2004 | 132,489 | 110,797 |
| Dec 2004 | 132,618 | 110,925 |
| Jan 2005 | 132,752 | 111,017 |
| Feb 2005 | 132,991 | 111,247 |
| Mar 2005 | 133,126 | 111,386 |
| Apr 2005 | 133,489 | 111,735 |
| May 2005 | 133,665 | 111,884 |
| Jun 2005 | 133,908 | 112,145 |
| Jul 2005 | 134,283 | 112,426 |
| Aug 2005 | 134,479 | 112,616 |
| Sep 2005 | 134,545 | 112,700 |
| Oct 2005 | 134,629 | 112,800 |
| Nov 2005 | 134,966 | 113,107 |
| Dec 2005 | 135,124 | 113,245 |
| Jan 2006 | 135,401 | 113,554 |
| Feb 2006 | 135,716 | 113,838 |
| Mar 2006 | 135,997 | 114,094 |
| Apr 2006 | 136,179 | 114,260 |
| May 2006 | 136,203 | 114,277 |
| Jun 2006 | 136,280 | 114,358 |
| Jul 2006 | 136,486 | 114,513 |
| Aug 2006 | 136,671 | 114,660 |
| Sep 2006 | 136,827 | 114,745 |
| Oct 2006 | 136,830 | 114,762 |
| Nov 2006 | 137,039 | 114,956 |
| Dec 2006 | 137,211 | 115,123 |
| Jan 2007 | 137,448 | 115,353 |
| Feb 2007 | 137,536 | 115,405 |
| Mar 2007 | 137,724 | 115,575 |
| Apr 2007 | 137,802 | 115,627 |
| May 2007 | 137,947 | 115,754 |
| Jun 2007 | 138,018 | 115,811 |
| Jul 2007 | 137,984 | 115,813 |
| Aug 2007 | 137,967 | 115,741 |
| Sep 2007 | 138,053 | 115,774 |
| Oct 2007 | 138,136 | 115,839 |
| Nov 2007 | 138,253 | 115,919 |
| Dec 2007 | 138,350 | 115,974 |
| Jan 2008 | 138,365 | 115,977 |
| Feb 2008 | 138,278 | 115,861 |
| Mar 2008 | 138,199 | 115,756 |
| Apr 2008 | 137,986 | 115,536 |
| May 2008 | 137,803 | 115,320 |
| Jun 2008 | 137,631 | 115,114 |
| Jul 2008 | 137,421 | 114,853 |
| Aug 2008 | 137,162 | 114,595 |
| Sep 2008 | 136,710 | 114,173 |
| Oct 2008 | 136,234 | 113,685 |
| Nov 2008 | 135,469 | 112,909 |
| Dec 2008 | 134,773 | 112,217 |
| Jan 2009 | 133,977 | 111,398 |
| Feb 2009 | 133,274 | 110,698 |
| Mar 2009 | 132,450 | 109,890 |
| Apr 2009 | 131,766 | 109,089 |
| May 2009 | 131,411 | 108,794 |
| Jun 2009 | 130,944 | 108,368 |
| Jul 2009 | 130,619 | 108,098 |
| Aug 2009 | 130,402 | 107,865 |
| Sep 2009 | 130,175 | 107,724 |
| Oct 2009 | 129,974 | 107,450 |
| Nov 2009 | 129,968 | 107,435 |
| Dec 2009 | 129,685 | 107,203 |
| Jan 2010 | 129,717 | 107,226 |
| Feb 2010 | 129,649 | 107,173 |
| Mar 2010 | 129,810 | 107,292 |
| Apr 2010 | 130,057 | 107,488 |
| May 2010 | 130,575 | 107,579 |
| Jun 2010 | 130,445 | 107,705 |
| Jul 2010 | 130,381 | 107,812 |
| Aug 2010 | 130,342 | 107,922 |
| Sep 2010 | 130,293 | 108,046 |
| Oct 2010 | 130,541 | 108,244 |
| Nov 2010 | 130,662 | 108,375 |
| Dec 2010 | 130,751 | 108,485 |
| Jan 2011 | 130,826 | 108,562 |
| Feb 2011 | 130,993 | 108,780 |
| Mar 2011 | 131,199 | 109,005 |
| Apr 2011 | 131,520 | 109,335 |
| May 2011 | 131,623 | 109,495 |
| Jun 2011 | 131,808 | 109,681 |
| Jul 2011 | 131,925 | 109,871 |
| Aug 2011 | 132,053 | 110,008 |
| Sep 2011 | 132,276 | 110,295 |
| Oct 2011 | 132,459 | 110,461 |
| Nov 2011 | 132,605 | 110,635 |
| Dec 2011 | 132,831 | 110,881 |
| Jan 2012 | 133,211 | 111,262 |
| Feb 2012 | 133,458 | 111,511 |
| Mar 2012 | 133,674 | 111,729 |
| Apr 2012 | 133,761 | 111,839 |
| May 2012 | 133,874 | 111,961 |
| Jun 2012 | 133,909 | 112,017 |
| Jul 2012 | 134,086 | 112,171 |
| Aug 2012 | 134,274 | 112,331 |
| Sep 2012 | 134,418 | 112,495 |
| Oct 2012 | 134,631 | 112,735 |
| Nov 2012 | 134,795 | 112,921 |
| Dec 2012 | 135,088 | 113,196 |
| Jan 2013 | 135,293 | 113,416 |
| Feb 2013 | 135,607 | 113,713 |
| Mar 2013 | 135,722 | 113,852 |
| Apr 2013 | 135,909 | 114,046 |
| May 2013 | 136,128 | 114,271 |
| Jun 2013 | 136,255 | 114,443 |
| Jul 2013 | 136,419 | 114,605 |
| Aug 2013 | 136,675 | 114,818 |
| Sep 2013 | 136,825 | 114,986 |
| Oct 2013 | 137,050 | 115,221 |
| Nov 2013 | 137,367 | 115,524 |
| Dec 2013 | 137,476 | 115,648 |
| Jan 2014 | 137,642 | 115,831 |
| Feb 2014 | 137,830 | 116,006 |
| Mar 2014 | 138,055 | 116,229 |
| Apr 2014 | 138,385 | 116,542 |
| May 2014 | 138,621 | 116,780 |
| Jun 2014 | 138,907 | 117,052 |
| Jul 2014 | 139,156 | 117,295 |
| Aug 2014 | 139,369 | 117,504 |
| Sep 2014 | 139,619 | 117,739 |
| Oct 2014 | 139,840 | 117,957 |
| Nov 2014 | 140,263 | 118,371 |
| Dec 2014 | 140,592 | 118,690 |
| Source: U.S. Bureau of Labor Statistics, Current Employment Statistics survey. | ||
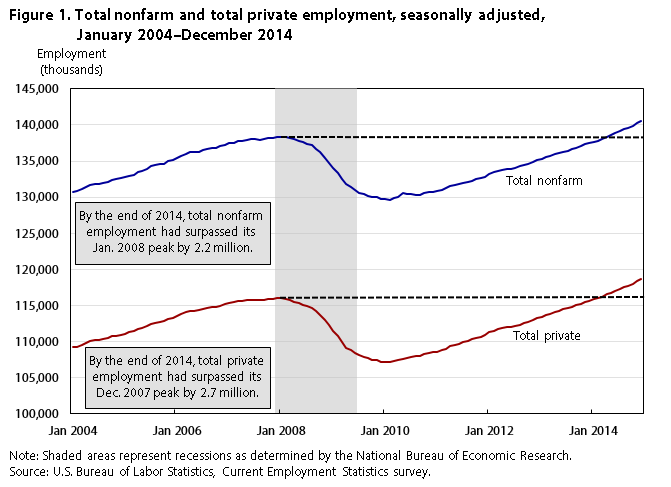
Nonfarm payroll employment in the United States continued to grow in 2014, according to data from the Current Employment Statistics (CES) survey.1 The economy added a total of 3.1 million jobs—the largest annual gain since 1999 and an average monthly employment increase of 260,000. Marking a milestone in 2014, both total private and total nonfarm employment recovered from the severe effects of the most recent (2007–2009) recession. (See figure 1.) Total private employment recovered in February 2014 and total nonfarm employment recovered 2 months later. (See figure 2.) Their recovery periods—74 months and 75 months, respectively—were the most protracted in the history of CES payroll employment. By the end of 2014, however, half of industry groups that suffered job losses during the most recent employment downturn had completely recovered from these losses and employment was expanding beyond the previous peak level. The other half, despite not recovering all jobs lost, did see job growth pick up in 2014.

| Industry | Percent recovered |
|---|---|
| Leisure and hospitality | Recovered as of January 2012; now at 324% |
| Mining and logging | Recovered as of June 2011; now at 208% |
| Professional and business services | Recovered as of October 2012; now at 183% |
| Transportation and warehousing | Recovered as of December 2013; now at 140% |
| Other services | Recovered as of March 2014; now at 132% |
| Total private | Recovered as of February 2014; now at 131% |
| Total nonfarm | Recovered as of April 2014; now at 126% |
| Retail trade | 94 |
| Wholesale trade | 72 |
| Financial activities | 52 |
| Construction | 37 |
| Manufacturing | 29 |
| Information | 26 |
| Government | 11 |
| Education and health services | Employment continued to grow during recession |
| Source: U.S. Bureau of Labor Statistics, Current Employment Statistics survey. | |
In addition to employment, several other CES data series tell a positive story for 2014. Average weekly hours of all employees increased by 0.3 hour (or 0.9 percent), to 34.6 hours, marking the largest annual percent gain in hours since 2010. For all employees, the over-the-year growth in average hourly earnings was $0.44, about the same as in 2013. However, coupled with the increase in weekly hours, this gain resulted in average weekly earnings of $851.85, a gain of $22.48, or 2.7 percent. This percent increase is the largest annual increase since 2010. Real, or inflation-adjusted, average weekly earnings of all employees rose by 2.0 percent, the largest 12-month gain in weekly earnings since 2008. This gain indicates that although earnings increases may not be especially large, they are outpacing inflation.
Finally, the 12-month diffusion index of employment change shows that employment growth was spread broadly across component industries. This index, in which a value above 50 indicates a greater number of job-gaining than job-losing industries over 12 months, remained above 70.0 throughout 2014 and ended the year at 77.9, the highest level since 1997. Employment changes in recovered industries, in recovering industries, and in education and health services (in which employment grew throughout the most recent recession) are discussed in detail below. (See figure 2.)
Job growth in leisure and hospitality continued to be robust in 2014. This industry, which experienced a relatively shallow and brief recessionary job loss, had recovered by January 2012 and had added more than triple the number of jobs lost by the end of 2014. Over the year, the industry added 482,000 workers to payrolls, only slightly less than the 485,000 workers added in 2013. As in previous years, growth was concentrated in the food services and drinking places industry, which added 401,000 jobs in 2014.
The main contributor to employment gains within food services and drinking places was the restaurants and other eating places industry.2 Within this industry, both full-service and limited-service restaurants continued to show strength, adding 164,000 and 145,000 jobs, respectively, in 2014. Employment in food services and drinking places ended the year 13 percent above its most recent (December 2007) peak. In December 2014, this industry accounted for 73 percent of employment within leisure and hospitality.
| Date | Leisure and hospitality employment (in thousands) | Consumer Confidence Index (1985 = 100) |
|---|---|---|
| Jan 2000 | 11,713 | 144.7 |
| Feb 2000 | 11,719 | 140.8 |
| Mar 2000 | 11,788 | 137.1 |
| Apr 2000 | 11,834 | 137.7 |
| May 2000 | 11,827 | 144.7 |
| Jun 2000 | 11,869 | 139.2 |
| Jul 2000 | 11,900 | 143.0 |
| Aug 2000 | 11,927 | 140.8 |
| Sep 2000 | 11,940 | 142.5 |
| Oct 2000 | 11,876 | 135.8 |
| Nov 2000 | 11,946 | 132.6 |
| Dec 2000 | 11,976 | 128.6 |
| Jan 2001 | 11,977 | 115.7 |
| Feb 2001 | 11,997 | 109.2 |
| Mar 2001 | 12,000 | 116.9 |
| Apr 2001 | 12,040 | 109.9 |
| May 2001 | 12,068 | 116.1 |
| Jun 2001 | 12,076 | 118.9 |
| Jul 2001 | 12,110 | 116.3 |
| Aug 2001 | 12,093 | 114.0 |
| Sep 2001 | 12,061 | 97.0 |
| Oct 2001 | 12,015 | 85.3 |
| Nov 2001 | 11,985 | 84.9 |
| Dec 2001 | 11,967 | 94.6 |
| Jan 2002 | 12,006 | 97.8 |
| Feb 2002 | 11,962 | 95.0 |
| Mar 2002 | 11,965 | 110.7 |
| Apr 2002 | 11,928 | 108.5 |
| May 2002 | 11,936 | 110.3 |
| Jun 2002 | 11,905 | 106.3 |
| Jul 2002 | 11,912 | 97.4 |
| Aug 2002 | 11,936 | 94.5 |
| Sep 2002 | 11,991 | 93.7 |
| Oct 2002 | 12,070 | 79.6 |
| Nov 2002 | 12,109 | 84.9 |
| Dec 2002 | 12,112 | 80.7 |
| Jan 2003 | 12,173 | 78.8 |
| Feb 2003 | 12,130 | 64.8 |
| Mar 2003 | 12,109 | 61.4 |
| Apr 2003 | 12,085 | 81.0 |
| May 2003 | 12,092 | 83.6 |
| Jun 2003 | 12,121 | 83.5 |
| Jul 2003 | 12,143 | 77.0 |
| Aug 2003 | 12,177 | 81.7 |
| Sep 2003 | 12,208 | 77.0 |
| Oct 2003 | 12,259 | 81.7 |
| Nov 2003 | 12,284 | 92.5 |
| Dec 2003 | 12,320 | 94.8 |
| Jan 2004 | 12,346 | 97.7 |
| Feb 2004 | 12,372 | 88.5 |
| Mar 2004 | 12,425 | 88.5 |
| Apr 2004 | 12,435 | 93.0 |
| May 2004 | 12,481 | 93.1 |
| Jun 2004 | 12,495 | 102.8 |
| Jul 2004 | 12,495 | 105.7 |
| Aug 2004 | 12,485 | 98.7 |
| Sep 2004 | 12,550 | 96.7 |
| Oct 2004 | 12,582 | 92.9 |
| Nov 2004 | 12,606 | 92.6 |
| Dec 2004 | 12,630 | 102.7 |
| Jan 2005 | 12,665 | 105.1 |
| Feb 2005 | 12,690 | 104.4 |
| Mar 2005 | 12,718 | 103.0 |
| Apr 2005 | 12,802 | 97.5 |
| May 2005 | 12,797 | 103.1 |
| Jun 2005 | 12,837 | 106.2 |
| Jul 2005 | 12,867 | 103.6 |
| Aug 2005 | 12,891 | 105.5 |
| Sep 2005 | 12,862 | 87.5 |
| Oct 2005 | 12,840 | 85.2 |
| Nov 2005 | 12,884 | 98.3 |
| Dec 2005 | 12,905 | 103.8 |
| Jan 2006 | 12,945 | 106.8 |
| Feb 2006 | 12,980 | 102.7 |
| Mar 2006 | 13,034 | 107.5 |
| Apr 2006 | 13,074 | 109.8 |
| May 2006 | 13,052 | 104.7 |
| Jun 2006 | 13,061 | 105.4 |
| Jul 2006 | 13,130 | 107.0 |
| Aug 2006 | 13,152 | 100.2 |
| Sep 2006 | 13,150 | 105.9 |
| Oct 2006 | 13,187 | 105.1 |
| Nov 2006 | 13,251 | 105.3 |
| Dec 2006 | 13,292 | 110.0 |
| Jan 2007 | 13,338 | 110.3 |
| Feb 2007 | 13,361 | 111.2 |
| Mar 2007 | 13,363 | 108.2 |
| Apr 2007 | 13,375 | 106.3 |
| May 2007 | 13,404 | 108.5 |
| Jun 2007 | 13,413 | 105.3 |
| Jul 2007 | 13,417 | 111.9 |
| Aug 2007 | 13,419 | 105.6 |
| Sep 2007 | 13,461 | 99.5 |
| Oct 2007 | 13,499 | 95.2 |
| Nov 2007 | 13,535 | 87.8 |
| Dec 2007 | 13,550 | 90.6 |
| Jan 2008 | 13,542 | 87.3 |
| Feb 2008 | 13,543 | 76.4 |
| Mar 2008 | 13,531 | 65.9 |
| Apr 2008 | 13,511 | 62.8 |
| May 2008 | 13,498 | 58.1 |
| Jun 2008 | 13,482 | 51.0 |
| Jul 2008 | 13,463 | 51.9 |
| Aug 2008 | 13,431 | 58.5 |
| Sep 2008 | 13,379 | 61.4 |
| Oct 2008 | 13,352 | 38.8 |
| Nov 2008 | 13,300 | 44.7 |
| Dec 2008 | 13,256 | 38.6 |
| Jan 2009 | 13,222 | 37.4 |
| Feb 2009 | 13,193 | 25.3 |
| Mar 2009 | 13,127 | 26.9 |
| Apr 2009 | 13,056 | 40.8 |
| May 2009 | 13,106 | 54.8 |
| Jun 2009 | 13,076 | 49.3 |
| Jul 2009 | 13,078 | 47.4 |
| Aug 2009 | 13,046 | 54.5 |
| Sep 2009 | 13,054 | 53.4 |
| Oct 2009 | 12,995 | 48.7 |
| Nov 2009 | 12,986 | 50.6 |
| Dec 2009 | 12,944 | 52.9 |
| Jan 2010 | 12,932 | 55.9 |
| Feb 2010 | 12,927 | 46.4 |
| Mar 2010 | 12,943 | 52.3 |
| Apr 2010 | 12,979 | 57.7 |
| May 2010 | 13,012 | 62.7 |
| Jun 2010 | 13,034 | 54.3 |
| Jul 2010 | 13,048 | 51.0 |
| Aug 2010 | 13,081 | 53.2 |
| Sep 2010 | 13,137 | 48.6 |
| Oct 2010 | 13,127 | 49.9 |
| Nov 2010 | 13,126 | 54.3 |
| Dec 2010 | 13,157 | 53.3 |
| Jan 2011 | 13,154 | 64.8 |
| Feb 2011 | 13,192 | 72.0 |
| Mar 2011 | 13,243 | 63.8 |
| Apr 2011 | 13,285 | 66.0 |
| May 2011 | 13,294 | 61.7 |
| Jun 2011 | 13,341 | 57.6 |
| Jul 2011 | 13,377 | 59.5 |
| Aug 2011 | 13,391 | 45.2 |
| Sep 2011 | 13,422 | 46.4 |
| Oct 2011 | 13,462 | 40.9 |
| Nov 2011 | 13,505 | 55.2 |
| Dec 2011 | 13,541 | 64.5 |
| Jan 2012 | 13,601 | 61.5 |
| Feb 2012 | 13,642 | 71.6 |
| Mar 2012 | 13,701 | 69.5 |
| Apr 2012 | 13,705 | 68.7 |
| May 2012 | 13,706 | 64.4 |
| Jun 2012 | 13,710 | 62.7 |
| Jul 2012 | 13,747 | 65.4 |
| Aug 2012 | 13,815 | 61.3 |
| Sep 2012 | 13,874 | 68.4 |
| Oct 2012 | 13,885 | 73.1 |
| Nov 2012 | 13,911 | 71.5 |
| Dec 2012 | 13,981 | 66.7 |
| Jan 2013 | 14,035 | 58.4 |
| Feb 2013 | 14,085 | 68.0 |
| Mar 2013 | 14,115 | 61.9 |
| Apr 2013 | 14,153 | 69.0 |
| May 2013 | 14,196 | 74.3 |
| Jun 2013 | 14,253 | 82.1 |
| Jul 2013 | 14,293 | 81.0 |
| Aug 2013 | 14,332 | 81.8 |
| Sep 2013 | 14,342 | 80.2 |
| Oct 2013 | 14,395 | 72.4 |
| Nov 2013 | 14,442 | 72.0 |
| Dec 2013 | 14,466 | 77.5 |
| Jan 2014 | 14,494 | 79.4 |
| Feb 2014 | 14,526 | 78.3 |
| Mar 2014 | 14,565 | 83.9 |
| Apr 2014 | 14,610 | 81.7 |
| May 2014 | 14,667 | 82.2 |
| Jun 2014 | 14,698 | 86.4 |
| Jul 2014 | 14,721 | 90.3 |
| Aug 2014 | 14,746 | 93.4 |
| Sep 2014 | 14,795 | 89.0 |
| Oct 2014 | 14,850 | 94.1 |
| Nov 2014 | 14,892 | 91.0 |
| Dec 2014 | 14,948 | 93.1 |
| Source: U.S. Bureau of Labor Statistics, Current Employment Statistics survey; and The Conference Board. | ||
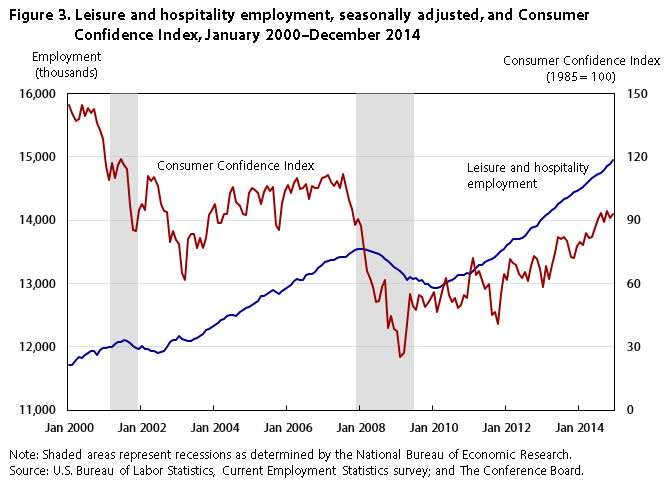
The leisure and hospitality industry is largely dependent on families’ disposable income, and it is among the first to benefit or suffer from changes in that income.3 This industry has continued to show strength on the backdrop of recent consumer optimism about the nation’s economic outlook. The Consumer Confidence Index,4 a measure and economic indicator of consumer confidence, can be volatile, but has remained on an upward trend since mid-2009 (see figure 3). With the recent decline in gas prices, consumers have had more disposable income, a change that has most likely contributed to increases seen in same-store traffic and in food sales.5 Despite fluctuations in the Consumer Confidence Index, employment within leisure and hospitality has continued its trend of growth, with food services and drinking places employment paving the way.
Mining and logging has also seen a period of sustained job expansion since June 2011. By the end of 2014, the industry had added more than double the jobs lost during the recession. Over the year, employment grew by 42,000, an annual increase of 4.8 percent, well above the increases experienced in 2012 (2.4 percent) and in 2013 (2.2 percent). Employment growth in 2014 was concentrated in the oil and gas components of mining, with the largest gain occurring in support activities for oil and gas operations, which added 27,000 jobs over the year. Job growth in oil and gas industries is likely due to increased U.S. oil and gas production. Improved extraction technologies, such as horizontal drilling and hydraulic fracturing (a process in which pressurized fluid is forced into shale rock to free up oil or gas), have enabled the exploitation of difficult-to-extract deposits and allowed the United States to become a net petroleum exporter for the first time in decades.6 Employment in oil and gas industries has remained resilient even in the face of petroleum price declines in the second half of 2014.7
Nevertheless, in both oil and gas extraction and in support activities for oil and gas operations, job growth did slow somewhat in the last quarter of 2014. This slowdown perhaps reflects the fact that the newer techniques of domestic production are more costly than those used elsewhere in the world.8 The difference in cost suggests that, in many cases, break-even prices are higher for domestic than for foreign producers. As cheap oil flooded the global market in the last half of 2014, domestic producers began to curtail operations, a curtailment that led to slower employment growth in some cases and layoffs in others.9
The largest employment gain in 2014 came in the professional and business services industry, in which employment has been expanding for over 2 years. In 2014, the industry added 704,000 jobs—almost double the number of jobs lost in the 2007–2009 employment downturn—and, at the end of the year, was 8 percent above its most recent (December 2007) employment peak. Gains were about evenly split between professional and technical services (+299,000) and administrative and waste services (+350,000), the two largest broad component industries.
Employment gains in 2014 were widespread within professional and technical services, with computer systems design and related services adding the most workers over the year (+79,000). Establishments within this industry group provide expertise in information technology, both by catering to the software needs of clients and by planning or managing computer systems. Driven by the increased use and prevalence of information technology, employment in this industry has grown by well over 400 percent since 1990. Job gains in 2014 occurred primarily in computer systems design services (+40,000) and in custom computer programming services (+32,000).
Management and technical consulting services, another professional and technical services industry in which employment has more than quadrupled since 1990, added 74,000 workers to payrolls in 2014. Workers in this industry group are involved in providing a broad range of expert services to businesses and governments. As enterprises have become more complex, they have looked outside the organization for fresh perspectives and expertise not available internally.10 This practice has led to sustained job growth in management and technical consulting. Among the components of this industry, management consulting services saw the largest gain in 2014, adding 51,000 jobs.
Within administrative and waste services, the largest job gains came in employment services’ temporary help services component, which added 174,000 jobs in 2014. This component, which supplies temporary workers to firms, is often seen as an indicator of future economic growth. It tends to lead business cycle turning points, because firms dismiss temporary workers before permanent employees during downturns and hire temporary workers during early expansions, when economic improvement and demand are still tentative. For example, in 2010, when the U.S. economy was just emerging from recession, temporary help employment grew by just under 19 percent. Since then, however, annual growth has slowed to around 6 percent, perhaps indicating greater certainty about economic conditions.
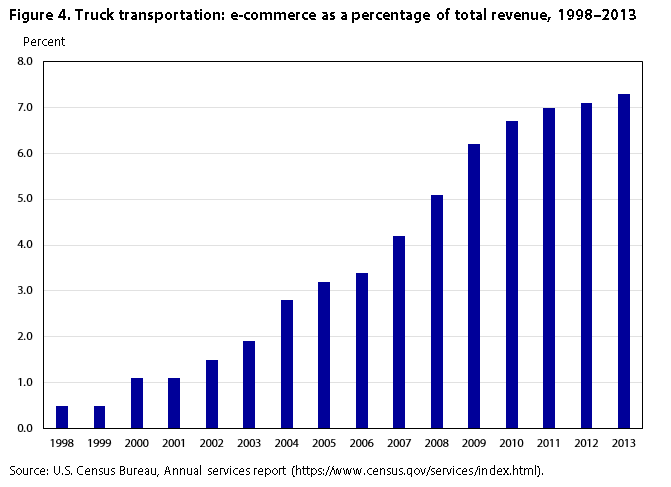
Transportation and warehousing recovered from its most recent employment downturn in January 2014, and by the end of the year was 3.9 percent above its most recent employment peak, reached in April 2008. This industry added 166,000 jobs in 2014, with the largest gains coming from truck transportation, which added 47,000 jobs, and from couriers and messengers, which added 45,000 jobs. Both of these industries are extremely sensitive to the business cycle, with changing economic activity leading to a change in demand for their services.11
| Year | Percentage of trucking revenues from e-commerce |
|---|---|
| 1998 | 0.5 |
| 1999 | .5 |
| 2000 | 1.1 |
| 2001 | 1.1 |
| 2002 | 1.5 |
| 2003 | 1.9 |
| 2004 | 2.8 |
| 2005 | 3.2 |
| 2006 | 3.4 |
| 2007 | 4.2 |
| 2008 | 5.1 |
| 2009 | 6.2 |
| 2010 | 6.7 |
| 2011 | 7.0 |
| 2012 | 7.1 |
| 2013 | 7.3 |
| Source: U.S. Census Bureau, Annual services report (https://www.census.gov/services/index.html). | |
The evidence suggests that growth in e-commerce may have helped job growth in both truck transportation and couriers and messengers. Although the share of e-commerce in total revenue for these component industries was less than 1 percent in 1998, it had quickly grown to over 7 percent by 2013. As one illustration, figure 4 shows the increasing, albeit still small, percentage of trucking revenues from e-commerce.
In 2014, employment in other services also recovered from its recent losses. By the end of the year, it had exceeded its April 2008 peak by 71,000. Job gains in other services in 2014 were concentrated in personal and laundry services.
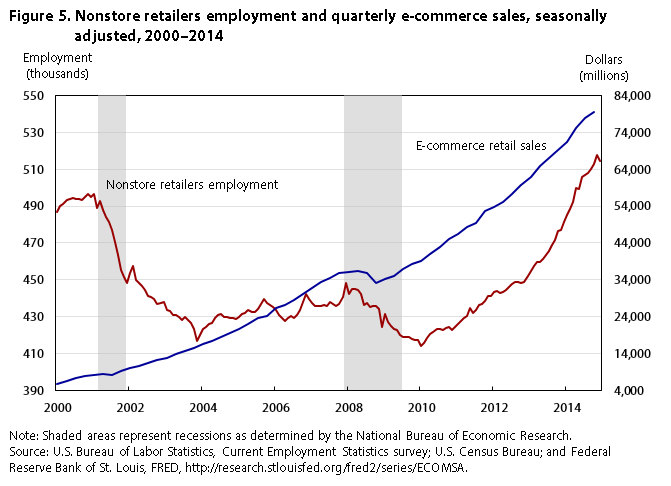
By the end of 2014, retail trade had recovered 94 percent of the jobs lost during its most recent employment downturn. Job gains in 2014 totaled 224,000. This total is well below retail trade’s employment gain experienced in 2013, as most component industries saw weaker growth in 2014. The largest employment gain occurred in motor vehicle and parts dealers (+67,000), and about two-thirds of that increase (+46,000) came from automobile dealers. Buoyed by a combination of low interest rates and an improving economy, motor vehicle sales have been improving steadily since 2009.12 Food and beverage stores also experienced strong job growth (+53,000) over the year, with that growth being concentrated in supermarket and other grocery stores, which added 41,000 jobs. Employment also rose in general merchandise stores (+46,000), with a gain in other general merchandise stores (+57,000) more than offsetting a small loss in department stores. Nonstore retailers,13 a retail component industry that has been growing steadily for several years, actually exceeded its 2013 performance, adding 34,000 jobs in 2014. The gain in this industry was concentrated in electronic shopping and electronic auctions, which added 26,000 workers in 2014. As shown in figure 5, since 2009, employment in nonstore retailers has paralleled e-commerce retail sales.
| Date | Nonstore retailers employment (in thousands) | E-commerce sales (dollars, in millions) |
|---|---|---|
| Jan 2000 | 486.8 | 5,806 |
| Feb 2000 | 489.9 | – |
| Mar 2000 | 491.4 | – |
| Apr 2000 | 493.1 | 6,489 |
| May 2000 | 493.7 | – |
| Jun 2000 | 494.3 | – |
| Jul 2000 | 493.8 | 7,331 |
| Aug 2000 | 493.9 | – |
| Sep 2000 | 493.3 | – |
| Oct 2000 | 495.0 | 7,765 |
| Nov 2000 | 496.8 | – |
| Dec 2000 | 495.2 | – |
| Jan 2001 | 496.6 | 8,209 |
| Feb 2001 | 489.0 | – |
| Mar 2001 | 492.9 | – |
| Apr 2001 | 487.7 | 8,340 |
| May 2001 | 484.2 | – |
| Jun 2001 | 481.2 | – |
| Jul 2001 | 477.3 | 8,267 |
| Aug 2001 | 470.3 | – |
| Sep 2001 | 463.5 | – |
| Oct 2001 | 455.4 | 9,283 |
| Nov 2001 | 451.4 | – |
| Dec 2001 | 448.2 | – |
| Jan 2002 | 453.5 | 9,982 |
| Feb 2002 | 457.5 | – |
| Mar 2002 | 450.1 | – |
| Apr 2002 | 448.4 | 10,724 |
| May 2002 | 446.8 | – |
| Jun 2002 | 444.2 | – |
| Jul 2002 | 441.1 | 11,456 |
| Aug 2002 | 440.8 | – |
| Sep 2002 | 439.7 | – |
| Oct 2002 | 436.9 | 12,203 |
| Nov 2002 | 437.3 | – |
| Dec 2002 | 438.0 | – |
| Jan 2003 | 433.7 | 12,763 |
| Feb 2003 | 432.9 | – |
| Mar 2003 | 431.0 | – |
| Apr 2003 | 430.7 | 13,739 |
| May 2003 | 429.6 | – |
| Jun 2003 | 428.3 | – |
| Jul 2003 | 429.9 | 14,738 |
| Aug 2003 | 428.1 | – |
| Sep 2003 | 426.4 | – |
| Oct 2003 | 423.5 | 15,536 |
| Nov 2003 | 416.8 | – |
| Dec 2003 | 420.0 | – |
| Jan 2004 | 423.1 | 16,664 |
| Feb 2004 | 424.3 | – |
| Mar 2004 | 426.0 | – |
| Apr 2004 | 426.5 | 17,454 |
| May 2004 | 429.1 | – |
| Jun 2004 | 431.1 | – |
| Jul 2004 | 431.6 | 18,404 |
| Aug 2004 | 429.9 | – |
| Sep 2004 | 430.0 | – |
| Oct 2004 | 429.5 | 19,588 |
| Nov 2004 | 429.1 | – |
| Dec 2004 | 428.8 | – |
| Jan 2005 | 429.9 | 20,742 |
| Feb 2005 | 431.6 | – |
| Mar 2005 | 432.1 | – |
| Apr 2005 | 433.4 | 22,137 |
| May 2005 | 432.4 | – |
| Jun 2005 | 432.5 | – |
| Jul 2005 | 434.3 | 23,540 |
| Aug 2005 | 437.1 | – |
| Sep 2005 | 439.4 | – |
| Oct 2005 | 437.5 | 24,292 |
| Nov 2005 | 436.2 | – |
| Dec 2005 | 435.3 | – |
| Jan 2006 | 433.8 | 26,388 |
| Feb 2006 | 431.1 | – |
| Mar 2006 | 429.3 | – |
| Apr 2006 | 427.8 | 27,264 |
| May 2006 | 429.0 | – |
| Jun 2006 | 430.2 | – |
| Jul 2006 | 429.5 | 28,649 |
| Aug 2006 | 430.9 | – |
| Sep 2006 | 433.5 | – |
| Oct 2006 | 438.1 | 30,148 |
| Nov 2006 | 442.1 | – |
| Dec 2006 | 439.4 | – |
| Jan 2007 | 437.3 | 31,695 |
| Feb 2007 | 435.6 | – |
| Mar 2007 | 436.0 | – |
| Apr 2007 | 435.7 | 33,345 |
| May 2007 | 436.1 | – |
| Jun 2007 | 435.8 | – |
| Jul 2007 | 437.8 | 34,539 |
| Aug 2007 | 437.0 | – |
| Sep 2007 | 436.0 | – |
| Oct 2007 | 436.8 | 35,888 |
| Nov 2007 | 440.9 | – |
| Dec 2007 | 448.1 | – |
| Jan 2008 | 442.4 | 36,011 |
| Feb 2008 | 445.1 | – |
| Mar 2008 | 445.0 | – |
| Apr 2008 | 444.7 | 36,322 |
| May 2008 | 442.3 | – |
| Jun 2008 | 436.1 | – |
| Jul 2008 | 437.5 | 35,874 |
| Aug 2008 | 435.5 | – |
| Sep 2008 | 436.0 | – |
| Oct 2008 | 435.9 | 33,188 |
| Nov 2008 | 434.4 | – |
| Dec 2008 | 424.3 | – |
| Jan 2009 | 431.2 | 34,103 |
| Feb 2009 | 427.0 | – |
| Mar 2009 | 424.9 | – |
| Apr 2009 | 423.3 | 35,043 |
| May 2009 | 422.9 | – |
| Jun 2009 | 420.0 | – |
| Jul 2009 | 419.2 | 36,951 |
| Aug 2009 | 418.7 | – |
| Sep 2009 | 418.7 | – |
| Oct 2009 | 418.0 | 38,155 |
| Nov 2009 | 417.4 | – |
| Dec 2009 | 417.2 | – |
| Jan 2010 | 413.8 | 39,147 |
| Feb 2010 | 415.5 | – |
| Mar 2010 | 418.5 | – |
| Apr 2010 | 420.6 | 40,944 |
| May 2010 | 421.5 | – |
| Jun 2010 | 423.3 | – |
| Jul 2010 | 423.1 | 42,997 |
| Aug 2010 | 422.5 | – |
| Sep 2010 | 424.0 | – |
| Oct 2010 | 424.4 | 45,006 |
| Nov 2010 | 422.5 | – |
| Dec 2010 | 424.4 | – |
| Jan 2011 | 426.0 | 46,555 |
| Feb 2011 | 427.6 | – |
| Mar 2011 | 429.5 | – |
| Apr 2011 | 430.2 | 48,243 |
| May 2011 | 434.5 | – |
| Jun 2011 | 432.1 | – |
| Jul 2011 | 433.4 | 49,384 |
| Aug 2011 | 436.2 | – |
| Sep 2011 | 436.7 | – |
| Oct 2011 | 438.7 | 52,628 |
| Nov 2011 | 441.4 | – |
| Dec 2011 | 441.1 | – |
| Jan 2012 | 443.4 | 53,788 |
| Feb 2012 | 444.1 | – |
| Mar 2012 | 443.0 | – |
| Apr 2012 | 443.3 | 55,095 |
| May 2012 | 444.6 | – |
| Jun 2012 | 446.0 | – |
| Jul 2012 | 447.8 | 57,196 |
| Aug 2012 | 448.9 | – |
| Sep 2012 | 449.0 | – |
| Oct 2012 | 448.2 | 59,862 |
| Nov 2012 | 448.9 | – |
| Dec 2012 | 452.2 | – |
| Jan 2013 | 454.9 | 61,911 |
| Feb 2013 | 457.7 | – |
| Mar 2013 | 459.4 | – |
| Apr 2013 | 459.8 | 64,849 |
| May 2013 | 461.5 | – |
| Jun 2013 | 463.2 | – |
| Jul 2013 | 465.4 | 67,175 |
| Aug 2013 | 469.1 | – |
| Sep 2013 | 471.7 | – |
| Oct 2013 | 476.4 | 69,244 |
| Nov 2013 | 477.1 | – |
| Dec 2013 | 481.2 | – |
| Jan 2014 | 485.2 | 71,503 |
| Feb 2014 | 488.4 | – |
| Mar 2014 | 492.4 | – |
| Apr 2014 | 499.9 | 75,080 |
| May 2014 | 499.4 | – |
| Jun 2014 | 505.8 | – |
| Jul 2014 | 507.0 | 78,069 |
| Aug 2014 | 508.0 | – |
| Sep 2014 | 510.4 | – |
| Oct 2014 | 512.8 | 79,567 |
| Nov 2014 | 517.6 | – |
| Dec 2014 | 514.7 | – |
| Source: U.S. Bureau of Labor Statistics, Current Employment Statistics survey; U.S. Census Bureau; and Federal Reserve Bank of St. Louis, FRED, http://research.stlouisfed.org/fred2/series/ECOMSA. | ||
Wholesale trade has recovered almost three-quarters of the jobs lost during its most recent employment downturn. In 2014, employment in this industry grew by 114,000. The largest gain occurred in durable goods, which added 63,000 jobs. Over the year, nondurable goods added 35,000 jobs and electronic markets and agents and brokers added 16,000 jobs.
Although the financial activities industry ended 2014 below its employment peak of December 2006, it did add 135,000 jobs in 2014, marking a recovery of 52 percent. This employment gain was well above the 2013 gain of 88,000. Apart from credit intermediation and related activities,14 which experienced job losses in 2014, most component industries in financial activities recorded job gains that were larger than the previous year’s. The largest employment gains occurred in insurance carriers and related activities (+83,000) and in real estate and rental and leasing (+56,000).
The construction industry was among the hardest hit during the recession, losing nearly 2.3 million jobs between April 2006 and January 2011. By the end of 2014, the industry had regained only 37 percent of the jobs lost. Although the explanations for this slow recovery are many, a few stand out. As the economy faltered, home foreclosures increased and lending standards tightened, driving up the inventory of unsold homes.15 The result was a diminished demand for newly built homes. In addition, increasing unemployment and declining home values, which prevented homeowners from tapping a home’s value through “cash-out” refinancing, resulted in a decline in remodeling activity.16
Nevertheless, in 2014, the construction industry experienced its largest employment increase since 2005, adding 338,000 jobs, a gain of 5.7 percent. (See table 1.) Gains were widespread, with each of the three major component industries—construction of buildings, heavy and civil engineering construction, and specialty trade contractors—seeing faster job growth in 2014 than in 2013. Employment increases were concentrated in construction’s residential components, with residential specialty trade contractors experiencing the largest gain (+114,000). Residential building construction also saw a continued increase in employment (+49,000), with job gains in new single-family general contractors (+35,000) and residential remodelers (+10,000) accounting for virtually all of that increase. Job gains in residential construction align, to an extent, with residential construction-related indicators, such as building permit issuance, housing starts and completions, and construction expenditures. Although these indicators did not increase at the same rate as employment did, they do tell a story of sustained growth after the most recent recession.17
| Industry | Level changes (in thousands) | Percent changes | ||||||
|---|---|---|---|---|---|---|---|---|
| 2011 | 2012 | 2013 | 2014 | 2011 | 2012 | 2013 | 2014 | |
| Construction | 145 | 112 | 213 | 338 | 2.7 | 2.0 | 3.7 | 5.7 |
| Construction of buildings | 19 | 30 | 52 | 74 | 1.6 | 2.4 | 4.1 | 5.6 |
| Residential building | 17 | 17 | 35 | 49 | 3.0 | 2.9 | 6.0 | 7.8 |
| Nonresidential building | 2 | 13 | 17 | 26 | .4 | 2.0 | 2.5 | 3.8 |
| Heavy and civil engineering construction | 34 | 19 | –1 | 56 | 4.2 | 2.2 | –.1 | 6.4 |
| Specialty trade contractors | 91 | 64 | 161 | 208 | 2.7 | 1.8 | 4.5 | 5.6 |
| Residential specialty trade contractors | 33 | 38 | 105 | 114 | 2.3 | 2.6 | 7.0 | 7.1 |
| Nonresidential specialty trade contractors | 59 | 26 | 56 | 95 | 2.9 | 1.3 | 2.7 | 4.4 |
| Source: U.S. Bureau of Labor Statistics, Current Employment Statistics survey. | ||||||||
Component industries in nonresidential construction also saw healthy employment gains in 2014. Nonresidential specialty trade contractors added 95,000 workers to payrolls, and nonresidential builders added 26,000 jobs, an increase that is largely due to an employment gain of 28,000 in commercial building. The job gain in commercial building corresponds to an increase in the value of commercial construction put in place, which has grown in each of the past 4 years.18 Heavy and civil engineering construction added 56,000 jobs over the year, a 6.4-percent increase that followed a decline of 0.1 percent in 2013. The employment increase in heavy and civil engineering construction, an industry largely dependent on public works projects, corresponds to an increase in the value of public construction expenditures, which has declined in each of the previous 4 years.19
| Date | Manufacturing employment |
|---|---|
| Jan 1939 | 9,077 |
| Feb 1939 | 9,175 |
| Mar 1939 | 9,275 |
| Apr 1939 | 9,309 |
| May 1939 | 9,299 |
| Jun 1939 | 9,315 |
| Jul 1939 | 9,231 |
| Aug 1939 | 9,400 |
| Sep 1939 | 9,604 |
| Oct 1939 | 9,873 |
| Nov 1939 | 9,896 |
| Dec 1939 | 9,949 |
| Jan 1940 | 9,927 |
| Feb 1940 | 9,916 |
| Mar 1940 | 9,884 |
| Apr 1940 | 9,817 |
| May 1940 | 9,810 |
| Jun 1940 | 9,832 |
| Jul 1940 | 9,766 |
| Aug 1940 | 10,048 |
| Sep 1940 | 10,258 |
| Oct 1940 | 10,471 |
| Nov 1940 | 10,643 |
| Dec 1940 | 10,847 |
| Jan 1941 | 10,993 |
| Feb 1941 | 11,211 |
| Mar 1941 | 11,409 |
| Apr 1941 | 11,698 |
| May 1941 | 11,957 |
| Jun 1941 | 12,204 |
| Jul 1941 | 12,382 |
| Aug 1941 | 12,532 |
| Sep 1941 | 12,683 |
| Oct 1941 | 12,770 |
| Nov 1941 | 12,810 |
| Dec 1941 | 12,876 |
| Jan 1942 | 12,965 |
| Feb 1942 | 13,127 |
| Mar 1942 | 13,311 |
| Apr 1942 | 13,509 |
| May 1942 | 13,704 |
| Jun 1942 | 13,842 |
| Jul 1942 | 14,072 |
| Aug 1942 | 14,339 |
| Sep 1942 | 14,582 |
| Oct 1942 | 14,772 |
| Nov 1942 | 14,971 |
| Dec 1942 | 15,288 |
| Jan 1943 | 15,532 |
| Feb 1943 | 15,685 |
| Mar 1943 | 15,856 |
| Apr 1943 | 15,961 |
| May 1943 | 16,044 |
| Jun 1943 | 16,204 |
| Jul 1943 | 16,306 |
| Aug 1943 | 16,369 |
| Sep 1943 | 16,366 |
| Oct 1943 | 16,512 |
| Nov 1943 | 16,598 |
| Dec 1943 | 16,526 |
| Jan 1944 | 16,439 |
| Feb 1944 | 16,330 |
| Mar 1944 | 16,170 |
| Apr 1944 | 16,012 |
| May 1944 | 15,944 |
| Jun 1944 | 15,890 |
| Jul 1944 | 15,832 |
| Aug 1944 | 15,781 |
| Sep 1944 | 15,662 |
| Oct 1944 | 15,630 |
| Nov 1944 | 15,568 |
| Dec 1944 | 15,659 |
| Jan 1945 | 15,669 |
| Feb 1945 | 15,581 |
| Mar 1945 | 15,473 |
| Apr 1945 | 15,335 |
| May 1945 | 15,201 |
| Jun 1945 | 14,948 |
| Jul 1945 | 14,599 |
| Aug 1945 | 14,201 |
| Sep 1945 | 12,486 |
| Oct 1945 | 12,487 |
| Nov 1945 | 12,537 |
| Dec 1945 | 12,528 |
| Jan 1946 | 12,719 |
| Feb 1946 | 11,922 |
| Mar 1946 | 12,545 |
| Apr 1946 | 13,200 |
| May 1946 | 13,389 |
| Jun 1946 | 13,598 |
| Jul 1946 | 13,771 |
| Aug 1946 | 13,981 |
| Sep 1946 | 14,135 |
| Oct 1946 | 14,182 |
| Nov 1946 | 14,310 |
| Dec 1946 | 14,301 |
| Jan 1947 | 14,328 |
| Feb 1947 | 14,278 |
| Mar 1947 | 14,259 |
| Apr 1947 | 14,240 |
| May 1947 | 14,189 |
| Jun 1947 | 14,200 |
| Jul 1947 | 14,076 |
| Aug 1947 | 14,200 |
| Sep 1947 | 14,315 |
| Oct 1947 | 14,393 |
| Nov 1947 | 14,414 |
| Dec 1947 | 14,428 |
| Jan 1948 | 14,438 |
| Feb 1948 | 14,339 |
| Mar 1948 | 14,364 |
| Apr 1948 | 14,183 |
| May 1948 | 14,235 |
| Jun 1948 | 14,318 |
| Jul 1948 | 14,359 |
| Aug 1948 | 14,353 |
| Sep 1948 | 14,441 |
| Oct 1948 | 14,390 |
| Nov 1948 | 14,292 |
| Dec 1948 | 14,086 |
| Jan 1949 | 13,867 |
| Feb 1949 | 13,734 |
| Mar 1949 | 13,581 |
| Apr 1949 | 13,439 |
| May 1949 | 13,269 |
| Jun 1949 | 13,178 |
| Jul 1949 | 13,067 |
| Aug 1949 | 13,158 |
| Sep 1949 | 13,225 |
| Oct 1949 | 12,891 |
| Nov 1949 | 12,882 |
| Dec 1949 | 13,062 |
| Jan 1950 | 13,161 |
| Feb 1950 | 13,169 |
| Mar 1950 | 13,290 |
| Apr 1950 | 13,471 |
| May 1950 | 13,780 |
| Jun 1950 | 13,923 |
| Jul 1950 | 14,072 |
| Aug 1950 | 14,461 |
| Sep 1950 | 14,561 |
| Oct 1950 | 14,737 |
| Nov 1950 | 14,762 |
| Dec 1950 | 14,782 |
| Jan 1951 | 14,950 |
| Feb 1951 | 15,076 |
| Mar 1951 | 15,125 |
| Apr 1951 | 15,166 |
| May 1951 | 15,164 |
| Jun 1951 | 15,176 |
| Jul 1951 | 15,110 |
| Aug 1951 | 15,061 |
| Sep 1951 | 14,996 |
| Oct 1951 | 14,973 |
| Nov 1951 | 14,999 |
| Dec 1951 | 15,045 |
| Jan 1952 | 15,067 |
| Feb 1952 | 15,105 |
| Mar 1952 | 15,127 |
| Apr 1952 | 15,162 |
| May 1952 | 15,143 |
| Jun 1952 | 14,828 |
| Jul 1952 | 14,707 |
| Aug 1952 | 15,279 |
| Sep 1952 | 15,553 |
| Oct 1952 | 15,690 |
| Nov 1952 | 15,843 |
| Dec 1952 | 15,973 |
| Jan 1953 | 16,067 |
| Feb 1953 | 16,158 |
| Mar 1953 | 16,270 |
| Apr 1953 | 16,293 |
| May 1953 | 16,341 |
| Jun 1953 | 16,343 |
| Jul 1953 | 16,353 |
| Aug 1953 | 16,278 |
| Sep 1953 | 16,151 |
| Oct 1953 | 15,981 |
| Nov 1953 | 15,728 |
| Dec 1953 | 15,581 |
| Jan 1954 | 15,440 |
| Feb 1954 | 15,307 |
| Mar 1954 | 15,197 |
| Apr 1954 | 15,065 |
| May 1954 | 14,974 |
| Jun 1954 | 14,910 |
| Jul 1954 | 14,799 |
| Aug 1954 | 14,772 |
| Sep 1954 | 14,805 |
| Oct 1954 | 14,841 |
| Nov 1954 | 14,913 |
| Dec 1954 | 14,967 |
| Jan 1955 | 15,034 |
| Feb 1955 | 15,138 |
| Mar 1955 | 15,258 |
| Apr 1955 | 15,375 |
| May 1955 | 15,493 |
| Jun 1955 | 15,585 |
| Jul 1955 | 15,614 |
| Aug 1955 | 15,679 |
| Sep 1955 | 15,668 |
| Oct 1955 | 15,740 |
| Nov 1955 | 15,813 |
| Dec 1955 | 15,859 |
| Jan 1956 | 15,882 |
| Feb 1956 | 15,889 |
| Mar 1956 | 15,829 |
| Apr 1956 | 15,909 |
| May 1956 | 15,893 |
| Jun 1956 | 15,835 |
| Jul 1956 | 15,468 |
| Aug 1956 | 15,893 |
| Sep 1956 | 15,863 |
| Oct 1956 | 15,937 |
| Nov 1956 | 15,916 |
| Dec 1956 | 15,957 |
| Jan 1957 | 15,970 |
| Feb 1957 | 15,998 |
| Mar 1957 | 15,994 |
| Apr 1957 | 15,970 |
| May 1957 | 15,931 |
| Jun 1957 | 15,873 |
| Jul 1957 | 15,854 |
| Aug 1957 | 15,867 |
| Sep 1957 | 15,710 |
| Oct 1957 | 15,599 |
| Nov 1957 | 15,466 |
| Dec 1957 | 15,332 |
| Jan 1958 | 15,130 |
| Feb 1958 | 14,908 |
| Mar 1958 | 14,670 |
| Apr 1958 | 14,506 |
| May 1958 | 14,414 |
| Jun 1958 | 14,408 |
| Jul 1958 | 14,450 |
| Aug 1958 | 14,524 |
| Sep 1958 | 14,658 |
| Oct 1958 | 14,503 |
| Nov 1958 | 14,827 |
| Dec 1958 | 14,877 |
| Jan 1959 | 14,998 |
| Feb 1959 | 15,115 |
| Mar 1959 | 15,259 |
| Apr 1959 | 15,385 |
| May 1959 | 15,487 |
| Jun 1959 | 15,554 |
| Jul 1959 | 15,623 |
| Aug 1959 | 15,202 |
| Sep 1959 | 15,254 |
| Oct 1959 | 15,158 |
| Nov 1959 | 15,300 |
| Dec 1959 | 15,573 |
| Jan 1960 | 15,687 |
| Feb 1960 | 15,765 |
| Mar 1960 | 15,707 |
| Apr 1960 | 15,654 |
| May 1960 | 15,575 |
| Jun 1960 | 15,466 |
| Jul 1960 | 15,413 |
| Aug 1960 | 15,360 |
| Sep 1960 | 15,330 |
| Oct 1960 | 15,231 |
| Nov 1960 | 15,112 |
| Dec 1960 | 14,947 |
| Jan 1961 | 14,863 |
| Feb 1961 | 14,801 |
| Mar 1961 | 14,802 |
| Apr 1961 | 14,825 |
| May 1961 | 14,932 |
| Jun 1961 | 14,981 |
| Jul 1961 | 15,029 |
| Aug 1961 | 15,093 |
| Sep 1961 | 15,080 |
| Oct 1961 | 15,143 |
| Nov 1961 | 15,259 |
| Dec 1961 | 15,309 |
| Jan 1962 | 15,322 |
| Feb 1962 | 15,411 |
| Mar 1962 | 15,451 |
| Apr 1962 | 15,524 |
| May 1962 | 15,513 |
| Jun 1962 | 15,518 |
| Jul 1962 | 15,522 |
| Aug 1962 | 15,517 |
| Sep 1962 | 15,568 |
| Oct 1962 | 15,569 |
| Nov 1962 | 15,530 |
| Dec 1962 | 15,520 |
| Jan 1963 | 15,545 |
| Feb 1963 | 15,542 |
| Mar 1963 | 15,564 |
| Apr 1963 | 15,602 |
| May 1963 | 15,641 |
| Jun 1963 | 15,624 |
| Jul 1963 | 15,646 |
| Aug 1963 | 15,644 |
| Sep 1963 | 15,674 |
| Oct 1963 | 15,714 |
| Nov 1963 | 15,675 |
| Dec 1963 | 15,712 |
| Jan 1964 | 15,715 |
| Feb 1964 | 15,742 |
| Mar 1964 | 15,770 |
| Apr 1964 | 15,785 |
| May 1964 | 15,812 |
| Jun 1964 | 15,839 |
| Jul 1964 | 15,887 |
| Aug 1964 | 15,948 |
| Sep 1964 | 16,073 |
| Oct 1964 | 15,821 |
| Nov 1964 | 16,096 |
| Dec 1964 | 16,176 |
| Jan 1965 | 16,245 |
| Feb 1965 | 16,291 |
| Mar 1965 | 16,353 |
| Apr 1965 | 16,418 |
| May 1965 | 16,477 |
| Jun 1965 | 16,554 |
| Jul 1965 | 16,669 |
| Aug 1965 | 16,732 |
| Sep 1965 | 16,802 |
| Oct 1965 | 16,864 |
| Nov 1965 | 16,962 |
| Dec 1965 | 17,051 |
| Jan 1966 | 17,143 |
| Feb 1966 | 17,288 |
| Mar 1966 | 17,400 |
| Apr 1966 | 17,517 |
| May 1966 | 17,625 |
| Jun 1966 | 17,733 |
| Jul 1966 | 17,760 |
| Aug 1966 | 17,882 |
| Sep 1966 | 17,886 |
| Oct 1966 | 17,956 |
| Nov 1966 | 17,981 |
| Dec 1966 | 17,998 |
| Jan 1967 | 18,033 |
| Feb 1967 | 17,978 |
| Mar 1967 | 17,940 |
| Apr 1967 | 17,878 |
| May 1967 | 17,832 |
| Jun 1967 | 17,812 |
| Jul 1967 | 17,784 |
| Aug 1967 | 17,905 |
| Sep 1967 | 17,794 |
| Oct 1967 | 17,800 |
| Nov 1967 | 17,985 |
| Dec 1967 | 18,025 |
| Jan 1968 | 18,040 |
| Feb 1968 | 18,054 |
| Mar 1968 | 18,067 |
| Apr 1968 | 18,131 |
| May 1968 | 18,190 |
| Jun 1968 | 18,228 |
| Jul 1968 | 18,265 |
| Aug 1968 | 18,254 |
| Sep 1968 | 18,252 |
| Oct 1968 | 18,293 |
| Nov 1968 | 18,346 |
| Dec 1968 | 18,410 |
| Jan 1969 | 18,432 |
| Feb 1969 | 18,502 |
| Mar 1969 | 18,558 |
| Apr 1969 | 18,554 |
| May 1969 | 18,588 |
| Jun 1969 | 18,640 |
| Jul 1969 | 18,642 |
| Aug 1969 | 18,767 |
| Sep 1969 | 18,620 |
| Oct 1969 | 18,613 |
| Nov 1969 | 18,467 |
| Dec 1969 | 18,485 |
| Jan 1970 | 18,424 |
| Feb 1970 | 18,361 |
| Mar 1970 | 18,360 |
| Apr 1970 | 18,207 |
| May 1970 | 18,029 |
| Jun 1970 | 17,930 |
| Jul 1970 | 17,877 |
| Aug 1970 | 17,779 |
| Sep 1970 | 17,692 |
| Oct 1970 | 17,173 |
| Nov 1970 | 17,024 |
| Dec 1970 | 17,309 |
| Jan 1971 | 17,280 |
| Feb 1971 | 17,216 |
| Mar 1971 | 17,154 |
| Apr 1971 | 17,149 |
| May 1971 | 17,225 |
| Jun 1971 | 17,139 |
| Jul 1971 | 17,126 |
| Aug 1971 | 17,115 |
| Sep 1971 | 17,154 |
| Oct 1971 | 17,126 |
| Nov 1971 | 17,166 |
| Dec 1971 | 17,202 |
| Jan 1972 | 17,283 |
| Feb 1972 | 17,361 |
| Mar 1972 | 17,447 |
| Apr 1972 | 17,508 |
| May 1972 | 17,602 |
| Jun 1972 | 17,641 |
| Jul 1972 | 17,556 |
| Aug 1972 | 17,741 |
| Sep 1972 | 17,774 |
| Oct 1972 | 17,893 |
| Nov 1972 | 18,005 |
| Dec 1972 | 18,158 |
| Jan 1973 | 18,276 |
| Feb 1973 | 18,410 |
| Mar 1973 | 18,493 |
| Apr 1973 | 18,530 |
| May 1973 | 18,564 |
| Jun 1973 | 18,606 |
| Jul 1973 | 18,598 |
| Aug 1973 | 18,629 |
| Sep 1973 | 18,609 |
| Oct 1973 | 18,702 |
| Nov 1973 | 18,773 |
| Dec 1973 | 18,820 |
| Jan 1974 | 18,788 |
| Feb 1974 | 18,727 |
| Mar 1974 | 18,700 |
| Apr 1974 | 18,702 |
| May 1974 | 18,688 |
| Jun 1974 | 18,690 |
| Jul 1974 | 18,656 |
| Aug 1974 | 18,570 |
| Sep 1974 | 18,492 |
| Oct 1974 | 18,364 |
| Nov 1974 | 18,077 |
| Dec 1974 | 17,693 |
| Jan 1975 | 17,344 |
| Feb 1975 | 17,004 |
| Mar 1975 | 16,853 |
| Apr 1975 | 16,759 |
| May 1975 | 16,746 |
| Jun 1975 | 16,690 |
| Jul 1975 | 16,678 |
| Aug 1975 | 16,824 |
| Sep 1975 | 16,904 |
| Oct 1975 | 16,984 |
| Nov 1975 | 17,025 |
| Dec 1975 | 17,140 |
| Jan 1976 | 17,287 |
| Feb 1976 | 17,384 |
| Mar 1976 | 17,470 |
| Apr 1976 | 17,541 |
| May 1976 | 17,513 |
| Jun 1976 | 17,521 |
| Jul 1976 | 17,524 |
| Aug 1976 | 17,596 |
| Sep 1976 | 17,665 |
| Oct 1976 | 17,548 |
| Nov 1976 | 17,682 |
| Dec 1976 | 17,719 |
| Jan 1977 | 17,803 |
| Feb 1977 | 17,843 |
| Mar 1977 | 17,941 |
| Apr 1977 | 18,024 |
| May 1977 | 18,107 |
| Jun 1977 | 18,192 |
| Jul 1977 | 18,259 |
| Aug 1977 | 18,276 |
| Sep 1977 | 18,334 |
| Oct 1977 | 18,356 |
| Nov 1977 | 18,419 |
| Dec 1977 | 18,531 |
| Jan 1978 | 18,593 |
| Feb 1978 | 18,639 |
| Mar 1978 | 18,699 |
| Apr 1978 | 18,772 |
| May 1978 | 18,848 |
| Jun 1978 | 18,919 |
| Jul 1978 | 18,951 |
| Aug 1978 | 19,006 |
| Sep 1978 | 19,068 |
| Oct 1978 | 19,142 |
| Nov 1978 | 19,257 |
| Dec 1978 | 19,334 |
| Jan 1979 | 19,388 |
| Feb 1979 | 19,409 |
| Mar 1979 | 19,453 |
| Apr 1979 | 19,450 |
| May 1979 | 19,509 |
| Jun 1979 | 19,553 |
| Jul 1979 | 19,531 |
| Aug 1979 | 19,406 |
| Sep 1979 | 19,442 |
| Oct 1979 | 19,390 |
| Nov 1979 | 19,299 |
| Dec 1979 | 19,301 |
| Jan 1980 | 19,282 |
| Feb 1980 | 19,219 |
| Mar 1980 | 19,217 |
| Apr 1980 | 18,973 |
| May 1980 | 18,726 |
| Jun 1980 | 18,490 |
| Jul 1980 | 18,276 |
| Aug 1980 | 18,414 |
| Sep 1980 | 18,445 |
| Oct 1980 | 18,506 |
| Nov 1980 | 18,601 |
| Dec 1980 | 18,640 |
| Jan 1981 | 18,639 |
| Feb 1981 | 18,613 |
| Mar 1981 | 18,647 |
| Apr 1981 | 18,711 |
| May 1981 | 18,766 |
| Jun 1981 | 18,789 |
| Jul 1981 | 18,785 |
| Aug 1981 | 18,748 |
| Sep 1981 | 18,712 |
| Oct 1981 | 18,566 |
| Nov 1981 | 18,409 |
| Dec 1981 | 18,223 |
| Jan 1982 | 18,047 |
| Feb 1982 | 17,981 |
| Mar 1982 | 17,857 |
| Apr 1982 | 17,683 |
| May 1982 | 17,588 |
| Jun 1982 | 17,430 |
| Jul 1982 | 17,278 |
| Aug 1982 | 17,160 |
| Sep 1982 | 17,074 |
| Oct 1982 | 16,853 |
| Nov 1982 | 16,722 |
| Dec 1982 | 16,690 |
| Jan 1983 | 16,705 |
| Feb 1983 | 16,706 |
| Mar 1983 | 16,711 |
| Apr 1983 | 16,794 |
| May 1983 | 16,885 |
| Jun 1983 | 16,960 |
| Jul 1983 | 17,059 |
| Aug 1983 | 17,118 |
| Sep 1983 | 17,255 |
| Oct 1983 | 17,367 |
| Nov 1983 | 17,479 |
| Dec 1983 | 17,551 |
| Jan 1984 | 17,630 |
| Feb 1984 | 17,728 |
| Mar 1984 | 17,806 |
| Apr 1984 | 17,872 |
| May 1984 | 17,916 |
| Jun 1984 | 17,967 |
| Jul 1984 | 18,013 |
| Aug 1984 | 18,034 |
| Sep 1984 | 18,019 |
| Oct 1984 | 18,024 |
| Nov 1984 | 18,016 |
| Dec 1984 | 18,023 |
| Jan 1985 | 18,009 |
| Feb 1985 | 17,966 |
| Mar 1985 | 17,939 |
| Apr 1985 | 17,886 |
| May 1985 | 17,855 |
| Jun 1985 | 17,819 |
| Jul 1985 | 17,776 |
| Aug 1985 | 17,756 |
| Sep 1985 | 17,718 |
| Oct 1985 | 17,708 |
| Nov 1985 | 17,697 |
| Dec 1985 | 17,693 |
| Jan 1986 | 17,686 |
| Feb 1986 | 17,663 |
| Mar 1986 | 17,624 |
| Apr 1986 | 17,616 |
| May 1986 | 17,593 |
| Jun 1986 | 17,530 |
| Jul 1986 | 17,497 |
| Aug 1986 | 17,489 |
| Sep 1986 | 17,498 |
| Oct 1986 | 17,477 |
| Nov 1986 | 17,472 |
| Dec 1986 | 17,478 |
| Jan 1987 | 17,465 |
| Feb 1987 | 17,499 |
| Mar 1987 | 17,507 |
| Apr 1987 | 17,525 |
| May 1987 | 17,542 |
| Jun 1987 | 17,537 |
| Jul 1987 | 17,593 |
| Aug 1987 | 17,630 |
| Sep 1987 | 17,691 |
| Oct 1987 | 17,729 |
| Nov 1987 | 17,775 |
| Dec 1987 | 17,809 |
| Jan 1988 | 17,790 |
| Feb 1988 | 17,823 |
| Mar 1988 | 17,844 |
| Apr 1988 | 17,874 |
| May 1988 | 17,892 |
| Jun 1988 | 17,916 |
| Jul 1988 | 17,926 |
| Aug 1988 | 17,891 |
| Sep 1988 | 17,914 |
| Oct 1988 | 17,966 |
| Nov 1988 | 18,003 |
| Dec 1988 | 18,025 |
| Jan 1989 | 18,057 |
| Feb 1989 | 18,055 |
| Mar 1989 | 18,060 |
| Apr 1989 | 18,055 |
| May 1989 | 18,040 |
| Jun 1989 | 18,013 |
| Jul 1989 | 17,980 |
| Aug 1989 | 17,964 |
| Sep 1989 | 17,922 |
| Oct 1989 | 17,895 |
| Nov 1989 | 17,886 |
| Dec 1989 | 17,881 |
| Jan 1990 | 17,797 |
| Feb 1990 | 17,893 |
| Mar 1990 | 17,868 |
| Apr 1990 | 17,845 |
| May 1990 | 17,797 |
| Jun 1990 | 17,776 |
| Jul 1990 | 17,704 |
| Aug 1990 | 17,649 |
| Sep 1990 | 17,609 |
| Oct 1990 | 17,577 |
| Nov 1990 | 17,428 |
| Dec 1990 | 17,395 |
| Jan 1991 | 17,330 |
| Feb 1991 | 17,211 |
| Mar 1991 | 17,140 |
| Apr 1991 | 17,093 |
| May 1991 | 17,070 |
| Jun 1991 | 17,044 |
| Jul 1991 | 17,015 |
| Aug 1991 | 17,025 |
| Sep 1991 | 17,010 |
| Oct 1991 | 16,999 |
| Nov 1991 | 16,961 |
| Dec 1991 | 16,916 |
| Jan 1992 | 16,839 |
| Feb 1992 | 16,829 |
| Mar 1992 | 16,805 |
| Apr 1992 | 16,831 |
| May 1992 | 16,835 |
| Jun 1992 | 16,826 |
| Jul 1992 | 16,819 |
| Aug 1992 | 16,783 |
| Sep 1992 | 16,761 |
| Oct 1992 | 16,751 |
| Nov 1992 | 16,758 |
| Dec 1992 | 16,769 |
| Jan 1993 | 16,791 |
| Feb 1993 | 16,805 |
| Mar 1993 | 16,795 |
| Apr 1993 | 16,772 |
| May 1993 | 16,766 |
| Jun 1993 | 16,742 |
| Jul 1993 | 16,739 |
| Aug 1993 | 16,741 |
| Sep 1993 | 16,769 |
| Oct 1993 | 16,778 |
| Nov 1993 | 16,800 |
| Dec 1993 | 16,815 |
| Jan 1994 | 16,855 |
| Feb 1994 | 16,862 |
| Mar 1994 | 16,897 |
| Apr 1994 | 16,933 |
| May 1994 | 16,962 |
| Jun 1994 | 17,010 |
| Jul 1994 | 17,026 |
| Aug 1994 | 17,081 |
| Sep 1994 | 17,115 |
| Oct 1994 | 17,144 |
| Nov 1994 | 17,186 |
| Dec 1994 | 17,217 |
| Jan 1995 | 17,262 |
| Feb 1995 | 17,265 |
| Mar 1995 | 17,263 |
| Apr 1995 | 17,278 |
| May 1995 | 17,259 |
| Jun 1995 | 17,247 |
| Jul 1995 | 17,218 |
| Aug 1995 | 17,240 |
| Sep 1995 | 17,247 |
| Oct 1995 | 17,216 |
| Nov 1995 | 17,209 |
| Dec 1995 | 17,231 |
| Jan 1996 | 17,208 |
| Feb 1996 | 17,229 |
| Mar 1996 | 17,193 |
| Apr 1996 | 17,204 |
| May 1996 | 17,222 |
| Jun 1996 | 17,226 |
| Jul 1996 | 17,223 |
| Aug 1996 | 17,255 |
| Sep 1996 | 17,252 |
| Oct 1996 | 17,268 |
| Nov 1996 | 17,277 |
| Dec 1996 | 17,284 |
| Jan 1997 | 17,297 |
| Feb 1997 | 17,316 |
| Mar 1997 | 17,340 |
| Apr 1997 | 17,349 |
| May 1997 | 17,362 |
| Jun 1997 | 17,387 |
| Jul 1997 | 17,389 |
| Aug 1997 | 17,452 |
| Sep 1997 | 17,465 |
| Oct 1997 | 17,513 |
| Nov 1997 | 17,556 |
| Dec 1997 | 17,588 |
| Jan 1998 | 17,619 |
| Feb 1998 | 17,627 |
| Mar 1998 | 17,637 |
| Apr 1998 | 17,637 |
| May 1998 | 17,624 |
| Jun 1998 | 17,608 |
| Jul 1998 | 17,422 |
| Aug 1998 | 17,563 |
| Sep 1998 | 17,557 |
| Oct 1998 | 17,512 |
| Nov 1998 | 17,465 |
| Dec 1998 | 17,449 |
| Jan 1999 | 17,427 |
| Feb 1999 | 17,395 |
| Mar 1999 | 17,368 |
| Apr 1999 | 17,344 |
| May 1999 | 17,333 |
| Jun 1999 | 17,295 |
| Jul 1999 | 17,308 |
| Aug 1999 | 17,287 |
| Sep 1999 | 17,281 |
| Oct 1999 | 17,272 |
| Nov 1999 | 17,282 |
| Dec 1999 | 17,280 |
| Jan 2000 | 17,284 |
| Feb 2000 | 17,285 |
| Mar 2000 | 17,302 |
| Apr 2000 | 17,298 |
| May 2000 | 17,279 |
| Jun 2000 | 17,296 |
| Jul 2000 | 17,322 |
| Aug 2000 | 17,287 |
| Sep 2000 | 17,230 |
| Oct 2000 | 17,217 |
| Nov 2000 | 17,202 |
| Dec 2000 | 17,181 |
| Jan 2001 | 17,104 |
| Feb 2001 | 17,028 |
| Mar 2001 | 16,938 |
| Apr 2001 | 16,802 |
| May 2001 | 16,661 |
| Jun 2001 | 16,515 |
| Jul 2001 | 16,382 |
| Aug 2001 | 16,232 |
| Sep 2001 | 16,117 |
| Oct 2001 | 15,972 |
| Nov 2001 | 15,825 |
| Dec 2001 | 15,711 |
| Jan 2002 | 15,587 |
| Feb 2002 | 15,515 |
| Mar 2002 | 15,443 |
| Apr 2002 | 15,392 |
| May 2002 | 15,337 |
| Jun 2002 | 15,298 |
| Jul 2002 | 15,256 |
| Aug 2002 | 15,171 |
| Sep 2002 | 15,119 |
| Oct 2002 | 15,060 |
| Nov 2002 | 14,992 |
| Dec 2002 | 14,912 |
| Jan 2003 | 14,866 |
| Feb 2003 | 14,781 |
| Mar 2003 | 14,721 |
| Apr 2003 | 14,609 |
| May 2003 | 14,557 |
| Jun 2003 | 14,493 |
| Jul 2003 | 14,402 |
| Aug 2003 | 14,376 |
| Sep 2003 | 14,347 |
| Oct 2003 | 14,334 |
| Nov 2003 | 14,316 |
| Dec 2003 | 14,300 |
| Jan 2004 | 14,290 |
| Feb 2004 | 14,279 |
| Mar 2004 | 14,287 |
| Apr 2004 | 14,315 |
| May 2004 | 14,342 |
| Jun 2004 | 14,332 |
| Jul 2004 | 14,330 |
| Aug 2004 | 14,345 |
| Sep 2004 | 14,331 |
| Oct 2004 | 14,332 |
| Nov 2004 | 14,307 |
| Dec 2004 | 14,287 |
| Jan 2005 | 14,257 |
| Feb 2005 | 14,273 |
| Mar 2005 | 14,269 |
| Apr 2005 | 14,250 |
| May 2005 | 14,256 |
| Jun 2005 | 14,227 |
| Jul 2005 | 14,226 |
| Aug 2005 | 14,203 |
| Sep 2005 | 14,175 |
| Oct 2005 | 14,192 |
| Nov 2005 | 14,187 |
| Dec 2005 | 14,193 |
| Jan 2006 | 14,210 |
| Feb 2006 | 14,209 |
| Mar 2006 | 14,214 |
| Apr 2006 | 14,226 |
| May 2006 | 14,203 |
| Jun 2006 | 14,213 |
| Jul 2006 | 14,188 |
| Aug 2006 | 14,159 |
| Sep 2006 | 14,125 |
| Oct 2006 | 14,075 |
| Nov 2006 | 14,041 |
| Dec 2006 | 14,015 |
| Jan 2007 | 14,008 |
| Feb 2007 | 13,997 |
| Mar 2007 | 13,970 |
| Apr 2007 | 13,945 |
| May 2007 | 13,929 |
| Jun 2007 | 13,911 |
| Jul 2007 | 13,889 |
| Aug 2007 | 13,828 |
| Sep 2007 | 13,790 |
| Oct 2007 | 13,764 |
| Nov 2007 | 13,757 |
| Dec 2007 | 13,746 |
| Jan 2008 | 13,725 |
| Feb 2008 | 13,696 |
| Mar 2008 | 13,659 |
| Apr 2008 | 13,599 |
| May 2008 | 13,564 |
| Jun 2008 | 13,504 |
| Jul 2008 | 13,430 |
| Aug 2008 | 13,358 |
| Sep 2008 | 13,275 |
| Oct 2008 | 13,147 |
| Nov 2008 | 13,034 |
| Dec 2008 | 12,850 |
| Jan 2009 | 12,561 |
| Feb 2009 | 12,380 |
| Mar 2009 | 12,208 |
| Apr 2009 | 12,030 |
| May 2009 | 11,862 |
| Jun 2009 | 11,726 |
| Jul 2009 | 11,668 |
| Aug 2009 | 11,626 |
| Sep 2009 | 11,591 |
| Oct 2009 | 11,538 |
| Nov 2009 | 11,509 |
| Dec 2009 | 11,475 |
| Jan 2010 | 11,460 |
| Feb 2010 | 11,453 |
| Mar 2010 | 11,453 |
| Apr 2010 | 11,489 |
| May 2010 | 11,525 |
| Jun 2010 | 11,545 |
| Jul 2010 | 11,561 |
| Aug 2010 | 11,553 |
| Sep 2010 | 11,563 |
| Oct 2010 | 11,562 |
| Nov 2010 | 11,585 |
| Dec 2010 | 11,595 |
| Jan 2011 | 11,618 |
| Feb 2011 | 11,653 |
| Mar 2011 | 11,670 |
| Apr 2011 | 11,700 |
| May 2011 | 11,712 |
| Jun 2011 | 11,724 |
| Jul 2011 | 11,742 |
| Aug 2011 | 11,766 |
| Sep 2011 | 11,771 |
| Oct 2011 | 11,776 |
| Nov 2011 | 11,774 |
| Dec 2011 | 11,799 |
| Jan 2012 | 11,834 |
| Feb 2012 | 11,857 |
| Mar 2012 | 11,899 |
| Apr 2012 | 11,916 |
| May 2012 | 11,930 |
| Jun 2012 | 11,941 |
| Jul 2012 | 11,965 |
| Aug 2012 | 11,961 |
| Sep 2012 | 11,948 |
| Oct 2012 | 11,951 |
| Nov 2012 | 11,947 |
| Dec 2012 | 11,961 |
| Jan 2013 | 11,980 |
| Feb 2013 | 12,002 |
| Mar 2013 | 12,006 |
| Apr 2013 | 12,006 |
| May 2013 | 12,007 |
| Jun 2013 | 12,005 |
| Jul 2013 | 11,983 |
| Aug 2013 | 12,011 |
| Sep 2013 | 12,022 |
| Oct 2013 | 12,040 |
| Nov 2013 | 12,072 |
| Dec 2013 | 12,086 |
| Jan 2014 | 12,102 |
| Feb 2014 | 12,122 |
| Mar 2014 | 12,131 |
| Apr 2014 | 12,142 |
| May 2014 | 12,154 |
| Jun 2014 | 12,177 |
| Jul 2014 | 12,191 |
| Aug 2014 | 12,205 |
| Sep 2014 | 12,214 |
| Oct 2014 | 12,237 |
| Nov 2014 | 12,282 |
| Dec 2014 | 12,301 |
| Source: U.S. Bureau of Labor Statistics, Current Employment Statistics survey. | |
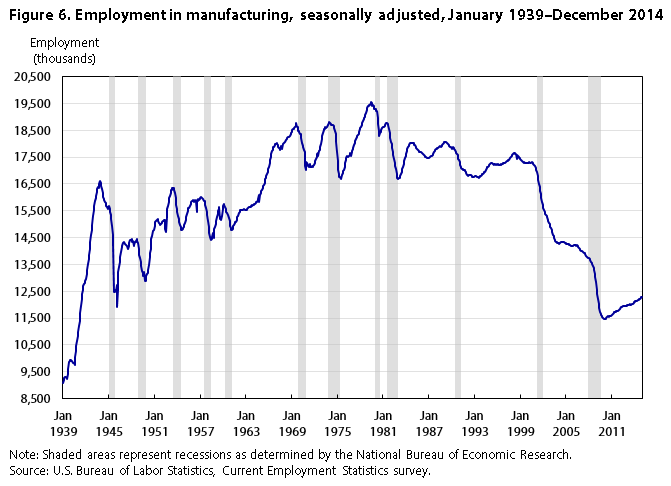
Manufacturing has been losing jobs since the late 1970s. (See figure 6.) This trend may reflect long-term structural changes, which could be immune to overall economic recovery.20 These structural changes are well documented and include increases in labor productivity and the movement of labor-intensive manufacturing activity overseas, to low-wage countries. After the 2001 recession, the industry did not enter a period of employment recovery. Declines accelerated between August 2004 and March 2010, a period encompassing the most recent recession, with employment falling by 2.8 million. By the end of 2014, 29 percent of the jobs lost had been recovered. Job gains in 2014 totaled 215,000, the largest annual increase since 1997.
")
| Date | Motor vehicle and parts employment | Motor vehicle production |
|---|---|---|
| Jan 1995 | 1,232.5 | 575.7 |
| Feb 1995 | 1,238.1 | 568.7 |
| Mar 1995 | 1,243.1 | 588.7 |
| Apr 1995 | 1,247.0 | 524.4 |
| May 1995 | 1,245.9 | 510.4 |
| Jun 1995 | 1,236.0 | 508.2 |
| Jul 1995 | 1,243.2 | 518.5 |
| Aug 1995 | 1,244.0 | 465.1 |
| Sep 1995 | 1,244.1 | 523.1 |
| Oct 1995 | 1,245.2 | 523.2 |
| Nov 1995 | 1,237.1 | 511.3 |
| Dec 1995 | 1,241.7 | 508.6 |
| Jan 1996 | 1,235.7 | 484.8 |
| Feb 1996 | 1,239.6 | 501.9 |
| Mar 1996 | 1,209.8 | 395.4 |
| Apr 1996 | 1,241.4 | 528.7 |
| May 1996 | 1,245.0 | 543.6 |
| Jun 1996 | 1,248.0 | 563.4 |
| Jul 1996 | 1,238.9 | 553.7 |
| Aug 1996 | 1,249.1 | 539.1 |
| Sep 1996 | 1,248.4 | 525.2 |
| Oct 1996 | 1,242.7 | 470.0 |
| Nov 1996 | 1,242.2 | 494.1 |
| Dec 1996 | 1,243.4 | 434.5 |
| Jan 1997 | 1,246.8 | 496.0 |
| Feb 1997 | 1,246.4 | 505.5 |
| Mar 1997 | 1,249.9 | 469.1 |
| Apr 1997 | 1,243.7 | 523.8 |
| May 1997 | 1,241.9 | 481.5 |
| Jun 1997 | 1,243.8 | 470.6 |
| Jul 1997 | 1,242.0 | 489.9 |
| Aug 1997 | 1,263.4 | 509.5 |
| Sep 1997 | 1,257.1 | 470.8 |
| Oct 1997 | 1,261.9 | 488.9 |
| Nov 1997 | 1,276.3 | 494.7 |
| Dec 1997 | 1,274.6 | 477.3 |
| Jan 1998 | 1,274.5 | 483.7 |
| Feb 1998 | 1,278.1 | 458.7 |
| Mar 1998 | 1,277.4 | 449.8 |
| Apr 1998 | 1,280.2 | 451.7 |
| May 1998 | 1,279.8 | 457.5 |
| Jun 1998 | 1,275.7 | 396.8 |
| Jul 1998 | 1,143.9 | 315.0 |
| Aug 1998 | 1,281.7 | 507.6 |
| Sep 1998 | 1,288.2 | 524.4 |
| Oct 1998 | 1,294.1 | 501.5 |
| Nov 1998 | 1,291.9 | 470.8 |
| Dec 1998 | 1,293.5 | 490.6 |
| Jan 1999 | 1,297.7 | 470.3 |
| Feb 1999 | 1,296.2 | 455.4 |
| Mar 1999 | 1,303.4 | 462.1 |
| Apr 1999 | 1,308.1 | 466.6 |
| May 1999 | 1,309.1 | 454.3 |
| Jun 1999 | 1,311.5 | 452.8 |
| Jul 1999 | 1,322.8 | 443.8 |
| Aug 1999 | 1,319.9 | 468.5 |
| Sep 1999 | 1,322.2 | 468.8 |
| Oct 1999 | 1,318.9 | 478.9 |
| Nov 1999 | 1,319.1 | 481.0 |
| Dec 1999 | 1,319.5 | 470.0 |
| Jan 2000 | 1,328.1 | 469.4 |
| Feb 2000 | 1,329.7 | 461.2 |
| Mar 2000 | 1,327.2 | 462.3 |
| Apr 2000 | 1,324.5 | 475.5 |
| May 2000 | 1,325.9 | 481.2 |
| Jun 2000 | 1,333.6 | 464.1 |
| Jul 2000 | 1,314.1 | 449.6 |
| Aug 2000 | 1,306.0 | 461.9 |
| Sep 2000 | 1,295.9 | 471.8 |
| Oct 2000 | 1,296.7 | 445.8 |
| Nov 2000 | 1,292.0 | 413.0 |
| Dec 2000 | 1,286.7 | 393.2 |
| Jan 2001 | 1,250.0 | 405.9 |
| Feb 2001 | 1,257.1 | 387.4 |
| Mar 2001 | 1,243.6 | 416.0 |
| Apr 2001 | 1,235.4 | 416.1 |
| May 2001 | 1,223.1 | 427.2 |
| Jun 2001 | 1,211.0 | 415.9 |
| Jul 2001 | 1,210.2 | 397.8 |
| Aug 2001 | 1,204.8 | 381.7 |
| Sep 2001 | 1,201.6 | 380.9 |
| Oct 2001 | 1,175.4 | 371.9 |
| Nov 2001 | 1,172.9 | 395.3 |
| Dec 2001 | 1,169.5 | 417.9 |
| Jan 2002 | 1,140.1 | 410.8 |
| Feb 2002 | 1,155.6 | 436.2 |
| Mar 2002 | 1,155.8 | 428.4 |
| Apr 2002 | 1,154.0 | 433.9 |
| May 2002 | 1,154.8 | 429.0 |
| Jun 2002 | 1,156.3 | 435.8 |
| Jul 2002 | 1,162.1 | 439.1 |
| Aug 2002 | 1,151.4 | 411.5 |
| Sep 2002 | 1,149.8 | 399.1 |
| Oct 2002 | 1,147.9 | 394.1 |
| Nov 2002 | 1,145.5 | 419.3 |
| Dec 2002 | 1,141.7 | 381.3 |
| Jan 2003 | 1,145.7 | 420.3 |
| Feb 2003 | 1,139.8 | 367.2 |
| Mar 2003 | 1,135.7 | 363.0 |
| Apr 2003 | 1,115.3 | 362.2 |
| May 2003 | 1,126.2 | 373.8 |
| Jun 2003 | 1,127.7 | 376.6 |
| Jul 2003 | 1,122.8 | 356.5 |
| Aug 2003 | 1,119.4 | 348.8 |
| Sep 2003 | 1,118.0 | 401.9 |
| Oct 2003 | 1,118.3 | 370.6 |
| Nov 2003 | 1,118.7 | 370.1 |
| Dec 2003 | 1,116.5 | 350.6 |
| Jan 2004 | 1,116.3 | 347.8 |
| Feb 2004 | 1,115.1 | 366.6 |
| Mar 2004 | 1,113.3 | 359.3 |
| Apr 2004 | 1,112.0 | 368.2 |
| May 2004 | 1,112.9 | 350.3 |
| Jun 2004 | 1,111.3 | 333.8 |
| Jul 2004 | 1,099.6 | 337.9 |
| Aug 2004 | 1,117.4 | 351.4 |
| Sep 2004 | 1,112.5 | 350.2 |
| Oct 2004 | 1,118.0 | 328.2 |
| Nov 2004 | 1,112.4 | 324.0 |
| Dec 2004 | 1,111.2 | 345.1 |
| Jan 2005 | 1,107.2 | 348.0 |
| Feb 2005 | 1,118.0 | 370.3 |
| Mar 2005 | 1,109.4 | 354.6 |
| Apr 2005 | 1,102.2 | 351.5 |
| May 2005 | 1,105.7 | 350.8 |
| Jun 2005 | 1,091.6 | 366.5 |
| Jul 2005 | 1,086.6 | 348.6 |
| Aug 2005 | 1,085.2 | 349.4 |
| Sep 2005 | 1,089.8 | 355.7 |
| Oct 2005 | 1,087.6 | 349.3 |
| Nov 2005 | 1,088.8 | 364.6 |
| Dec 2005 | 1,087.1 | 347.9 |
| Jan 2006 | 1,098.5 | 373.4 |
| Feb 2006 | 1,079.7 | 365.6 |
| Mar 2006 | 1,079.5 | 377.4 |
| Apr 2006 | 1,087.2 | 381.8 |
| May 2006 | 1,080.8 | 366.4 |
| Jun 2006 | 1,087.4 | 349.8 |
| Jul 2006 | 1,071.6 | 325.7 |
| Aug 2006 | 1,063.0 | 348.2 |
| Sep 2006 | 1,057.9 | 362.4 |
| Oct 2006 | 1,050.8 | 349.3 |
| Nov 2006 | 1,042.2 | 339.2 |
| Dec 2006 | 1,040.7 | 354.1 |
| Jan 2007 | 1,023.3 | 338.8 |
| Feb 2007 | 1,022.8 | 323.3 |
| Mar 2007 | 1,019.4 | 313.3 |
| Apr 2007 | 1,010.7 | 323.8 |
| May 2007 | 1,001.5 | 313.5 |
| Jun 2007 | 996.5 | 337.9 |
| Jul 2007 | 991.2 | 333.7 |
| Aug 2007 | 988.3 | 317.8 |
| Sep 2007 | 982.9 | 298.6 |
| Oct 2007 | 970.5 | 309.5 |
| Nov 2007 | 966.4 | 318.0 |
| Dec 2007 | 957.0 | 332.3 |
| Jan 2008 | 946.5 | 326.3 |
| Feb 2008 | 946.1 | 319.1 |
| Mar 2008 | 920.5 | 327.5 |
| Apr 2008 | 901.1 | 295.3 |
| May 2008 | 902.7 | 295.7 |
| Jun 2008 | 900.6 | 314.3 |
| Jul 2008 | 884.0 | 376.1 |
| Aug 2008 | 855.8 | 330.6 |
| Sep 2008 | 836.5 | 324.7 |
| Oct 2008 | 822.5 | 303.2 |
| Nov 2008 | 807.5 | 271.5 |
| Dec 2008 | 782.7 | 238.2 |
| Jan 2009 | 691.3 | 106.6 |
| Feb 2009 | 712.6 | 134.6 |
| Mar 2009 | 702.2 | 154.1 |
| Apr 2009 | 675.8 | 152.6 |
| May 2009 | 643.6 | 148.7 |
| Jun 2009 | 623.3 | 150.0 |
| Jul 2009 | 652.9 | 185.5 |
| Aug 2009 | 653.1 | 214.8 |
| Sep 2009 | 653.4 | 242.5 |
| Oct 2009 | 656.6 | 240.4 |
| Nov 2009 | 652.7 | 229.8 |
| Dec 2009 | 653.3 | 235.2 |
| Jan 2010 | 661.2 | 229.3 |
| Feb 2010 | 660.4 | 229.8 |
| Mar 2010 | 660.8 | 224.3 |
| Apr 2010 | 667.1 | 223.9 |
| May 2010 | 681.4 | 251.3 |
| Jun 2010 | 679.9 | 234.1 |
| Jul 2010 | 684.2 | 231.7 |
| Aug 2010 | 685.0 | 229.5 |
| Sep 2010 | 688.0 | 223.6 |
| Oct 2010 | 688.0 | 214.4 |
| Nov 2010 | 691.5 | 223.1 |
| Dec 2010 | 692.4 | 203.3 |
| Jan 2011 | 700.4 | 196.7 |
| Feb 2011 | 705.0 | 226.4 |
| Mar 2011 | 705.8 | 240.5 |
| Apr 2011 | 710.5 | 216.7 |
| May 2011 | 712.3 | 230.4 |
| Jun 2011 | 712.0 | 229.5 |
| Jul 2011 | 713.1 | 229.1 |
| Aug 2011 | 717.8 | 260.1 |
| Sep 2011 | 724.3 | 250.1 |
| Oct 2011 | 732.6 | 275.4 |
| Nov 2011 | 734.4 | 277.3 |
| Dec 2011 | 742.6 | 306.1 |
| Jan 2012 | 748.7 | 322.7 |
| Feb 2012 | 753.3 | 322.9 |
| Mar 2012 | 764.1 | 323.4 |
| Apr 2012 | 768.2 | 345.8 |
| May 2012 | 773.9 | 344.2 |
| Jun 2012 | 777.9 | 352.0 |
| Jul 2012 | 791.0 | 387.6 |
| Aug 2012 | 788.1 | 341.7 |
| Sep 2012 | 787.9 | 336.2 |
| Oct 2012 | 782.8 | 332.2 |
| Nov 2012 | 793.3 | 357.2 |
| Dec 2012 | 796.5 | 347.0 |
| Jan 2013 | 802.1 | 360.6 |
| Feb 2013 | 806.2 | 361.3 |
| Mar 2013 | 811.3 | 374.5 |
| Apr 2013 | 812.8 | 366.4 |
| May 2013 | 819.2 | 368.4 |
| Jun 2013 | 823.8 | 384.2 |
| Jul 2013 | 808.9 | 316.9 |
| Aug 2013 | 832.4 | 355.5 |
| Sep 2013 | 837.5 | 369.4 |
| Oct 2013 | 842.7 | 357.2 |
| Nov 2013 | 848.1 | 370.5 |
| Dec 2013 | 852.4 | 375.1 |
| Jan 2014 | 846.3 | 346.1 |
| Feb 2014 | 858.8 | 357.7 |
| Mar 2014 | 860.5 | 343.8 |
| Apr 2014 | 861.0 | 338.0 |
| May 2014 | 868.3 | 331.5 |
| Jun 2014 | 876.8 | 367.6 |
| Jul 2014 | 881.1 | 393.4 |
| Aug 2014 | 885.4 | 353.1 |
| Sep 2014 | 887.6 | 349.4 |
| Oct 2014 | 891.0 | 331.3 |
| Nov 2014 | 900.3 | 371.3 |
| Dec 2014 | 902.5 | 379.7 |
| Source: U.S. Bureau of Labor Statistics, Current Employment Statistics survey; and U.S. Bureau of Economic Analysis, Auto and truck seasonal adjustment, table 7 (https://apps.bea.gov/national/xls/gap_hist.xls). | ||
Gains were concentrated in durable goods manufacturing, which added 189,000 jobs in 2014. The largest job gain in durables came from transportation equipment (+60,000), in particular motor vehicles and parts (+50,000). This gain, the fifth consecutive annual increase, corresponds to gains in motor vehicle production and marks the resurgence of the motor vehicle and parts industry, which experienced dramatic employment declines during the most recent recession (see figure 7).21 Other durable goods industries that saw job growth in 2014 were fabricated metal products manufacturing (+31,000) and machinery manufacturing (+37,000). Employment growth in fabricated metals products is directly related to growth in both construction and transportation equipment, which are major users of the metal products the industry produces.22 In fact, the largest job gain within fabricated metals came from architectural and structural metals (+13,000). Job gains in machinery manufacturing—itself a significant purchaser of fabricated metal products—were also construction related and concentrated in agricultural, construction, and mining machinery manufacturing.
Employment in the information industry grew by 43,000 in 2014 and has recovered 26 percent of the 370,000 jobs lost between May 2007 and January 2012. This industry contains many component industries that have been adversely affected by the growth of the Internet. These include traditional publishing industries, such as book, newspaper, and periodical publishing—all of which have been in a long-term decline because of increased competition from their Internet equivalents. That traditional publishing is losing ground is illustrated by the fact that, among information component industries, the largest job gain (+22,000) in 2014 occurred in the Internet publishing and broadcasting and web search portals component of other information services. Traditional publishing, on the other hand, lost 8,000 jobs. While the information industry also includes industries such as data processing and website hosting, these industries have contributed little to job creation.
After several years of decline, government saw an employment increase of 74,000 in 2014. This increase came primarily from local government (+62,000), in particular local government education, which added 33,000 jobs over the year. However, the noneducation component of local government also made a turnaround in 2014, adding 29,000 jobs. State government experienced its largest over-the-year employment increase since 2008, adding 23,000 jobs, all of which came from the education component of the industry. Federal government employment continued to decline, losing 11,000 jobs over the year. By the end of 2014, the government sector had recovered only about 10 percent of the jobs lost during the 2007–2009 recession.
Education and health services did not lose jobs as a result of the most recent recession. In fact, except for a few isolated months of employment decline, this industry has experienced consistent job growth since the origination of the data series in 1990. The industry saw impressive growth in 2014, adding 488,000 jobs over the year—a growth rate of 2.3 percent. As is usually the case, this growth was concentrated in health care (+309,000). Long-term growth in the industry is largely driven by the increasing medical needs of the aging baby-boom generation.23 Health care employment growth in 2014 was concentrated in ambulatory health care services, which includes offices of physicians and outpatient care centers.
Educational services employment grew by 65,000 in 2014. This increase, the industry’s largest since 2011, was spread broadly across component industries. The largest gains occurred in the elementary and secondary schools component (+38,000), which more than doubled its 2013 job gain. Business, computer, and management training (+12,000) also saw a marked improvement over its 2013 employment performance.
As measured by CES data, the ongoing economic recovery marked a milestone in 2014, with both total private and total nonfarm employment entering an expansionary phase. About half of broad industry groups entered a period of job expansion, and others edged closer to recovery. Employment gains during the year were spread broadly across industries, and CES data on hours and real earnings indicate a stronger economy. Taken together with improvements in other prominent economic indicators, such as the unemployment rate,24 these gains have made 2014 a good year.
!--?pagebreak>!--?pagebreak>!--?pagebreak>!--?pagebreak>!--?pagebreak>John P. Mullins, and Brittney E. Forbes, "CES employment recovers in 2014," Monthly Labor Review, U.S. Bureau of Labor Statistics, April 2015, https://doi.org/10.21916/mlr.2015.10
1 The Current Employment Statistics (CES) program, which provides detailed industry data on employment, hours, and earnings of workers on nonfarm payrolls, is a monthly survey of about 143,000 businesses and government agencies, representing approximately 588,000 individual worksites. For more information on the program’s concepts and methodology, see “Technical notes to establishment survey data,” https://www.bls.gov/web/empsit/cestn.htm. To access CES data, see “Current Employment Statistics—CES (national),” https://www.bls.gov/ces. The CES data used in this article are seasonally adjusted unless otherwise noted.
2 John Coughlan, “Restaurants help feed job growth: how the leisure and hospitality industry fared after the recent employment downturn,” Beyond the Numbers, July 2014, https://www.bls.gov/opub/btn/volume-3/restaurants-help-feed-job-growth.htm.
3 Jonathan Maze, “Yes, gas prices are helping restaurants,” Nation’s Restaurant News, January 2015, http://nrn.com/blog/yes-gas-prices-are-helping-restaurants?NL=NRN-02_&cl=article_3&YM_RID=CPG06000000070364&YM_MID=1013.
4 Consumer Confidence Survey, The Conference Board, http://www.conference-board.org/data/consumerconfidence.cfm.
5 Maze, “Yes, gas prices are helping restaurants.”
6 Stephen P.A. Brown and Mine K. Yucel, “The shale gas and tight oil boom: U.S. states' economic gains and vulnerabilities” (Council on Foreign Relations Press, October 2013). See also Grant Smith, “U.S. seen as biggest oil producer after overtaking Saudi,” Bloomberg, July 2014, http://www.bloomberg.com/news/articles/2014-07-04/u-s-seen-as-biggest-oil-producer-after-overtaking-saudi.
7 According to the U.S. Energy Information Administration (www.eia.gov), the price per barrel of West Texas Intermediate crude oil fell from $105.79 in June 2014 to $59.29 in December 2014—a decline of 44 percent. Over the same period, the retail price of gasoline fell by 41 percent.
8 For a discussion of production costs, see Andy Tully, “Oil prices keep falling, but US drillers keep drilling,” The Christian Science Monitor, December 2014, http://www.csmonitor.com/Environment/Energy-Voices/2014/1210/Oil-prices-keep-falling-but-US-drillers-keep-drilling; and Roger Howard, “Is the U.S. fracking boom a bubble?” Newsweek, July 2014, http://www.newsweek.com/us-fracking-boom-bubble-258623.
9 John Kell, “Falling oil prices led to huge layoffs in January,” Fortune, February 2015, http://fortune.com/2015/02/05/job-cuts-soar-oil-price-drop/.
10 Chad Brooks, “Tech firms outsourcing more jobs than ever,” BusinessNewsDaily, March 2013.
11 Emily Richards and Frank Conlon, “Recession leads to lackluster employment in the trucking industry,” Issues in Labor Statistics, Summary 10–01 (U.S. Bureau of Labor Statistics, February 2010), https://www.bls.gov/opub/btn/archive/recession-leads-to-lackluster-employment-in-the-trucking-industry.pdf. See also “Industry analysis: trucking,” Value Line, https://www.valueline.com/Stocks/Industries/Industry_Analysis__Trucking.aspx.
12 Auto and truck seasonal adjustment, table 6 (U.S. Bureau of Economic Analysis, March 2015), https://apps.bea.gov/national/xls/gap_hist.xlsx.
13 Establishments in this subsector include mail-order houses, vending machine operators, home delivery sales, door-to-door sales, party plan sales, electronic shopping, and sales through portable stalls (e.g., street vendors, except food).
14 The credit intermediation and related activities subsector includes establishments that (1) lend funds raised from depositors, (2) lend funds raised from credit market borrowing, or (3) facilitate the lending of funds or issuance of credit by engaging in such activities as mortgage and loan brokerage.
15 The unsold homes inventory, measured by the U.S. Census Bureau as the projected inventory-clearing number of months of supply of new homes, fell to a historic low of 3.5 months in June 2003; by January 2009, it had risen to 12.2 months (https://www.census.gov/construction/nrs/pdf/fsalmon.pdf).
16 Robert Dietz, “The importance of home equity loans for remodeling” (National Association of Home Builders, Eye on Housing, December 2011). See also the Joint Center for Housing Studies’ Leading Indicator of Remodeling Activity (Harvard University) (http://www.jchs.harvard.edu/sites/jchs.harvard.edu/files/lira_historical_data_2014_q4.xlsx) and the National Association of Homebuilders’ Remodeling Market Index (http://www.nahb.org/).
17 “Guide to data sources for construction from the U.S. Census Bureau” (U.S. Census Bureau), https://www.census.gov/econ/construction.html.
18 Ibid.
19 The value of total public construction put in place, as measured by the U.S. Census Bureau, increased by 1.6 percent in 2014, after declines of between 2.8 and 5.4 percent from 2010 to 2013 (https://research.stlouisfed.org/fred2/series/TLPBLCONS/downloaddata).
20 Megan M. Barker, “Manufacturing employment hard hit during the 2007–09 recession,” Monthly Labor Review, April 2011, https://www.bls.gov/opub/mlr/2011/04/art5full.pdf.
21 Auto and truck seasonal adjustment, table 7 (U.S. Bureau of Economic Analysis, March 2015), https://apps.bea.gov/national/xls/gap_hist.xlsx.
22 Data on the inter-industry use of commodities are from input–output accounts of the U.S. Bureau of Economic Analysis (https://apps.bea.gov/iTable/index_industry_io.cfm).
23 “How baby boomers consume health care [infographic]” (Concordia University, March 2013), http://online.csp.edu/blog/healthcare/how-baby-boomers-consume-health-care-infographic; and “How the baby boomer generation is changing the U.S. healthcare system,” Huffington Post, August 2013, http://www.huffingtonpost.com/visualnewscom/us-health-care-how-the-baby-boomer_b_3369175.html.
24 Eleni Theodossiou Sherman and Janie-Lynn Kang, “Continued improvement in U.S. labor market in 2014,” Monthly Labor Review, April 2015, https://www.bls.gov/opub/mlr/2015/article/continued-improvement-in-u-s-labor-market-in-2014.htm.