
An official website of the United States government
An official website of the United States government
The .gov means it's official.
Federal government websites often end in .gov or .mil. Before sharing sensitive information,
make sure you're on a federal government site.
The site is secure.
The
https:// ensures that you are connecting to the official website and that any
information you provide is encrypted and transmitted securely.

Crossref 0
Labor Shortages: What Is the Problem?, Intereconomics, 2024.
To help mark the Monthly Labor Review’s centennial, the editors invited several producers and users of BLS data to take a look back at the last 100 years. This installment of the anniversary series comes from the Bureau's Job Openings and Labor Turnover Survey (JOLTS) program. JOLTS produces labor demand data on job openings, hires, and separations in the United States. The first section of this article provides a brief overview of the JOLTS program. The second section examines the availability and definitions of labor demand data from other countries. Analyses of countries with comparable data are discussed in the final section.
Since 1999, the Job Openings and Labor Turnover Survey (JOLTS) of the U.S. Bureau of Labor Statistics (BLS) has produced job openings and labor turnover data in order to assess the unmet demand for workers in the labor market. The JOLTS program measures job openings, hires, and separations on a monthly basis by industry and geographic region.1 The program gauges labor demand by collecting data each month from a sample of approximately 16,000 nonfarm business establishments. JOLTS labor demand data complements labor supply data with information on current labor demand, providing a valuable resource for data users to examine factors that reflect the health of the U.S. economy. Labor demand data are used to examine churn in the labor force, labor demand versus labor supply, business cycles, and trends by industry and geographic region.
Prior to the inception of the current JOLTS program, a federal–state cooperative BLS program called the Labor Turnover Survey (LTS) published turnover data from 1959 to 1981. Questions on job vacancies were added to the LTS in 1969. BLS produced vacancy rates from 1969 through 1973 for nine selected manufacturing industries and in selected states and metropolitan areas.2 While limited to the manufacturing sector, historical LTS statistics were used for labor market analysis and research. Layoff, accession, and quit rates were regarded as leading economic indicators.3 Additionally, the job vacancies series was considered a coincident indicator. Accession rates were used by state agencies to compare, by area, the number of employees placed through the agencies with the total number of hires reported by employers.4
A measure of labor demand is necessary for thorough analysis of the labor market and as a complement to labor supply measures. There are many countries that produce various types of labor demand data. Although definitions of data elements differ across countries, the purpose is to garner information about the status of labor demand within individual economies. Labor market churn (movement to and from employment through hires and separations), as well as the relationship between job openings (labor demand) and unemployment (labor supply), can provide valuable information about an economy.
Comprehensive appendices at the end of this article list the statistical organization, survey name, data elements collected, and frequency of the respective surveys. Appendix 1 includes countries not part of the European Union (EU) that produce labor demand data, and appendix 2 lists countries that are members of, or closely associated with, the European Union. The EU countries, along with Norway and the Republic of Macedonia, are listed separately in appendix 2. All of these countries provide job vacancies to the EU which are centrally available on the Eurostat website. This information was primarily compiled from statistical websites and correspondence.
Table 1 presents definitions of job openings for seven non-EU countries. The definitions contain similar elements, including the timeframe that the job opening is available, the presence of active recruitment by employers to fill the vacancy, and a specification that the recruited employee be from outside the establishment.
| Country, statistical organization | Definition of job opening |
|---|---|
| United States, Bureau of Labor Statistics(2) | A job opening entails that (1) a specific position exists and there is work available for that position, (2) work could start within 30 days whether or not a suitable candidate is found during that time, and (3) the employer is actively recruiting from outside the establishment to fill the position. |
| Australia, Bureau of Statistics(3) | A job vacancy is a job available for immediate filling on the actual survey reference day and for which employers have undertaken recruitment action. Recruitment action includes efforts to fill vacancies by advertising, by factory notices, by notifying public or private employment agencies or trade unions and by contacting, interviewing or selecting applicants already registered with the business or organization. |
| The Government of the Hong Kong Special Administrative Region of the People’s Republic of China, Census and Statistics Department(4) | Vacancies refer to unfilled job openings which are immediately available, and for which active recruitment steps are being taken on the survey reference date. However, vacancies at construction sites include only those vacancies of manual workers. |
| Israel, Central Bureau of Statistics(5) | Job Vacancy is defined as a post (newly created, unoccupied or about to become vacant) (i) for which the employer is taking active steps to find a suitable candidate from outside the enterprise concerned and is prepared to take more steps and (ii) which the employer intends to fill either immediately or in the near future. Under this definition, a job vacancy should be open to candidates from outside an enterprise. |
| Philippines, Bureau of Labor and Employment Statistics(6) | Existing job vacancies refer to the number of unfilled job openings, which are immediately available for placement and for which active recruitment steps are being undertaken anytime during the reference period. |
| Singapore, Ministry of Manpower(7) | Job vacancy for a quarter refers to the number of unfilled posts at the end of a quarter for which an establishment is actively recruiting employees from outside the establishment. They exclude positions for which the employees have been appointed, but have not yet commenced duty; or positions open only to internal transfers or promotion. Recruitment action to fill a post includes advertising in newspapers, posting notices on the internet (e.g. on online job banks), making “word-of-mouth announcements,” soliciting employees through employment agencies or job fairs, contacting or interviewing registered job applicants. |
| Switzerland, Federal Statistical Office(8) | The term “vacancies” refers to a position (new, unfilled or soon to be vacant position) that the employer intends to fill either immediately or in the near future. Moreover, a position is deemed to be vacant if action has been taken, or will be taken very shortly, to recruit a new member of staff. |
| Notes: (2) Job Openings and Labor Turnover Survey (JOLTS) data definitions are available on the Bureau of Labor Statistics (BLS) website at https://www.bls.gov/jlt/jltdef.htm. (3) “Chapter 11. Job Vacancies,” Concepts, Sources, and Methods (Australian Bureau of Statistics, Apr 2007), http://www.abs.gov.au/Ausstats/abs@.nsf/Latestproducts/6354.0Glossary1May%202015?opendocument&tabname=Notes&prodno=6354.0&issue=May%202015&num=&view=. (4) "Employment and Vacancies - Concepts and Methods,” (Census and Statistics Department, The Government of the Hong Kong Special Administrative Region), http://www.censtatd.gov.hk/hkstat/sub/sc452.jsp. (5) “Job vacancy survey – Definitions,” Definition, Classification (Israel Central Bureau of Statistics),http://www1.cbs.gov.il/reader/?MIval=cw_usr_view_SHTML&ID=871. (6) “G. Concepts and Definitions, Metadata,” Labor Turnover Survey, (Republic of the Philippines, Philippine Statistical Authority, Bureau of Labor and Employment Statistics), http://www.bles.dole.gov.ph/SURVEY%20RESULTS/LTS/LTS.html. (7) Singapore, Ministry of Manpower, Job Vacancy Concepts and Definitions, http://stats.mom.gov.sg/SL/Pages/Job-Vacancy-Concepts-and-Definitions.aspx?Flag=87&TRMID=649&PageNo=1. (8) “Definitions,” 3 Employment and Income, (Swiss Statistics, Federal Department of Home Affairs FDHA, Federal Statistical Office FAO). | |
The definitions in table 1 exhibit important similarities. Most notably, each includes a timeframe of job availability. BLS, the Australian Bureau of Statistics, and the Singapore Ministry of Manpower have specific day-related criteria. BLS states that “work could start within 30 days whether or not a suitable candidate is found,” and the Australian Bureau of Statistics states that the vacancy is “available for immediate filling on the actual survey reference day.” The Singapore Ministry of Manpower collects the number of unfilled posts at the end of a quarter. Israel and Switzerland reference jobs that are available “immediately or in the near future,” while the remaining countries state that the job must be available immediately. Active recruitment is another common criterion found in all definitions in the table. Finally, a requirement that the recruited employee be from outside the establishment is a common element in most of the definitions. The United States, Australia, Israel, and Singapore include this criterion.
Despite these similarities, there are several notable differences in the job openings definitions. The Government of the Hong Kong Special Administrative Region of the People’s Republic of China designates construction sites as areas where manual positions only are counted as vacancies. According to the Israeli and Swiss definitions, the position does not necessarily have to be vacant at the time the job vacancy is reported. The Australian and Singaporean definitions offer detailed examples of the types of recruitment activity that can be undertaken.
The countries presented in table 1 survey establishments or enterprises and produce job openings data at the total level. The availability of more detailed levels and characteristics varies from country to country and can include data by industry, region or state, occupation, and firm size. Available data series range from one-time surveys to series lasting 20 years or longer. Data are published monthly, quarterly, or annually.
For countries that are members of, or closely associated with, the European Union, the EU describes its job vacancy statistics as follows:
The national statistical authorities responsible for compiling job vacancy statistics send these statistics to Eurostat. Their data are used to compile the job vacancy rate for the EU and the euro area.
Some of the data provided by the Member States fails to match common criteria and there may be differences in the coverage of the data between countries; as a result, there are currently no EU-28 totals for the actual numbers of job vacancies or occupied posts. The EU-28 and euro area job vacancy rates are calculated on the basis of the information that is available.5
Because of the coverage differences between countries, breakdowns by economic activity and enterprise size are not currently available for the EU as a whole. 6
Eurostat defines job vacancies as follows:
A paid post that is newly created, unoccupied, or about to become vacant: (a) for which the employer is taking active steps and is prepared to take further steps to find a suitable candidate from outside the enterprise concerned; and (b) which the employer intends to fill either immediately or within a specific period of time. A vacant post that is only open to internal candidates is not treated as a 'job vacancy'. The job vacancy rate (JVR) measures the proportion of total posts that are vacant, according to the definition of job vacancy above, expressed as a percentage of the number of job vacancies divided by the sum of the number of occupied posts plus the number of job vacancies all multiplied by 100.7
Eurostat provides job vacancy data on a quarterly and annual basis.
The majority of EU countries provide job vacancy statistics to Eurostat and make that data available on their individual statistical agencies’ websites. France and Sweden produce alternative statistics.
The National Institute of Statistics and Economic Studies (INSEE) of France produces a statistic called registered job vacancies. Registered job vacancies are described as follows:
Total job vacancies registered over a given period (year, month) are the permanent (more than 6 months), temporary (1 to 6 months) or casual (less than 1 month) job vacancies filed by employers in local employment agencies in the course of the year. The statistics on job vacancies registered in the course of a given period (month, year) are compiled by the statistics department of the Ministry for Labour, drawn from all the vacancies filed with Pôle Emploi.8
Statistics Sweden produces data on job openings and provides that data to Eurostat. It also produces job vacancy statistics. The survey description and definitions read as follows:
The Job Vacancy Survey is an enterprise-based survey covering both the public and the private sector. The purpose of the survey is to contribute information about the labour demand. The results are published quarterly. The number of job openings follows Eurostat’s definition of vacancies. Unmet demand is measured by vacancies, defined as unoccupied job openings to be filled immediately.9
A number of countries produce hires data and separations data. These countries include Estonia, Japan, New Zealand, the Philippines, Singapore, and the United States. Table 2 shows the definitions used by these countries.
| Country, statistical organization | Definition of hires(1) | Definition of separations(2) |
|---|---|---|
| United States, Bureau of Labor Statistics(3) | Hires are defined as the total number of additions to the payroll occurring at any time during the reference month, including both new and rehired employees; full-time, part-time, permanent, short-term, and seasonal employees; employees recalled to the location after a layoff (i.e., formal suspension from pay status) lasting more than 7 days; on-call or intermittent employees who returned to work after having been formally separated; workers who were hired and separated during the month; and employees transferred from other locations of the same business. | Separations are defined as the total number of terminations of employment occurring at any time during the reference month, and are reported by type of separation: quits, layoffs and discharges, and other separations. |
| Estonia, Statistics Estonia(4) | The number of engaged employees includes employees with whom a contract has been concluded for a fixed or unfixed period (including contracts of seasonal work), and persons working under employment contracts, service contracts, and the Public Service Act. | The number of left employees is defined as dismissed employees and employees who leave voluntarily. |
| Japan, Ministry of Health, Labour, and Welfare | Monthly Labour Survey(5): The total increase of regular employees is defined as “newly hired employees, employees transferred to the establishments (including employees transferred from some other establishment of the same organization) and so on.” | Monthly Labour Survey: The total decrease of regular employees is defined as “retired employees, employees transferred from the establishments (including employees transferred to some other establishment of the same organization) and so on." |
| Survey on Employment Trends(6): Hired employees are defined as “persons hired as regular employees under employment contracts newly concluded during the reference period. This also includes daily workers and the like who had been excluded from the regular employee classification, but who, because of repeated renewal of their employment contracts, satisfy the condition of regular employee during the reference period; the persons who, after mandatory retirement, continued to be employed at the same enterprise as non-regular employees or temporary employees; new entrants from affiliated enterprises (including transferred employees, but excluding dispatched workers).” | Survey on Employment Trends: Separated employees are defined as “a regular employee who has retired or been dismissed from an establishment during the period covered by the survey, including persons transferred to another enterprise or returning from transfer, but excluding persons moving from an establishment within the same enterprise.” | |
| New Zealand, Statistics New Zealand(7) | Accessions are defined as the number of new employees who have joined employers since the previous reference date. | Separations are defined as the number of employees who have left employers since the previous reference date. |
| Philippines, Bureau of Labor and Employment Statistics(8) | New hires (accessions) refer to permanent or temporary additions to employment in the enterprise due to (1) expansion of business activity and (2) replacement of separated workers and employment resulting from changes in methods/technology of production or service. | Separations refer to terminations of employment due to (a) quits or terminations initiated by the employees and (b) layoffs or terminations initiated by the employers due to economic reasons (e.g., lack of market, financial losses, redundancy) and non-economic reasons (e.g., gross negligence, AWOL). |
| Singapore, Ministry of Manpower(9) | Average monthly recruitment rate during a quarter is defined as the average number of persons recruited in a month during the quarter divided by the average number of employees in the establishment. The annual figures are the simple average of the quarterly figures. | Average monthly resignation rate during a quarter is defined as the average number of persons who resigned in a month during the quarter divided by the average number of employees in the establishment. The annual figures are the simple average of the quarterly figures. |
| Notes: (2) Separations may be referred to using other terms depending upon the country being discussed. (3) U.S. Bureau of Labor Statistics, Job Openings and Labor Turnover Survey, Data Definitions, https://www.bls.gov/opub/hom/. (4) Assistance with the definitions for the data elements discussed was provided by Vilma Mere, Leading Statistician, Wages Statistics Service, Statistics Estonia, October 28, 2013. http://www.stat.ee/65226?highlight=left,employees. (5) Monthly Labour Survey (Japanese Ministry of Health, Labour and Welfare), http://www.mhlw.go.jp/english/database/db-slms/dl/slms-01.pdf. (6) Survey on Employment Trends (Japanese Ministry of Health and Welfare), http://www.mhlw.go.jp/english/database/db-l/employment_trends_2010.html. (7) “Definitions and Measures,” Guide to Interpreting the LEED Data (Statistics New Zealand), http://www.stats.govt.nz/browse_for_stats/income-and-work/employment_and_unemployment/guide-interpreting-the-leed-data/definitions-of-measures.aspx. (8) “G. Concepts and Definitions, Metadata,” Labor Turnover Survey (Republic of the Philippines, Philippine Statistical Authority, Bureau of Labor and Employment Statistics), http://www.bles.dole.gov.ph/SURVEY%20RESULTS/LTS/LTS.html. (9) Singapore, Ministry of Manpower, Labour Turnover Concepts and Definitions, http://stats.mom.gov.sg/SL/Pages/Labour-Turnover-Concepts-and-Definitions.aspx?Flag=90&TRMID=669&PageNo=1. | ||
Japan’s Ministry of Health, Labour and Welfare calculates accession rates and separation rates, by industry, using data collected via the Monthly Labour Survey. According to the Ministry survey description, the aim of the survey is “to clarify changes in employment, earnings and hours worked, on both national and a prefectural level.”10
Since 1999, Statistics New Zealand has produced quarterly data detailing the worker turnover rate. The rate, a measure of workforce stability, is defined as “the ratio of the average of the total accessions and separations to the average of the total jobs in the reference quarter (t) and the previous quarter (t−1).”11
Labor demand data complement other data sources, particularly labor supply data, and help data users examine factors that influence a nation’s economy. These data, when available, are used to examine labor force churn, labor demand and supply, business cycles, and industry and geographic economic conditions.
According to the International Monetary Fund (IMF), a global recession can be defined as “a contraction in world real per capita GDP accompanied by a broad decline in various other measures of global economic activity.”12 There have been four global recessions in the last 50 years with the most recent being the year-long 2009 global recession.13 While the number of job openings, hires, and separations decreased during the 2009 global recession, labor demand and labor market churn continued. Using time series that encompass the most recent global recession, the following figures examine labor demand data from several countries.
| Year/Quarter | Euro area | United States |
|---|---|---|
| 2003 Q3 | 1.6 | 2.5 |
| 2003 Q4 | 1.4 | 2.3 |
| 2004 Q1 | 1.7 | 2.5 |
| 2004 Q2 | 1.7 | 2.7 |
| 2004 Q3 | 1.5 | 2.8 |
| 2004 Q4 | 1.5 | 2.5 |
| 2005 Q1 | 1.5 | 2.8 |
| 2005 Q2 | 1.5 | 3.0 |
| 2005 Q3 | 1.5 | 3.1 |
| 2005 Q4 | 1.9 | 2.9 |
| 2006 Q1 | 1.8 | 3.1 |
| 2006 Q2 | 2.0 | 3.2 |
| 2006 Q3 | 2.1 | 3.2 |
| 2006 Q4 | 2.3 | 3.0 |
| 2007 Q1 | 2.4 | 3.2 |
| 2007 Q2 | 2.1 | 3.3 |
| 2007 Q3 | 2.2 | 3.2 |
| 2007 Q4 | 2.2 | 2.8 |
| 2008 Q1 | 2.1 | 2.9 |
| 2008 Q2 | 2.0 | 2.8 |
| 2008 Q3 | 1.8 | 2.6 |
| 2008 Q4 | 1.8 | 2.1 |
| 2009 Q1 | 1.5 | 2.0 |
| 2009 Q2 | 1.5 | 1.8 |
| 2009 Q3 | 1.4 | 1.8 |
| 2009 Q4 | 1.3 | 1.7 |
| 2010 Q1 | 1.4 | 2.0 |
| 2010 Q2 | 1.4 | 2.3 |
| 2010 Q3 | 1.4 | 2.2 |
| 2010 Q4 | 1.6 | 2.1 |
| 2011 Q1 | 1.8 | 2.3 |
| 2011 Q2 | 1.7 | 2.4 |
| 2011 Q3 | 1.6 | 2.6 |
| 2011 Q4 | 1.7 | 2.3 |
| 2012 Q1 | 1.7 | 2.7 |
| 2012 Q2 | 1.6 | 2.8 |
| 2012 Q3 | 1.4 | 2.7 |
| 2012 Q4 | 1.6 | 2.5 |
| 2013 Q1 | 1.6 | 2.8 |
| 2013 Q2 | 1.5 | 2.9 |
| 2013 Q3 | 1.4 | 2.9 |
| 2013 Q4 | 1.6 | 2.7 |
| 2014 Q1 | 1.7 | 2.9 |
| 2014 Q2 | 1.7 | 3.3 |
| 2014 Q3 | 1.6 | 3.4 |
| 2014 Q4 | 1.8 | 3.2 |
| 2015 Q1 | 1.7 | 3.5 |
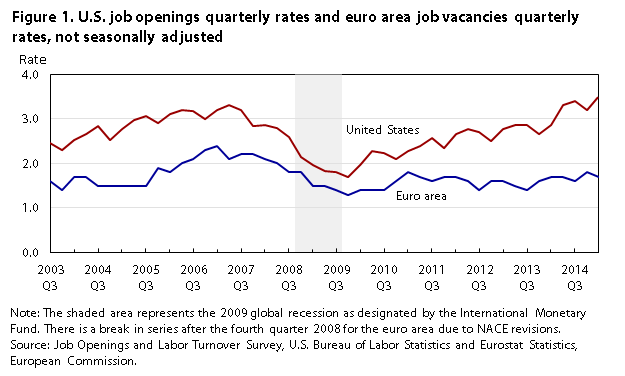
Figure 1 compares the euro area quarterly vacancy rate with the JOLTS job openings rate (adjusted on a quarterly basis) before and after the 2009 global recession. Note that while the global recession covers the four quarters of 2009, the economies of the euro area countries and the United States experienced recessions with differing quarterly periods. According to the Center for Economic and Policy Research, Euro Area Business Cycle Dating Committee, the euro area recession began in the first quarter of 2008 and ended in the second quarter of 2009.14 The United States experienced a recession from December 2007 through June 2009 as determined by the National Bureau of Economic Research, which would be reflected in the quarterly data from the fourth quarter of 2007 through the second quarter of 2009.15
The job openings and job vacancy rates for both the United States and the euro area series began to decline prior to the start of the 2009 global recession and started to recover at the end of 2009. In the fourth quarter of 2009, euro area and U.S. rates reached lows of 1.3 percent and 1.7 percent, respectively.
Job openings, representing labor demand, is a complementary statistic to unemployment, which represents labor supply. As a labor market contracts, workers experience job loss and can have a difficult time finding a new job. Job availability declines because many establishments are forced to slow or freeze hiring, while others go out of business. In order to remain in business, many establishments cease hiring and implement layoffs and discharges to decrease the number of employees on their payrolls and control costs. Thus, the number of available job openings decreases and the number of people looking for a job may increase. As the labor market expands, job availability can increase and the number of people looking for a job may decline.
| Date | Germany | United States |
|---|---|---|
| Jan 2007 | 9.7 | 1.6 |
| Feb 2007 | 9.2 | 1.5 |
| Mar 2007 | 9.0 | 1.4 |
| Apr 2007 | 8.8 | 1.5 |
| May 2007 | 8.8 | 1.5 |
| June 2007 | 8.8 | 1.5 |
| July 2007 | 8.8 | 1.6 |
| Aug 2007 | 8.7 | 1.6 |
| Sep 2007 | 8.7 | 1.6 |
| Oct 2007 | 8.7 | 1.7 |
| Nov 2007 | 8.7 | 1.7 |
| Dec 2007 | 8.7 | 1.8 |
| Jan 2008 | 8.6 | 1.8 |
| Feb 2008 | 8.5 | 1.9 |
| Mar 2008 | 8.4 | 1.9 |
| Apr 2008 | 8.3 | 2.0 |
| May 2008 | 8.3 | 2.1 |
| June 2008 | 8.1 | 2.3 |
| July 2008 | 8.1 | 2.4 |
| Aug 2008 | 8.1 | 2.6 |
| Sep 2008 | 8.2 | 3.0 |
| Oct 2008 | 8.4 | 3.1 |
| Nov 2008 | 8.7 | 3.4 |
| Dec 2008 | 9.1 | 3.7 |
| Jan 2009 | 9.5 | 4.4 |
| Feb 2009 | 9.9 | 4.6 |
| Mar 2009 | 10.5 | 5.4 |
| Apr 2009 | 11.1 | 6.1 |
| May 2009 | 11.6 | 6.0 |
| June 2009 | 12.2 | 6.2 |
| July 2009 | 12.5 | 6.8 |
| Aug 2009 | 12.4 | 6.5 |
| Sep 2009 | 12.3 | 6.2 |
| Oct 2009 | 12.0 | 6.5 |
| Nov 2009 | 11.7 | 6.3 |
| Dec 2009 | 11.2 | 6.1 |
| Jan 2010 | 10.9 | 5.6 |
| Feb 2010 | 10.7 | 5.9 |
| Mar 2010 | 10.4 | 5.7 |
| Apr 2010 | 9.9 | 4.9 |
| May 2010 | 9.4 | 5.1 |
| June 2010 | 9.0 | 5.3 |
| July 2010 | 8.7 | 5.0 |
| Aug 2010 | 8.5 | 5.1 |
| Sep 2010 | 8.3 | 5.2 |
| Oct 2010 | 8.0 | 4.8 |
| Nov 2010 | 7.8 | 4.9 |
| Dec 2010 | 7.6 | 4.9 |
| Jan 2011 | 7.4 | 4.8 |
| Feb 2011 | 6.9 | 4.5 |
| Mar 2011 | 6.8 | 4.4 |
| Apr 2011 | 6.6 | 4.5 |
| May 2011 | 6.5 | 4.6 |
| June 2011 | 6.4 | 4.4 |
| July 2011 | 6.3 | 4.0 |
| Aug 2011 | 6.2 | 4.4 |
| Sep 2011 | 6.0 | 3.9 |
| Oct 2011 | 5.9 | 4.0 |
| Nov 2011 | 5.8 | 4.1 |
| Dec 2011 | 5.8 | 3.7 |
| Jan 2012 | 5.8 | 3.5 |
| Feb 2012 | 5.8 | 3.6 |
| Mar 2012 | 5.9 | 3.3 |
| Apr 2012 | 5.9 | 3.5 |
| May 2012 | 5.9 | 3.4 |
| June 2012 | 5.9 | 3.4 |
| July 2012 | 6.0 | 3.5 |
| Aug 2012 | 6.1 | 3.4 |
| Sep 2012 | 6.2 | 3.3 |
| Oct 2012 | 6.3 | 3.3 |
| Nov 2012 | 6.4 | 3.2 |
| Dec 2012 | 6.5 | 3.4 |
| Jan 2013 | 6.6 | 3.3 |
| Feb 2013 | 6.6 | 3.0 |
| Mar 2013 | 6.7 | 3.0 |
| Apr 2013 | 6.8 | 3.1 |
| May 2013 | 6.9 | 3.0 |
| June 2013 | 6.9 | 3.0 |
| July 2013 | 6.9 | 3.0 |
| Aug 2013 | 6.9 | 2.9 |
| Sep 2013 | 6.9 | 2.8 |
| Oct 2013 | 6.8 | 2.7 |
| Nov 2013 | 6.8 | 2.7 |
| Dec 2013 | 6.7 | 2.6 |
| Jan 2014 | 6.6 | 2.6 |
| Feb 2014 | 6.6 | 2.5 |
| Mar 2014 | 6.5 | 2.5 |
| Apr 2014 | 6.1 | 2.2 |
| May 2014 | 6.1 | 2.1 |
| June 2014 | 6.1 | 2.0 |
| July 2014 | 6.0 | 2.0 |
| Aug 2014 | 5.8 | 1.9 |
| Sep 2014 | 5.8 | 2.0 |
| Oct 2014 | 5.6 | 1.9 |
| Nov 2014 | 5.5 | 1.9 |
| Dec 2014 | 5.4 | 1.8 |
| Jan 2015 | 5.4 | 1.8 |
| Feb 2015 | 5.2 | 1.7 |
| Mar 2015 | 5.1 | 1.7 |
| Apr 2015 | 5.1 | 1.6 |
| May 2015 | 5.1 | 1.6 |
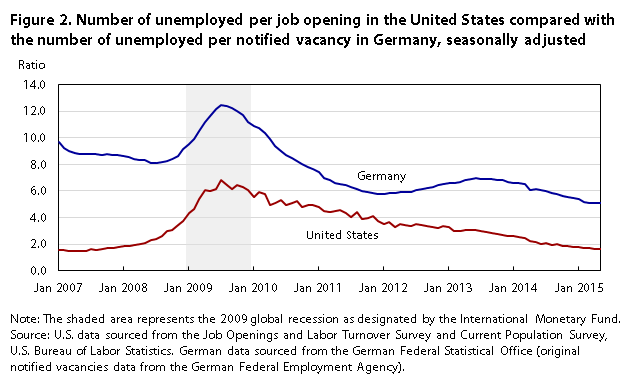
Figure 2 shows the ratio of the number of unemployed to the number of job openings (vacancies) in the United States and Germany. A high ratio indicates that more people are competing for the same job. Note that, in both countries, this ratio was much higher during the 2009 global recession. In July 2009, U.S. and German ratios peaked, at 6.8 and 12.5, respectively.
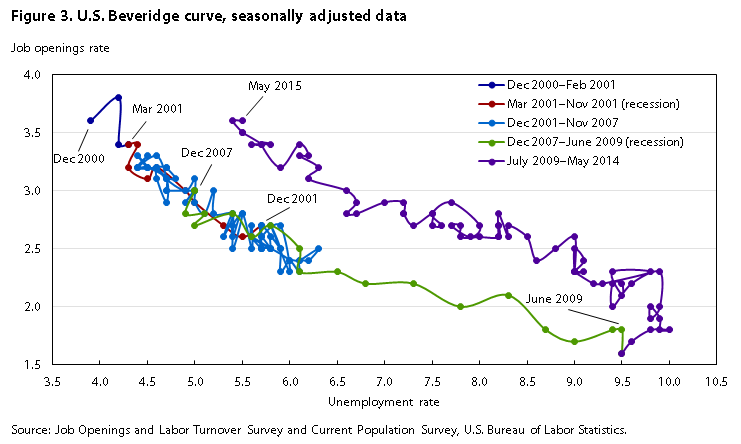
Job openings and unemployment have an inverse relationship, which is represented by the Beveridge curve. The Beveridge curve plots the job openings rate with respect to the unemployment rate over time. The curve can be used to identify forces of change in the labor market. Demand-related expansions and contractions show movement along the curve, indicating changes related to the business cycle. During an economic expansion, job openings are high and unemployment is low; during an economic contraction, job openings are low and unemployment is high. Other types of changes in the labor market can shift the curve toward or away from the axis. A shift in the curve can indicate structural change, a change in labor force participation, or various other changes.
| Date | Job openings rate | Unemployment rate |
|---|---|---|
| Dec-00 | 3.6 | 3.9 |
| Jan-01 | 3.8 | 4.2 |
| Feb-01 | 3.4 | 4.2 |
| Mar-01 | 3.4 | 4.3 |
| Apr-01 | 3.4 | 4.4 |
| May-01 | 3.2 | 4.3 |
| Jun-01 | 3.1 | 4.5 |
| Jul-01 | 3.2 | 4.6 |
| Aug-01 | 3.0 | 4.9 |
| Sep-01 | 2.9 | 5.0 |
| Oct-01 | 2.7 | 5.3 |
| Nov-01 | 2.6 | 5.5 |
| Dec-01 | 2.7 | 5.7 |
| Jan-02 | 2.7 | 5.7 |
| Feb-02 | 2.5 | 5.7 |
| Mar-02 | 2.7 | 5.7 |
| Apr-02 | 2.5 | 5.9 |
| May-02 | 2.6 | 5.8 |
| Jun-02 | 2.5 | 5.8 |
| Jul-02 | 2.5 | 5.8 |
| Aug-02 | 2.6 | 5.7 |
| Sep-02 | 2.5 | 5.7 |
| Oct-02 | 2.6 | 5.7 |
| Nov-02 | 2.7 | 5.9 |
| Dec-02 | 2.3 | 6.0 |
| Jan-03 | 2.7 | 5.8 |
| Feb-03 | 2.5 | 5.9 |
| Mar-03 | 2.3 | 5.9 |
| Apr-03 | 2.4 | 6.0 |
| May-03 | 2.4 | 6.1 |
| Jun-03 | 2.5 | 6.3 |
| Jul-03 | 2.4 | 6.2 |
| Aug-03 | 2.4 | 6.1 |
| Sep-03 | 2.3 | 6.1 |
| Oct-03 | 2.4 | 6.0 |
| Nov-03 | 2.5 | 5.8 |
| Dec-03 | 2.5 | 5.7 |
| Jan-04 | 2.5 | 5.7 |
| Feb-04 | 2.6 | 5.6 |
| Mar-04 | 2.5 | 5.8 |
| Apr-04 | 2.6 | 5.6 |
| May-04 | 2.7 | 5.6 |
| Jun-04 | 2.5 | 5.6 |
| Jul-04 | 2.8 | 5.5 |
| Aug-04 | 2.6 | 5.4 |
| Sep-04 | 2.7 | 5.4 |
| Oct-04 | 2.8 | 5.5 |
| Nov-04 | 2.5 | 5.4 |
| Dec-04 | 2.8 | 5.4 |
| Jan-05 | 2.6 | 5.3 |
| Feb-05 | 2.8 | 5.4 |
| Mar-05 | 2.8 | 5.2 |
| Apr-05 | 3.0 | 5.2 |
| May-05 | 2.8 | 5.1 |
| Jun-05 | 2.9 | 5.0 |
| Jul-05 | 3.0 | 5.0 |
| Aug-05 | 2.9 | 4.9 |
| Sep-05 | 3.0 | 5.0 |
| Oct-05 | 3.0 | 5.0 |
| Nov-05 | 3.1 | 5.0 |
| Dec-05 | 3.0 | 4.9 |
| Jan-06 | 3.1 | 4.7 |
| Feb-06 | 3.1 | 4.8 |
| Mar-06 | 3.2 | 4.7 |
| Apr-06 | 3.2 | 4.7 |
| May-06 | 3.2 | 4.6 |
| Jun-06 | 3.1 | 4.6 |
| Jul-06 | 2.9 | 4.7 |
| Aug-06 | 3.1 | 4.7 |
| Sep-06 | 3.2 | 4.5 |
| Oct-06 | 3.2 | 4.4 |
| Nov-06 | 3.3 | 4.5 |
| Dec-06 | 3.2 | 4.4 |
| Jan-07 | 3.2 | 4.6 |
| Feb-07 | 3.2 | 4.5 |
| Mar-07 | 3.3 | 4.4 |
| Apr-07 | 3.2 | 4.5 |
| May-07 | 3.2 | 4.4 |
| Jun-07 | 3.3 | 4.6 |
| Jul-07 | 3.1 | 4.7 |
| Aug-07 | 3.2 | 4.6 |
| Sep-07 | 3.1 | 4.7 |
| Oct-07 | 3.0 | 4.7 |
| Nov-07 | 3.0 | 4.7 |
| Dec-07 | 3.0 | 5.0 |
| Jan-08 | 3.0 | 5.0 |
| Feb-08 | 2.8 | 4.9 |
| Mar-08 | 2.8 | 5.1 |
| Apr-08 | 2.7 | 5.0 |
| May-08 | 2.8 | 5.4 |
| Jun-08 | 2.6 | 5.6 |
| Jul-08 | 2.7 | 5.8 |
| Aug-08 | 2.5 | 6.1 |
| Sep-08 | 2.3 | 6.1 |
| Oct-08 | 2.3 | 6.5 |
| Nov-08 | 2.2 | 6.8 |
| Dec-08 | 2.2 | 7.3 |
| Jan-09 | 2.0 | 7.8 |
| Feb-09 | 2.1 | 8.3 |
| Mar-09 | 1.8 | 8.7 |
| Apr-09 | 1.7 | 9.0 |
| May-09 | 1.8 | 9.4 |
| Jun-09 | 1.8 | 9.5 |
| Jul-09 | 1.6 | 9.5 |
| Aug-09 | 1.7 | 9.6 |
| Sep-09 | 1.8 | 9.8 |
| Oct-09 | 1.8 | 10.0 |
| Nov-09 | 1.8 | 9.9 |
| Dec-09 | 1.9 | 9.9 |
| Jan-10 | 2.0 | 9.8 |
| Feb-10 | 1.9 | 9.8 |
| Mar-10 | 2.0 | 9.9 |
| Apr-10 | 2.3 | 9.9 |
| May-10 | 2.2 | 9.6 |
| Jun-10 | 2.0 | 9.4 |
| Jul-10 | 2.2 | 9.4 |
| Aug-10 | 2.2 | 9.5 |
| Sep-10 | 2.1 | 9.5 |
| Oct-10 | 2.3 | 9.4 |
| Nov-10 | 2.3 | 9.8 |
| Dec-10 | 2.2 | 9.3 |
| Jan-11 | 2.2 | 9.2 |
| Feb-11 | 2.3 | 9.0 |
| Mar-11 | 2.3 | 9.0 |
| Apr-11 | 2.3 | 9.1 |
| May-11 | 2.3 | 9.0 |
| Jun-11 | 2.4 | 9.1 |
| Jul-11 | 2.5 | 9.0 |
| Aug-11 | 2.3 | 9.0 |
| Sep-11 | 2.6 | 9.0 |
| Oct-11 | 2.5 | 8.8 |
| Nov-11 | 2.4 | 8.6 |
| Dec-11 | 2.6 | 8.5 |
| Jan-12 | 2.7 | 8.3 |
| Feb-12 | 2.6 | 8.3 |
| Mar-12 | 2.8 | 8.2 |
| Apr-12 | 2.6 | 8.2 |
| May-12 | 2.7 | 8.2 |
| Jun-12 | 2.7 | 8.2 |
| Jul-12 | 2.6 | 8.2 |
| Aug-12 | 2.6 | 8.0 |
| Sep-12 | 2.6 | 7.8 |
| Oct-12 | 2.7 | 7.8 |
| Nov-12 | 2.7 | 7.7 |
| Dec-12 | 2.6 | 7.9 |
| Jan-13 | 2.7 | 8.0 |
| Feb-13 | 2.9 | 7.7 |
| Mar-13 | 2.8 | 7.5 |
| Apr-13 | 2.7 | 7.6 |
| May-13 | 2.7 | 7.5 |
| Jun-13 | 2.8 | 7.5 |
| Jul-13 | 2.7 | 7.3 |
| Aug-13 | 2.8 | 7.2 |
| Sep-13 | 2.8 | 7.2 |
| Oct-13 | 2.9 | 7.2 |
| Nov-13 | 2.9 | 7.0 |
| Dec-13 | 2.8 | 6.7 |
| Jan-14 | 2.8 | 6.6 |
| Feb-14 | 2.9 | 6.7 |
| Mar-14 | 3.0 | 6.6 |
| Apr-14 | 3.1 | 6.2 |
| May-14 | 3.2 | 6.3 |
| Jun-14 | 3.3 | 6.1 |
| Jul-14 | 3.3 | 6.2 |
| Aug-14 | 3.4 | 6.1 |
| Sep-14 | 3.2 | 5.9 |
| Oct-14 | 3.4 | 5.7 |
| Nov-14 | 3.4 | 5.8 |
| Dec-14 | 3.4 | 5.6 |
| Jan-15 | 3.4 | 5.7 |
| Feb-15 | 3.5 | 5.5 |
| Mar-15 | 3.5 | 5.5 |
| Apr-15 | 3.6 | 5.4 |
| May-15 | 3.6 | 5.5 |
Figure 3 shows the U.S. Beveridge curve with data reflecting the impact of recessionary periods from March 2001 to November 2001 and December 2007 through June 2009.
| Date | Vacancy rate | Unemployment rate |
|---|---|---|
| Apr-Jun 2001 | 2.5 | 5.0 |
| May-Jul 2001 | 2.5 | 5.0 |
| Jun-Aug 2001 | 2.5 | 5.1 |
| Jul-Sep 2001 | 2.5 | 5.1 |
| Aug-Oct 2001 | 2.4 | 5.1 |
| Sep-Nov 2001 | 2.3 | 5.1 |
| Oct-Dec 2001 | 2.3 | 5.2 |
| Nov- Jan 2002 | 2.3 | 5.2 |
| Dec-Feb 2002 | 2.3 | 5.1 |
| Jan-Mar 2002 | 2.3 | 5.2 |
| Feb-Apr 2002 | 2.3 | 5.2 |
| Mar-May 2002 | 2.3 | 5.2 |
| Apr-Jun 2002 | 2.3 | 5.2 |
| May-Jul 2002 | 2.3 | 5.2 |
| Jun-Aug 2002 | 2.3 | 5.2 |
| Jul-Sep 2002 | 2.3 | 5.3 |
| Aug-Oct 2002 | 2.3 | 5.2 |
| Sep-Nov 2002 | 2.3 | 5.2 |
| Oct-Dec 2002 | 2.3 | 5.1 |
| Nov-Jan 2003 | 2.3 | 5.0 |
| Dec-Feb 2003 | 2.2 | 5.1 |
| Jan-Mar 2003 | 2.2 | 5.2 |
| Feb-Apr 2003 | 2.2 | 5.1 |
| Mar-May 2003 | 2.2 | 5.0 |
| Apr-Jun 2003 | 2.2 | 4.9 |
| May-Jul 2003 | 2.1 | 5.1 |
| Jun-Aug 2003 | 2.2 | 5.1 |
| Jul-Sep 2003 | 2.2 | 5.0 |
| Aug-Oct 2003 | 2.3 | 5.0 |
| Sep-Nov 2003 | 2.3 | 4.9 |
| Oct-Dec 2003 | 2.3 | 4.9 |
| Nov-Jan 2004 | 2.3 | 4.8 |
| Dec-Feb 2004 | 2.3 | 4.8 |
| Jan-Mar 2004 | 2.3 | 4.8 |
| Feb-Apr 2004 | 2.3 | 4.8 |
| Mar-May 2004 | 2.3 | 4.8 |
| Apr-Jun 2004 | 2.4 | 4.8 |
| May-Jul 2004 | 2.4 | 4.8 |
| Jun-Aug 2004 | 2.4 | 4.7 |
| Jul-Sep 2004 | 2.4 | 4.7 |
| Aug-Oct 2004 | 2.4 | 4.7 |
| Sep-Nov 2004 | 2.4 | 4.7 |
| Oct-Dec 2004 | 2.4 | 4.7 |
| Nov-Jan 2005 | 2.5 | 4.7 |
| Dec-Feb 2005 | 2.4 | 4.8 |
| Jan-Mar 2005 | 2.3 | 4.7 |
| Feb-Apr 2005 | 2.3 | 4.7 |
| Mar-May 2005 | 2.3 | 4.8 |
| Apr-Jun 2005 | 2.3 | 4.8 |
| May-Jul 2005 | 2.3 | 4.7 |
| Jun-Aug 2005 | 2.3 | 4.7 |
| Jul-Sep 2005 | 2.3 | 4.7 |
| Aug-Oct 2005 | 2.2 | 4.9 |
| Sep-Nov 2005 | 2.2 | 5.1 |
| Oct-Dec 2005 | 2.2 | 5.1 |
| Nov-Jan 2006 | 2.2 | 5.1 |
| Dec-Feb 2006 | 2.2 | 5.2 |
| Jan-Mar 2006 | 2.2 | 5.2 |
| Feb-Apr 2006 | 2.1 | 5.3 |
| Mar-May 2006 | 2.1 | 5.4 |
| Apr-Jun 2006 | 2.2 | 5.5 |
| May-Jul 2006 | 2.2 | 5.5 |
| Jun-Aug 2006 | 2.2 | 5.5 |
| Jul-Sep 2006 | 2.2 | 5.5 |
| Aug-Oct 2006 | 2.2 | 5.5 |
| Sep-Nov 2006 | 2.2 | 5.4 |
| Oct-Dec 2006 | 2.2 | 5.5 |
| Nov-Jan 2007 | 2.2 | 5.5 |
| Dec-Feb 2007 | 2.3 | 5.5 |
| Jan-Mar 2007 | 2.3 | 5.5 |
| Feb-Apr 2007 | 2.3 | 5.5 |
| Mar-May 2007 | 2.3 | 5.4 |
| Apr-Jun 2007 | 2.3 | 5.4 |
| May-Jul 2007 | 2.4 | 5.3 |
| Jun-Aug 2007 | 2.4 | 5.3 |
| Jul-Sep 2007 | 2.4 | 5.3 |
| Aug-Oct 2007 | 2.4 | 5.2 |
| Sep-Nov 2007 | 2.4 | 5.2 |
| Oct-Dec 2007 | 2.4 | 5.2 |
| Nov-Jan 2008 | 2.5 | 5.2 |
| Dec-Feb 2008 | 2.5 | 5.2 |
| Jan-Mar 2008 | 2.5 | 5.2 |
| Feb-Apr 2008 | 2.5 | 5.3 |
| Mar-May 2008 | 2.4 | 5.2 |
| Apr-Jun2008 | 2.3 | 5.4 |
| May-Jul 2008 | 2.3 | 5.5 |
| Jun-Aug 2008 | 2.2 | 5.7 |
| Jul-Sep 2008 | 2.2 | 5.9 |
| Aug-Oct 2008 | 2.1 | 6.0 |
| Sep-Nov 2008 | 2.0 | 6.2 |
| Oct-Dec 2008 | 1.9 | 6.4 |
| Nov-Jan 2009 | 1.8 | 6.5 |
| Dec-Feb 2009 | 1.7 | 6.7 |
| Jan-Mar 2009 | 1.7 | 7.1 |
| Feb-Apr 2009 | 1.7 | 7.3 |
| Mar-May 2009 | 1.6 | 7.6 |
| Apr-Jun 2009 | 1.6 | 7.8 |
| May-Jul 2009 | 1.6 | 7.9 |
| Jun-Aug 2009 | 1.6 | 7.9 |
| Jul-Sep 2009 | 1.6 | 7.8 |
| Aug-Oct 2009 | 1.6 | 7.9 |
| Sep-Nov 2009 | 1.6 | 7.8 |
| Oct-Dec 2009 | 1.6 | 7.8 |
| Nov-Jan 2010 | 1.7 | 7.7 |
| Dec-Feb 2010 | 1.7 | 7.9 |
| Jan-Mar 2010 | 1.7 | 8.0 |
| Feb-Apr 2010 | 1.7 | 8.0 |
| Mar-May 2010 | 1.8 | 7.9 |
| Apr-Jun 2010 | 1.8 | 7.9 |
| May-Jul 2010 | 1.8 | 7.8 |
| Jun-Aug 2010 | 1.7 | 7.8 |
| Jul-Sep 2010 | 1.7 | 7.8 |
| Aug-Oct 2010 | 1.7 | 7.9 |
| Sep-Nov 2010 | 1.7 | 7.9 |
| Oct-Dec 2010 | 1.8 | 7.9 |
| Nov-Jan 2011 | 1.8 | 7.9 |
| Dec-Feb 2011 | 1.8 | 7.8 |
| Jan-Mar 2011 | 1.8 | 7.8 |
| Feb-Apr 2011 | 1.7 | 7.7 |
| Mar-May 2011 | 1.7 | 7.8 |
| Apr-Jun 2011 | 1.7 | 7.9 |
| May-Jul 2011 | 1.7 | 8.0 |
| Jun-Aug 2011 | 1.7 | 8.2 |
| Jul-Sep 2011 | 1.7 | 8.3 |
| Aug-Oct 2011 | 1.7 | 8.4 |
| Sep-Nov 2011 | 1.7 | 8.5 |
| Oct-Dec 2011 | 1.7 | 8.4 |
| Nov-Jan 2012 | 1.7 | 8.3 |
| Dec-Feb 2012 | 1.7 | 8.3 |
| Jan-Mar 2012 | 1.7 | 8.2 |
| Feb-Apr 2012 | 1.7 | 8.2 |
| Mar-May 2012 | 1.7 | 8.1 |
| Apr-Jun 2012 | 1.7 | 8.0 |
| May-Jul 2012 | 1.7 | 8.1 |
| Jun-Aug 2012 | 1.8 | 7.9 |
| Jul-Sep 2012 | 1.8 | 7.9 |
| Aug-Oct 2012 | 1.8 | 7.9 |
| Sep-Nov 2012 | 1.8 | 7.8 |
| Oct-Dec 2012 | 1.8 | 7.8 |
| Nov-Jan 2013 | 1.8 | 7.8 |
| Dec-Feb 2013 | 1.8 | 8.0 |
| Jan-Mar 2013 | 1.8 | 7.8 |
| Feb-Apr 2013 | 1.9 | 7.8 |
| Mar-May 2013 | 1.9 | 7.8 |
| Apr-Jun 2013 | 1.9 | 7.8 |
| May-Jul 2013 | 2.0 | 7.7 |
| Jun-Aug 2013 | 1.9 | 7.7 |
| Jul-Sep 2013 | 2.0 | 7.6 |
| Aug-Oct 2013 | 2.0 | 7.4 |
| Sep-Nov 2013 | 2.1 | 7.1 |
| Oct-Dec 2013 | 2.1 | 7.2 |
| Nov-Jan 2014 | 2.1 | 7.2 |
| Dec-Feb 2014 | 2.2 | 6.9 |
| Jan-Mar 2014 | 2.2 | 6.8 |
| Feb-Apr 2014 | 2.3 | 6.6 |
| Mar-May 2014 | 2.3 | 6.5 |
| Apr-Jun 2014 | 2.3 | 6.3 |
| May-Jul 2014 | 2.3 | 6.2 |
| Jun-Aug 2014 | 2.4 | 6.0 |
| Jul-Sep 2014 | 2.4 | 6.0 |
| Aug-Oct 2014 | 2.5 | 6.0 |
| Sep-Nov 2014 | 2.5 | 5.8 |
| Oct-Dec 2014 | 2.5 | 5.7 |
| Nov-Jan 2015 | 2.6 | 5.7 |
| Dec-Feb 2015 | 2.6 | 5.6 |
| Jan-Mar 2015 | 2.6 | 5.5 |
| Feb-Apr 2015 | 2.6 | 5.5 |
| Mar-May 2015 | 2.6 | 5.6 |
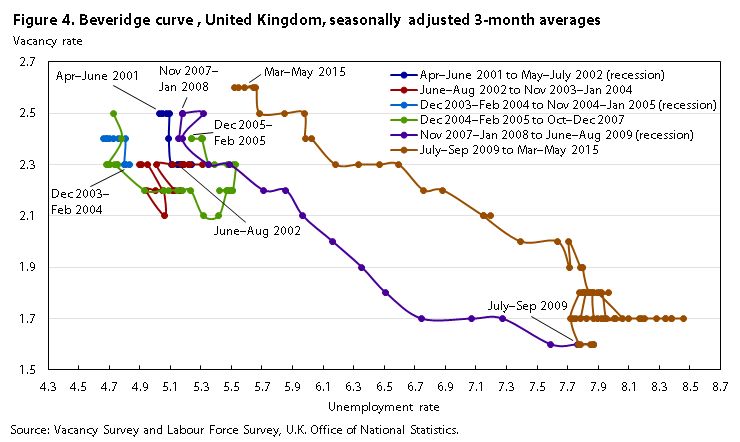
Figure 4 shows the U.K. Beveridge curve with data reflecting the recession from the third quarter of 2008 through the third quarter of 2009.16
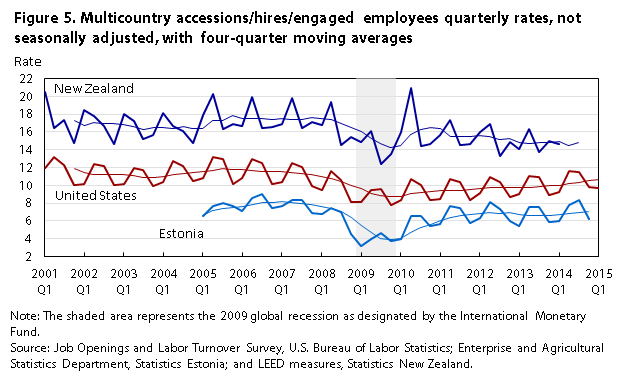
Hires are procyclical. During an expansion, establishments replace workers that separate and possibly increase the number of employees through hires. During a contraction, establishments may delay replacing employees that separate.
| Year/Qtr | New Zealand accession rate | U.S. hires rate | Estonia rate of engaged employees |
|---|---|---|---|
| 2001 Q1 | 20.4 | 11.9 | |
| 2001 Q2 | 16.5 | 13.2 | |
| 2001 Q3 | 17.4 | 12.3 | |
| 2001 Q4 | 14.7 | 10 | |
| 2002 Q1 | 18.5 | 10.2 | |
| 2002 Q2 | 17.8 | 12.4 | |
| 2002 Q3 | 16.6 | 12.2 | |
| 2002 Q4 | 14.7 | 10 | |
| 2003 Q1 | 18.0 | 10.1 | |
| 2003 Q2 | 17.2 | 11.9 | |
| 2003 Q3 | 15.2 | 11.7 | |
| 2003 Q4 | 15.6 | 9.9 | |
| 2004 Q1 | 18.2 | 10.4 | |
| 2004 Q2 | 16.6 | 12.7 | |
| 2004 Q3 | 16.1 | 12.2 | |
| 2004 Q4 | 14.7 | 10.5 | |
| 2005 Q1 | 17.8 | 10.8 | 6.6 |
| 2005 Q2 | 20.2 | 13.2 | 7.7 |
| 2005 Q3 | 16.4 | 13 | 8 |
| 2005 Q4 | 16.9 | 10.1 | 7.7 |
| 2006 Q1 | 16.6 | 10.8 | 7.1 |
| 2006 Q2 | 20.0 | 12.9 | 8.6 |
| 2006 Q3 | 16.5 | 12.5 | 9 |
| 2006 Q4 | 16.6 | 10.2 | 7.4 |
| 2007 Q1 | 16.9 | 10.4 | 7.7 |
| 2007 Q2 | 19.8 | 12.5 | 8.3 |
| 2007 Q3 | 16.4 | 12.1 | 8.4 |
| 2007 Q4 | 17.2 | 9.9 | 6.9 |
| 2008 Q1 | 16.8 | 9.5 | 6.8 |
| 2008 Q2 | 19.3 | 11.6 | 7.4 |
| 2008 Q3 | 14.5 | 10.6 | 7 |
| 2008 Q4 | 15.4 | 8.1 | 4.5 |
| 2009 Q1 | 14.9 | 8.1 | 3.2 |
| 2009 Q2 | 16.1 | 9.5 | 4 |
| 2009 Q3 | 12.4 | 9.6 | 4.6 |
| 2009 Q4 | 13.5 | 7.8 | 3.7 |
| 2010 Q1 | 16.0 | 8.3 | 4 |
| 2010 Q2 | 21.0 | 10.7 | 6.6 |
| 2010 Q3 | 14.4 | 10 | 6.6 |
| 2010 Q4 | 14.6 | 8.3 | 5.4 |
| 2011 Q1 | 15.6 | 8.5 | 5.7 |
| 2011 Q2 | 17.3 | 10.7 | 7.7 |
| 2011 Q3 | 14.6 | 10.4 | 7.5 |
| 2011 Q4 | 14.7 | 8.4 | 5.8 |
| 2012 Q1 | 16.0 | 9.1 | 6.3 |
| 2012 Q2 | 16.8 | 10.9 | 8.1 |
| 2012 Q3 | 13.3 | 10.4 | 7.3 |
| 2012 Q4 | 14.9 | 8.7 | 6 |
| 2013 Q1 | 14.1 | 9 | 5.4 |
| 2013 Q2 | 16.4 | 11 | 7.6 |
| 2013 Q3 | 13.7 | 10.9 | 7.6 |
| 2013 Q4 | 15.0 | 8.9 | 5.9 |
| 2014 Q1 | 14.6 | 9.2 | 6 |
| 2014 Q2 | 11.6 | 7.8 | |
| 2014 Q3 | 11.5 | 8.3 | |
| 2014 Q4 | 9.8 | 6.2 | |
| 2015 Q1 | 9.7 |
Figure 5 compares the hires, accessions and engaged employees rates of the United States (adjusted to a quarterly basis), New Zealand, and Estonia. While the global recession covers all four quarters of 2009, these countries separately experienced recessions with differing quarterly periods.
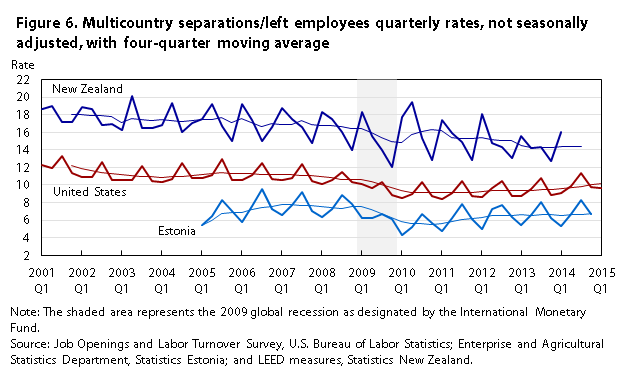
JOLTS separations data comprise quits, layoffs and discharges, and other separations. Of these components, quits are considered procyclical since workers generally quit more during economic expansions (when more jobs are available) and quit less during economic contractions (when fewer jobs are available). Layoffs and discharges, on the other hand, are considered countercyclical. Establishments retain workers during expansions and lay off workers during contractions.
| Date | New Zealand separation rate | U.S. separations rate | Estonia left employees rate |
|---|---|---|---|
| 2001 Q1 | 18.7 | 12.3 | |
| 2001 Q2 | 18.9 | 11.9 | |
| 2001 Q3 | 17.2 | 13.3 | |
| 2001 Q4 | 17.1 | 11.3 | |
| 2002 Q1 | 18.9 | 10.9 | |
| 2002 Q2 | 18.6 | 10.9 | |
| 2002 Q3 | 16.8 | 12.6 | |
| 2002 Q4 | 16.9 | 10.6 | |
| 2003 Q1 | 16.3 | 10.6 | |
| 2003 Q2 | 20.1 | 10.5 | |
| 2003 Q3 | 16.5 | 12.2 | |
| 2003 Q4 | 16.5 | 10.4 | |
| 2004 Q1 | 16.8 | 10.3 | |
| 2004 Q2 | 19.3 | 10.7 | |
| 2004 Q3 | 16.0 | 12.5 | |
| 2004 Q4 | 17.1 | 10.8 | |
| 2005 Q1 | 17.4 | 10.8 | 5.4 |
| 2005 Q2 | 19.2 | 11.1 | 6.5 |
| 2005 Q3 | 16.7 | 12.9 | 8.3 |
| 2005 Q4 | 15.0 | 10.5 | 7.0 |
| 2006 Q1 | 19.2 | 10.5 | 5.8 |
| 2006 Q2 | 17.4 | 11.1 | 7.6 |
| 2006 Q3 | 14.9 | 12.5 | 9.5 |
| 2006 Q4 | 16.5 | 10.7 | 7.3 |
| 2007 Q1 | 18.7 | 10.5 | 6.6 |
| 2007 Q2 | 17.5 | 10.8 | 7.7 |
| 2007 Q3 | 16.5 | 12.4 | 9.2 |
| 2007 Q4 | 14.8 | 10.4 | 7.0 |
| 2008 Q1 | 18.3 | 10.1 | 6.3 |
| 2008 Q2 | 17.5 | 10.5 | 7.2 |
| 2008 Q3 | 16.0 | 11.5 | 8.8 |
| 2008 Q4 | 13.9 | 10.3 | 7.8 |
| 2009 Q1 | 18.3 | 10.1 | 6.2 |
| 2009 Q2 | 15.6 | 9.6 | 6.2 |
| 2009 Q3 | 13.9 | 10.3 | 6.7 |
| 2009 Q4 | 12.0 | 8.9 | 6.1 |
| 2010 Q1 | 17.8 | 8.5 | 4.3 |
| 2010 Q2 | 19.4 | 9 | 5.2 |
| 2010 Q3 | 15.3 | 10.3 | 6.7 |
| 2010 Q4 | 12.8 | 8.7 | 5.7 |
| 2011 Q1 | 17.4 | 8.4 | 4.7 |
| 2011 Q2 | 15.9 | 9.1 | 6.2 |
| 2011 Q3 | 14.9 | 10.4 | 7.8 |
| 2011 Q4 | 12.9 | 8.7 | 6.1 |
| 2012 Q1 | 18.0 | 8.6 | 5.0 |
| 2012 Q2 | 14.8 | 9.6 | 7.2 |
| 2012 Q3 | 14.3 | 10.4 | 7.7 |
| 2012 Q4 | 13.0 | 8.7 | 6.3 |
| 2013 Q1 | 15.6 | 8.7 | 5.4 |
| 2013 Q2 | 14.2 | 9.5 | 6.6 |
| 2013 Q3 | 14.3 | 10.8 | 8.1 |
| 2013 Q4 | 12.7 | 8.9 | 6.2 |
| 2014 Q1 | 16.0 | 9.1 | 5.3 |
| 2014 Q2 | 9.9 | 6.7 | |
| 2014 Q3 | 11.3 | 8.3 | |
| 2014 Q4 | 9.8 | 6.7 | |
| 2015 Q1 | 9.7 |
Figure 6 compares the Estonian quarterly left employees rates, the New Zealand quarterly separations rates, and the United States separations rates adjusted to a quarterly basis. The data trended downward before the 2009 global recession, as individual countries experienced their respective recessions.
There are currently many countries that produce job openings (vacancies) data and fewer that produce hires (accessions) and separations data. Various methodologies and definitions exist to capture these data. Different levels of data detail are published, ranging from national totals to detailed break downs by industry, region, occupation, and size class. Labor demand data tell users the underlying story of employment growth and decline, both in the United States and abroad. Although the definitions of various data elements differ across countries, the data generally show similar trends over the time period examined in this article. Labor demand data are increasingly useful for gauging the overall health of the economy and for making informed decisions about economic policy.
| Country | Statistical agency/survey name | Data elements | Frequency |
|---|---|---|---|
| Australia | Australian Bureau of Statistics: Job Vacancy Survey (JVS) | Job vacancy estimates by state, territory, and industry | Quarterly since 1979, suspended between August 2008 and August 2009 |
| Canada | Statistics Canada: Workplace Survey | Labour turnover rates, job vacancies, hard-to-fill jobs | Annually |
| The Government of the Hong Kong Special Administrative Region of the People's Republic of China | Quarterly Report of Employment and Vacancies; Quarterly Report of Employment and Vacancies at Construction Sites | Vacancies | Quarterly |
| Gibralter | Government of Gibralter Information Services | Notices of terminations, notices of engagements, and vacancies filled | Semi-annual for notices and monthly for vacancies |
| India | Labour Bureau, Government of India | Accession rates and separation rates | Annually |
| Israel | Central Bureau of Statistics, Job Vacancy Survey | Job vacancies | Quarterly averages since 2004 |
| Japan | Ministry of Health, Labour and Welfare, Monthly Labour Survey | Accession rates and separation rates | Monthly |
| Ministry of Health, Labour and Welfare, Survey on Employment Trends | Hires and separations | Conducted in 2010, 2011, 2012 | |
| New Zealand | Statistics New Zealand, Linked Employer-Employee Data (LEED) | Accessions, separations, worker turnover rates | Quarterly |
| Philippines | Bureau of Labor and Employment Statistics, Labor Turnover Survey | New hires (accessions), separations, existing job vacancies | Quarterly |
| Switzerland | Swiss Federal Statistical Office, JOBSTAT | Job vacancy levels and rates (via agency and Eurostat) | Quarterly |
| United States | Bureau of Labor Statistics, Job Openings and Labor Turnover Survey (JOLTS) | Job openings, hires, and separations levels and rates | Monthly |
| Country | Statistical agency | Data elements | Frequency |
|---|---|---|---|
| European Union | Eurostat | Job vacancy levels and rates for multiple European Union and euro area groupings | Quarterly, Annual (rates only) |
| Austria | Statistics Austria | Job vacancy levels and rates (via agency & Eurostat) | Quarterly, Annual |
| Belgium | Statistics Belgium | Job vacancy levels and rates (via Eurostat) | Quarterly, Annual |
| Bulgaria | National Statistical Institute | Job vacancy levels and rates (via agency & Eurostat) | Quarterly, Annual |
| Croatia | Croatian Bureau of Statistics | Job vacancy levels & rates (via Eurostat) | Quarterly |
| Cyprus | CYSTAT | Job vacancy levels and rates (via agency & Eurostat) | Quarterly, Annual |
| Czech Republic | Czech Statistical Office | Job vacancy levels and rates (via agency & Eurostat) | Quarterly, Annual |
| Denmark | Statistics Denmark | Job vacancy levels and rates (via agency) | Quarterly |
| Estonia | Statistics Estonia | Job vacancies levels and rates (via agency & Eurostat); number of engaged employees; number of left employees; number of dismissed employees | Quarterly, Annual |
| Finland | Statistics Finland | Job vacancy levels and rates (via agency & Eurostat) | Quarterly, Annual |
| France | National Institute of Statistics and Economic Studies (INSEE) | Registered job vacancies (advertisements) | Monthly (Annual rates on Eurostat) |
| Germany | Destatis | Vacancies unfilled (levels & rates via agency and Eurostat) | Monthly, Quarterly, Annual |
| Greece | Hellenic Statistical Authority (EL.STAT.) | Job vacancy levels (levels & rates via Eurostat) | Quarterly, Annual |
| Hungary | Hungarian Central Statistical Office | Job vacancy levels and rates (via agency & Eurostat) | Quarterly, Annual |
| Ireland | Central Statistics Office | Job vacancy rates (via Eurostat) | Quarterly, Annual |
| Italy | Italian National Institute of Statistics (Istat) | Job vacancy rates (via agency) | Quarterly |
| Latvia | Latvijas Statistika | Job vacancy levels and rates (via agency & Eurostat) | Quarterly, Annual |
| Lithuania | Statistics Lithuania | Job vacancy levels and rates (via agency & Eurostat) | Quarterly, Annual |
| Luxembourg | STATEC | Job vacancy levels and rates (via Eurostat) | Quarterly, Annual |
| Malta | National Statistics Office | Job vacancies | Quarterly by economic activity; annually by occupation |
| Netherlands | Statistics Netherlands | Job vacancy levels and rates (via agency and Eurostat) | Quarterly, Annual |
| Norway | Statistics Norway | Job vacancy levels and rates (via agency and Eurostat) | Quarterly, Annual |
| Poland | Central Statistical Office | Job vacancy levels and rates (via Eurostat) | Quarterly, Annual |
| Portugal | Statistics Portugal | Job vacancy levels and rates (via agency & Eurostat) | Quarterly, Annual |
| Republic of Macedonia | Republic of Macedonia State Statistical Office | Job vacancies | Quarterly |
| Romania | National Institute of Statistics | Job vacancy levels and rates (via agency & Eurostat) | Quarterly, Annual |
| Slovakia | Statistical Office of the Slovak Republic | Job vacancy levels and rates (via agency & Eurostat) | Quarterly, Annual |
| Slovenia | Statistical Office of the Republic of Slovenia | Job vacancy levels and rates (via agency & Eurostat) | Quarterly, Annual |
| Spain | National Statistics Institute (INE) | Job vacancy levels and rates (via Eurostat) | Quarterly, Annual |
| Sweden | Statistics Sweden | Job openings and vacancies (via agency and Eurostat) | Quarterly, Annual |
| United Kingdom | Office for National Statistics | Job vacancy levels & rates (via agency and Eurostat) | Monthly, Quarterly, Annual |
ACKNOWLEDGMENT: Any opinions expressed in this article are those of the author and do not constitute policy of the U.S. Bureau of Labor Statistics.
!--?pagebreak?-->!--?pagebreak?-->!--?pagebreak?-->!--?pagebreak?-->Katherine Bauer, "Comparison of U.S. and international labor turnover statistics," Monthly Labor Review, U.S. Bureau of Labor Statistics, July 2015, https://doi.org/10.21916/mlr.2015.26
1 The JOLTS program follows the North American Industrial Classification System. The term “industry” can refer to a supersector, sector, or subsector, depending on the context. Census region descriptions can be viewed at https://www.bls.gov/eag/.
2 Job openings are also commonly referred to as job vacancies. While the JOLTS program uses the term job openings, the historical Labor Turnover Program used the term job vacancy. Both terms are used in this article depending upon the term used by the country being discussed.
3 Hires are commonly referred to as accessions. While the JOLTS program uses the term hires, the historical Labor Turnover Program used the term accession. Both of these terms, plus other terms determined by each country, are used in this article depending upon the country being discussed.
4 For more information, see Katherine Bauer “Examination of state-level labor turnover data,” Monthly Labor Review, January 2014, http://stats.bls.gov/opub/mlr/2014/article/examination-of-state-level-labor-turnover-survey-data.htm.
5Eurostat Statistics Explained, Job Vacancy Statistics. http://ec.europa.eu/eurostat/statistics-explained/index.php/Job_vacancy_statistics
6 Eurostat Statistics Explained, (Eurostat, European Commission), http://epp.eurostat.ec.europa.eu/statistics_explained/index.php/Job_vacancy_statistics.
7 Detailed information on the definitions and methodology for Eurostat job vacancies is available at http://ec.europa.eu/eurostat/web/labour-market/job-vacancies.
8 Definitions and methods, (French National Institute of Statistics and Economic Studies INSEE), http://www.insee.fr/en/methodes/default.asp?page=definitions/offres-emploi-enregistrees.htm.
9 Job openings and unmet labour demand, (Statistics Sweden), https://www.scb.se/AM0701-EN/.
10 Monthly Labour Survey, (Japanese Ministry of Health, Labour and Welfare), http://www.mhlw.go.jp/english/database/db-slms/dl/slms-01.pdf.
11 Guide to Interpreting the LEED Data, (Statistics New Zealand), http://www.stats.govt.nz/browse_for_stats/income-and-work/employment_and_unemployment/guide-interpreting-the-leed-data/definitions-of-measures.aspx.
12 IMF Research Bulletin, Volume 13 Number 4, December 2012, p. 8, http://www.imf.org/external/pubs/ft/irb/2012/04/index.pdf.
13 Ibid., pp. 7–9.
14 Centre for Economic Policy Research, Euro Area Business Cycle Dating Committee, Chronology of Euro Area Business Cycles. http://www.cepr.org/content/euro-area-business-cycle-dating-committee
15 U.S. Business Cycle Expansions and Contractions, announced September 20, 2010. http://www.nber.org/cycles.html.
16 Key Issues for the New Parliament 2010, House of Commons Library Research, Recession and Recovery, pp.