
An official website of the United States government
An official website of the United States government
The .gov means it's official.
Federal government websites often end in .gov or .mil. Before sharing sensitive information,
make sure you're on a federal government site.
The site is secure.
The
https:// ensures that you are connecting to the official website and that any
information you provide is encrypted and transmitted securely.
Crossref 0
Retirement savings among U.S. older adult male workers by paid sick leave, flexible work, and vacation benefit status, Community, Work & Family, 2021.
Challenges in calculating occupational fatality rates, Monthly Labor Review, 2022.
Still Falling Short on Hours and Pay: Part-Time Work Becoming New Normal, SSRN Electronic Journal , 2016.
The Distribution and Consequences of Part-Time Underemployment in the US, SSRN Electronic Journal , 2021.
Still Only Part Way Home: Part-Time Work and Underemployment in Illinois and Its Region, SSRN Electronic Journal , 2017.
Data from the National Compensation Survey (NCS) consistently show that part-time workers have lower access to benefits. The designation of a job as full time or part time in the NCS is based on whether the responding establishment reports the job as full time or part time rather than on actual hours worked. However, legal requirements for providing access to benefits often depend specifically on hours worked. This article examines access rates to benefits—retirement, health insurance, and leave—based specifically on scheduled weekly hours. It also takes into account whether a person is employed in an industry where full-time or part-time work is more prevalent. The results show distinct variations in access rates in hour-specific categories.
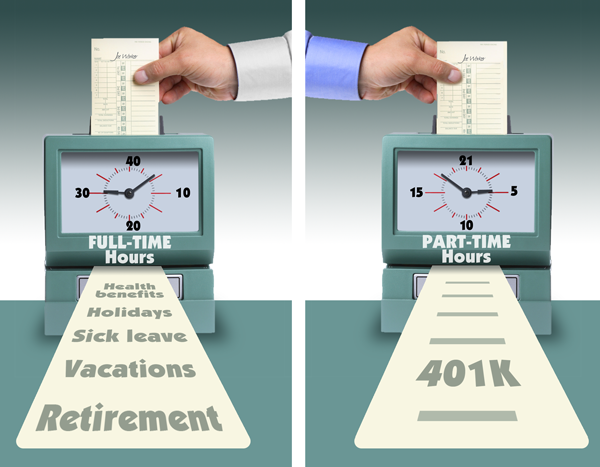
Employee benefits often depend specifically on weekly work hours. Part-time workers consistently show lower access rates to benefits than do full-time workers. Reporting only that an employee works full time or part time, however, may not always tell the entire story. For instance, while 40 hours of work per week is often informally considered to be the definition of full-time employment, for many purposes full time has long been defined as 35 or more hours per week. More recently, the Affordable Care Act (ACA) defined full-time employment as 30 or more hours per week and required that large employers offer healthcare coverage to full-time employees or make an Employer Shared Responsibility Payment to the IRS.1 This article looks at access rates for a selection of employer-provided benefits by categories based explicitly on scheduled weekly work hours.
The Bureau of Labor Statistics (BLS) uses data from the National Compensation Survey (NCS) to calculate access rates for a variety of employee benefits. Estimates are produced across a broad range of job characteristics, including industry, occupation, and establishment size. Statistics are also reported by full-time and part-time status. As shown below, NCS data for March 2013 indicate that U.S. employees in private industry work an average of 35 hours per week,2 with full-time employees working 40 hours per week and part-time employees working 21 hours per week.
| Characteristic | Mean hours | Percent of jobs |
| All workers | 35 | 100 |
| Full time | 40 | 74 |
| Part time | 21 | 26 |
The full-time or part-time status published by the NCS is based on whether the responding establishment reports a job as full time or part time,3 rather than on a definition that specifies weekly work hours. The NCS does, however, collect information on scheduled work hours for each job. Data on scheduled weekly work hours are used in this article.
Table 1 compares estimates of access rates for a selection of benefits by full- and part-time status, with estimates for job categories that are explicitly defined by the number of weekly hours an employee is scheduled to work. For each of the selected benefits, the rates of access for part-time workers mirror the rates seen for employees working less than 30 hours per week. Similarly, access rates for full-time workers, as reported by employers and traditionally defined in the NCS, are almost identical to jobs in the 40-or-more-hours-per-week category.
| Characteristic | Retirement | Health insurance | Holidays | Sick leave | Vacations |
|---|---|---|---|---|---|
| All workers | 64 | 70 | 77 | 61 | 77 |
| Full time | 74 | 85 | 90 | 74 | 91 |
| Part time | 37 | 24 | 39 | 24 | 36 |
| At least 40 hours | 74 | 86 | 91 | 74 | 91 |
| 35 to less than 40 hours | 71 | 80 | 85 | 75 | 86 |
| 30 to less than 35 hours | 40 | 44 | 60 | 40 | 65 |
| Less than 30 hours | 38 | 24 | 37 | 23 | 34 |
| Source: National Compensation Survey, U.S. Bureau of Labor Statistics. | |||||
When comparing benefit access rates across hours-worked categories, only statistically significant differences are discussed in the text.4
Retirement and health insurance. Access to retirement benefits for employees working at least 30 hours but less than 35 hours per week is 31 percentage points lower than for those working at least 35 hours but less than 40 hours per week.
Access to health insurance displays more prominent differences across the scheduled-work-hours categories. Access for those working 30–35 hours per week is 20 percentage points higher than the less-than-30-hours category. The difference is even greater (36 points) between the categories of 30–35 and
Leave benefits. For each of the three leave benefits considered (paid holidays, sick leave, and vacations), the 30–35 hours category is found to be both higher than the less-than-30-hours category and substantially below the 35–40-hours-per-week category. For paid holidays and paid vacation benefits, the access rates are slightly higher for those working 40 or more hours per week than for those working
With the exception of retirement benefits, access rates for the 30–35-hours-per-week category were found to be consistently higher than access rates for the less-than-30-hours category. Moreover, the 30–35-hours-per-week category was also found to have substantially lower access rates than the 35–40-hours-per-week category for all of the benefits considered. While the differences between the two highest hours categories were less pronounced, there is evidence of small but statistically significant differences between access rates for some benefits—holiday, vacation, and health benefits.
While it has been shown that access to benefits in private industry overall is related to scheduled weekly work hours, might variations in access rates be different for industries in which part-time or full-time employment is more prevalent? Table 2 lists the percentage of part-time jobs by major industrial sector.
| Industry | Percent |
|---|---|
| Lower hour industries | |
| Accommodation and food services | 60 |
| Arts, entertainment and recreation | 50 |
| Retail trade | 49 |
| Higher hour industries | |
| Other services (except administration) | 32 |
| Health care | 27 |
| Administrative and support and waste management and remediation services | 26 |
| Educational services | 22 |
| Transportation and warehousing | 20 |
| Real estate and rental leasing | 16 |
| Professional, scientific, and technical services | 11 |
| Information | 9 |
| Wholesale trade | 8 |
| Finance and insurance | 6 |
| Management of companies and enterprises | 6 |
| Construction | 5 |
| Manufacturing | 3 |
| Mining | 2 |
| Utilities | 1 |
| Source: National Compensation Survey, U.S. Bureau of Labor Statistics. | |
For the purposes of this study, accommodation and food services; arts, entertainment, and recreation; and retail trade have been aggregated into a group which will be referred to as “lower hour industries.” This selection was based on the relatively high percentage of part-time jobs in these industries. For comparison, the remaining industries are aggregated into a group referred to as “higher hour industries.” As shown below, NCS data for March 2013 indicate that while full-time jobs account for 85 percent of employment in the higher-hour-industries category, employment in the lower hour industries is more evenly divided between full-time and part-time jobs.
| Characteristic | Full time | Part time |
| Higher hour industries | 85 | 15 |
| Lower hour industries | 47 | 53 |
Table 3 shows the benefits access rates for the scheduled work-hours categories in lower hour industries. Access rates for the less-than-30-hours category are similar to access rates for part-time jobs, and access rates in the 40-or-more-hours category are similar to access rates for full-time jobs. This mirrors the results for private industry overall.
| Characteristic | Retirement | Health insurance | Holidays | Sick leave | Vacations |
|---|---|---|---|---|---|
| All workers | 49 | 47 | 54 | 38 | 58 |
| Full time | 58 | 73 | 78 | 62 | 85 |
| Part time | 41 | 25 | 33 | 17 | 35 |
| At least 40 hours | 59 | 74 | 80 | 64 | 84 |
| 35 to less than 40 hours | 51 | 62 | 65 | 50 | 82 |
| 30 to less than 35 hours | 44 | 44 | 53 | 32 | 62 |
| Less than 30 hours | 41 | 24 | 31 | 16 | 33 |
| Source: National Compensation Survey, U.S. Bureau of Labor Statistics. | |||||
Retirement and health insurance. Among access rates for retirement benefits in lower hour industries, there appear to be differences in several adjacent hours-worked categories. However, the only statistically significant differences are found in two categories: the 35–40-hours category, which is greater than the less-than-30-hours category by 10 percentage points, and the 40-or-more-hours category, which is greater than the 30–35-hours categories by 15 points.
For health insurance, the access rate for employees in lower hour industries working 30–35 hours per week is 20 percentage points greater than the under-30 category. The access rate for the 35–40-hours category is 18 points higher than that of the 30–35-hours category, while the 40-or-more-hours category is 12 points higher than the 35–40 category.
Leave benefits. For each of the leave benefits, the access rates for the less-than-30-hours category are less than those for the 30–35-hours category: 22 percentage points less in the case of holiday pay, 16 points for sick leave, and 29 points for vacation pay. Other sizable differences in access rates are between the
Higher hour industries refers to the remainder of private industry once the lower hour industries (accommodation and food services; arts, entertainment, and recreation; and retail trade) have been excluded. Table 4 shows the benefit access rates for the higher-hour-industries group. As was the case for lower hour industries as well as for private industries overall, the higher-hour-industries access rates for the 40-or-more-hours-per-week category line up closely with full-time employment, and access rates for the less-than-30-hours-per-week category line up closely with part-time employment.
| Characteristic | Retirement | Health insurance | Holidays | Sick leave | Vacations |
|---|---|---|---|---|---|
| All workers | 70 | 78 | 85 | 69 | 84 |
| Full time | 77 | 88 | 93 | 76 | 92 |
| Part time | 32 | 24 | 46 | 33 | 37 |
| At least 40 hours | 77 | 89 | 93 | 76 | 93 |
| 35 to less than 40 hours | 74 | 84 | 89 | 81 | 87 |
| 30 to less than 35 hours | 37 | 44 | 66 | 45 | 67 |
| Less than 30 hours | 34 | 25 | 44 | 33 | 36 |
| Source: National Compensation Survey, U.S. Bureau of Labor Statistics. | |||||
Retirement and health insurance. For retirement benefits, one statistically significant difference is found: the 35–40-hours category is 37 points higher than 30–35-hours category.
Access to health benefits, however, varies by wide margins across the less-than-30 versus 30–35-hours-per-week categories (19 point difference) and the 30–35 versus 35–40-hours-per-week categories (40 points). The 40-or-more-hours rate is 5 points greater than that for the 35–40-hours category.
Leave benefits. Access to holiday pay increases between the less-than-30 and the 30–35-hours categories by 22 percentage points, and increases between the 30–35 and the 35–40-hours categories by 23 points. There is a 4-point difference between the two highest hours-per-week categories.
Sick leave exhibits more modest differences between the less-than-30 and the 30–35-hours category (12 percentage points). The access rate to sick leave for the 35–40 category is much larger than for the 30–35 categories (36 points). The access rate for the 35–40 category is 5 points higher than for the 40-or-more category.
There is a large difference in access to vacation pay between the less-than-30 and the 30–35-hours categories (31 percentage points). The access rate for the 35–40 category is 20 points greater than for the 30–35 category, and there is a 6 point difference between the 35–40 and 40-or-more-hours categories.
Changes in the work schedule can have unforeseen impacts on access to employee benefits. For instance, the Family and Medical Leave Act (FMLA), which provides eligible employees with up to 12 weeks of unpaid leave per year, requires the employee to have worked for the employer for at least 1,250 hours (approximately 24 hours per week) during the 12 months prior to the start of leave.5 In another example, concerns about flu epidemics in recent years have given rise to increased interest in access to sick leave, and some states and cities have since instituted laws that require employers to provide paid sick leave.6 Connecticut now requires that employers with 50 or more employees provide paid sick leave at an accrual rate of at least 1 hour per 40 hours worked.7 Under San Francisco’s mandatory paid-sick-leave law, employees must accrue at least 1 hour of sick leave for every 30 hours worked.8
Figures 1 through 5 give a visual representation of how access rates to retirement, health, and leave benefits vary depending upon scheduled weekly hours as well as by employment in higher or lower hour industries (refer back to tables 1, 3, and 4). In particular, these figures help illustrate changes in access to benefits that a worker might face as a result of a reduction of weekly work hours.
For retirement benefits (figure 1), access in the less-than-30-hours category is greater in the lower hour industries; this may be related to the high concentration of employees in lower hour industries who are scheduled to work less than 30 hours per week. Access rates for 30–35-hour-per-week categories for the higher and lower hour industries are not statistically different, while access rates in both the 35–40 and 40-or-more categories are greater in the higher hour industries.

| Industry group | Scheduled weekly hours | |||
|---|---|---|---|---|
| At least 40 hours | 35 to less than 40 hours | 30 to less than 35 hours | Less than 30 hours | |
| Total industries | 74 | 71 | 40 | 38 |
| Higher hour industries | 77 | 74 | 37 | 34 |
| Lower hour industries | 59 | 51 | 44 | 41 |
| Source: National Compensation Survey, U.S. Bureau of Labor Statistics. | ||||

| Industry group | Scheduled weekly hours | |||
|---|---|---|---|---|
| At least 40 hours | 35 to less than 40 hours | 30 to less than 35 hours | Less than 30 hours | |
| All industries | 86 | 80 | 44 | 24 |
| Higher hour industries | 89 | 84 | 44 | 25 |
| Lower hour industries | 74 | 62 | 44 | 24 |
| Source: National Compensation Survey, U.S. Bureau of Labor Statistics. | ||||
Access to health insurance (figure 2) is similar across the two industry groups for the less-than-30 and 30–35-hours categories but is greater in the higher hour industries for both the 35–40 and the 40-or-more-hours categories. A comparison of figures 3 and 4 indicates that access rates to holiday pay and sick leave are greater for higher-hour industries for all of the hours-per-week categories.

| Industry group | Scheduled weekly hours | |||
|---|---|---|---|---|
| At least 40 hours | 35 to less than 40 hours | 30 to less than 35 hours | Less than 30 hours | |
| All industries | 91 | 85 | 60 | 37 |
| Higher hour industries | 93 | 89 | 66 | 44 |
| Lower hour industries | 80 | 65 | 53 | 31 |
| Source: National Compensation Survey, U.S. Bureau of Labor Statistics. | ||||

| Industry group | Scheduled weekly hours | |||
|---|---|---|---|---|
| At least 40 hours | 35 to less than 40 hours | 30 to less than 35 hours | Less than 30 hours | |
| All industries | 74 | 75 | 40 | 23 |
| Higher hour industries | 76 | 81 | 45 | 33 |
| Lower hour industries | 64 | 50 | 32 | 16 |
| Source: National Compensation Survey, U.S. Bureau of Labor Statistics. | ||||
A notable difference across the two industry groups pertains to access to sick leave benefits (figure 4). In higher hour industries, the access rate for sick leave in the 35–40 hour category is 36 percentage points higher than in the 30–35 hour category (81 percent and 45 percent, respectively). Put another way, the access rate drops by 44 percent when shifting from 35–40 hours to 30–35 hours per week.9 By comparison, the 18-percentage-point difference between these same 35–40 hours and 30–35-hours-per-week categories in the lower hour industries represents a 36-percent drop in access. Now consider the shift from the 30–35-hour category to the less-than-30-hours category. In the higher hour industries, there is a 12-percentage-point difference between these categories (45 percent and 33 percent, respectively), representing a 27-percent drop in access. In contrast, the 16- percentage-point difference between these categories in the lower hour industries (32 percent and 16 percent, respectively) represents a 50-percent drop in access to sick leave.

| Industry group | Scheduled weekly hours | |||
|---|---|---|---|---|
| At least 40 hours | 35 to less than 40 hours | 30 to less than 35 hours | Less than 30 hours | |
| All industries | 91 | 86 | 65 | 34 |
| Higher hour industries | 93 | 87 | 67 | 36 |
| Lower hour industries | 84 | 82 | 62 | 33 |
| Source: National Compensation Survey, U.S. Bureau of Labor Statistics. | ||||
For vacation pay (figure 5), the only statistically significant difference across the two industry groups is for the 40-or-more-hours-per-week category (93 percent in the higher hour industries compared with 84 percent in the lower hour industries.
Besides reducing earnings, a decrease in weekly hours is likely to affect access to employee benefits. Moreover, this impact varies depending upon whether a person is employed in a higher hour industry, where full-time jobs are more prevalent, or in a lower hour industry, where jobs are more evenly divided between full time and part time.
For workers overall, access rates for all benefits are greater in the higher hour industries by statistically significant margins (refer back to tables 3 and 4). The differences in access rates between higher hour and lower hour industries range from 21 percentage points for retirement, to 26 points for vacation, to 31 points each for health, holiday, and sick leave. For full-time workers, benefit access is also greater across the two industry groups. In this case the differences are less dramatic, however, ranging from 7 percentage points for vacation pay to 19 points for retirement benefits. For part-time workers, access to retirement benefits is greater in lower hour industries (9 points); access to holiday pay and sick leave is greater in the higher hour industries (13 points and 16 points, respectively); and there is no statistically significant difference between access rates for health insurance or vacation pay across the two industry groups.
!--?pagebreak?-->!--?pagebreak?-->!--?pagebreak?-->John L. Bishow, "The relationship between access to benefits and weekly work hours," Monthly Labor Review, U.S. Bureau of Labor Statistics, June 2015, https://doi.org/10.21916/mlr.2015.18
1 More about Employer Shared Responsibility provisions can be found at http://www.irs.gov/Affordable-Care-Act/Employers/Employer-Shared-Responsibility-Provisions.
2 By way of comparison, the BLS Current Employment Survey (CES) reports 34.5 average weekly hours for all workers in private industry for March 2013. See https://data.bls.gov/pdq/querytool.jsp?survey=ce.
3 In the National Compensation Survey (NCS), employees are classified full time or part time as defined by their employer. The Current Population Survey (CPS) and the American Time Use Survey (ATUS) both classify full-time workers as people who work 35 hours or more per week. (See the BLS Glossary at https://www.bls.gov/bls/glossary.htm.)
4 For example, when looking at retirement benefits in table 1, it appears that there is a difference of 3 percentage points between the two highest hours-worked categories (35-40 hours compared with 40 or more hours per week). However, because the difference is not statistically significant it is not mentioned in the text.
5 More information on the FMLA is available at the Department of Labor website, http://www.dol.gov/whd/fmla/fmla-faqs.htm.
6 “Paid sick leave in the United States,” Program Perspectives, March 2010, https://www.bls.gov/opub/btn/archive/program-perspectives-on-paid-sick-leave-pdf.pdf.
7 For more information on the Connecticut law, see http://www.ctdol.state.ct.us/wgwkstnd/SickLeaveGuidance.pdf.
8 For more information on the San Francisco paid sick leave law see, http://www.amlegal.com/nxt/gateway.dll/California/administrative/chapter12wsickleave*?f=templates$fn=default.htm$3.0$vid=amlegal:sanfrancisco_ca.
9 The percentage drop in access discussed here refers to the percentage change associated with moving from one hours-per-week category to another. For example, in the higher hour industries, where access to sick leave is 81 percent in the 35–40-hours per-week category compared with 45 percent in the 30–35-hours category, the percentage change was calculated as (81-45)/81 X 100=44%.