
An official website of the United States government
An official website of the United States government
The .gov means it's official.
Federal government websites often end in .gov or .mil. Before sharing sensitive information,
make sure you're on a federal government site.
The site is secure.
The
https:// ensures that you are connecting to the official website and that any
information you provide is encrypted and transmitted securely.

Crossref 0
Safety Behaviour of Heavy Truck Drivers in International Transport, TRANSBALTICA XIV: Transportation Science and Technology, 2024.
Comparisons of Traffic Collisions between Expressways and Rural Roads in Truck Drivers, Safety and Health at Work, 2016.
Fatal occupational injuries in North Carolina, 1992–2017, Occupational and Environmental Medicine, 2023.
In 2012, the rates of fatal injuries and nonfatal injuries and illnesses of truck drivers of both heavy and tractor-trailer and smaller delivery trucks were higher than the average of all private industry occupations. From 2003 to 2007, the number of fatal injuries for truck drivers, particularly tractor-trailer drivers, increased. However, during the economic downturn, fatal injuries decreased, with the lowest in 2009. Most fatal injuries were transportation incidents. Nonfatal injuries and illnesses of truck drivers decreased from 2003 to 2012. Most nonfatal injuries and illnesses were not transportation incidents but were incidents of overexertion and bodily reaction; falls, slips, and trips; and contact with object or equipment.
During 2012, 756 truck drivers lost their lives in work-related incidents, while over 65,000 private sector truck drivers suffered injuries and illnesses that resulted in time away from work according to the U.S. Bureau of Labor Statistics (BLS) Census of Fatal Occupational Injuries (CFOI) and Survey of Occupational Injuries and Illnesses (SOII).1 Truck drivers, along with driver/sales workers, had a workplace fatal injury rate of 24.3 in 2012, more than 7 times higher than the overall workplace average. Their rate of nonfatal injuries and illnesses involving days away from work was 294.7 cases per 10,000 full-time workers, almost 3 times the rate for all private industry occupations.
The BLS Occupational Safety and Health Statistics program classifies truck drivers into two occupational groups. Heavy and tractor-trailer truck drivers drive the biggest vehicles on the road, defined as having a capacity of at least 26,000 pounds gross vehicle weight. Light truck or delivery service drivers drive smaller trucks, those under 26,000 pounds gross vehicle weight. In addition to their driving duties, truck drivers may be required to unload the vehicles. In 2012, 10,659,380 large trucks (defined as having a gross vehicle weight greater than 10,000 pounds) were on the roads, traveling a total of more than 268 billion miles.2
The scope of workers covered by CFOI and SOII differs. CFOI is an annual census that counts all fatal injuries in the United States. It includes all workers in the United States: the self-employed, federal government workers, resident military, and volunteers. Of the fatally injured truck drivers in 2012, 13 percent were self-employed. SOII is an annual survey that collects data on occupational injuries and illnesses from a sample of private industry establishments, as well as state and local governments. SOII excludes the self-employed, federal government and U.S. Postal Service workers, and workers on farms with fewer than 11 employees.3
The Federal Motor Carrier Safety Administration, an agency within the U.S. Department of Transportation (DOT), regulates the hours of service that truckers are allowed to drive. Regulations of hours worked intend to reduce incidents resulting from tired or drowsy drivers.4 The regulations state that drivers may
· drive a maximum of 11 hours after 10 consecutive hours off duty;
· not drive beyond the 14th consecutive hour after coming on duty, following 10 consecutive hours off duty (off-duty time does not extend the 14-hour period);
· drive only if 8 hours or less have passed since the end of the driver’s last off-duty or sleeper-berth period of at least 30 minutes;
· not drive after 60/70 hours on duty in 7/8 consecutive days; and
· may restart a 7/8 consecutive day period after taking 34 or more consecutive hours off duty.
Estimates vary on the number of accidents caused by driver fatigue. Data from BLS do not measure the role of driver fatigue in truck driver injuries. However, according to a DOT 2006 study, sleep was a factor in 4 percent of all truck drivers involved in a crash and in 13 percent of single-vehicle crashes.5
In 2012, according to DOT, 3,921 people were killed in crashes involving large trucks (gross vehicle weight greater than 10,000 pounds).6 This total includes the drivers of the trucks and any other fatalities resulting from crashes involving large trucks. Most of these fatalities are not counted in the CFOI, because they are not considered work related. For example, if a large truck strikes a passenger car, killing the driver of the car en route to the grocery store, the driver of the car is not considered in work status and thus is not counted in the CFOI. Such cases, however, are important to consider when CFOI assesses the impact of trucking safety measures. The CFOI would count the drivers of the trucks and anyone else involved in these crashes who was in work status at the time of the incident.
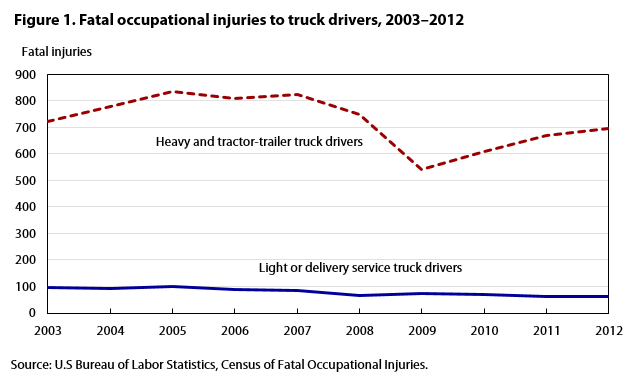
Fatal injuries to truck drivers increased from 2003 to 2007 and decreased from 2008 to 2009, particularly for heavy and tractor-trailer truck drivers (see figure 1). During the 2003 to 2012 period, 2009 had the lowest number of fatal injuries to truck drivers. Fatal injuries to truck drivers increased in 2010, 2011, and 2012.
| Year | Number of fatal injuries and illnesses to heavy and tractor-trailer truck drivers | Number of fatal injuries to light or delivery service truck drivers |
|---|---|---|
| 2003 | 722 | 96 |
| 2004 | 779 | 94 |
| 2005 | 836 | 99 |
| 2006 | 807 | 90 |
| 2007 | 822 | 85 |
| 2008 | 749 | 67 |
| 2009 | 540 | 72 |
| 2010 | 610 | 71 |
| 2011 | 670 | 64 |
| 2012 | 695 | 61 |
| Source: U.S Bureau of Labor Statistics, Census of Fatal Occupational Injuries. | ||
As may be expected considering how much time truckers spend on the road, 81 percent of fatal injuries to tractor-trailer drivers or delivery truck drivers were transportation incidents. Seventy percent of fatal injuries were due to roadway incidents involving a motorized land vehicle, including collisions with other vehicles (27 percent). Another 8 percent were pedestrian vehicular incidents. Examples include a vehicle on the side of the road striking a tow truck driver and a vehicle striking a truck driver while loading or unloading in the employer’s parking lot. For tractor-trailer drivers, 56 fatal injuries involved contact with objects and equipment (8 percent); 28 due to falls, slips, or trips (4 percent); 16 suicides (2 percent); and 9 homicides (1 percent). Robbers committed two of the homicides.
Many (79 percent) of the fatally injured truck drivers were employed in the trade, transportation, and utilities industry, for example, trucking companies. Another 14 percent were employed in goods-producing industries, such as mining, construction, and manufacturing. The majority were wage and salary workers (87 percent), while 13 percent were self-employed. For fatally injured tractor-trailer drivers, 32 percent were between 45 and 54 years of age. Another 24 percent were from ages 55 to 64. Among delivery drivers, 20 percent were 65 or older, a higher percentage than for all occupations (13 percent). A majority of the fatally injured truck drivers (67 percent) were white, non-Hispanic. Another 15 percent were black or African American, non-Hispanic, and 14 percent were Hispanic or Latino.
The vast majority of fatally injured truck drivers were tractor-trailer drivers (92 percent). The state with the most incidents of fatal injuries for these drivers in 2012 was Texas, with 121 fatal injuries (see table 1). This figure was more than twice that of any other state. The states with the next highest fatal injury counts for these drivers were California (54), Florida (29), and Illinois (26). The CFOI uses the state of incidence to compile data. As an example, if a driver set out from New Jersey, got into a serious accident in Pennsylvania, and then was taken by ambulance to a hospital in Ohio, the case would be counted in Pennsylvania’s total.
| State | Counts of fatal injuries | Percent of fatal injuries |
|---|---|---|
| Texas | 121 | 17 |
| California | 54 | 8 |
| Florida | 29 | 4 |
| Illinois | 26 | 4 |
| Oklahoma | 24 | 3 |
| Pennsylvania | 24 | 3 |
| Ohio | 23 | 3 |
| Georgia | 22 | 3 |
| All other states | 372 | 54 |
| Total | 695 | 100 |
| Source: U.S. Bureau of Labor Statistics, Census of Fatal Occupational Injuries. | ||
Driving in the winter, especially in northern states, often entails dealing with snow, sleet, and ice. During the summer months, however, the roads have more traffic. Overall, truck driver fatal injuries in 2012 were slightly higher in summer and fall months (see table 2). In northern states, a slightly higher percentage of fatal injuries occurred in the winter months, December through February.7 Using a chi-square test, we found a p-value of 0.294 for the difference in percentage of fatal injuries occurring in winter months between northern and southern states. Although this result was not highly statistically significant, the difference more likely than not resulted from other than random chance.
| Months | All United States | Northern states (1) | Southern states | p-value (north–south) | |||
|---|---|---|---|---|---|---|---|
| Number | Percent | Number | Percent | Number | Percent | ||
| All | 756 | 100 | 229 | 100 | 527 | 100 | — |
| December–February | 180 | 24 | 61 | 27 | 119 | 23 | 0.29 |
| March–May | 182 | 24 | 51 | 22 | 131 | 25 | .51 |
| June–August | 200 | 26 | 58 | 25 | 142 | 27 | .69 |
| September–November | 194 | 26 | 59 | 26 | 135 | 26 | .97 |
| Note: (1) Northern states include Alaska, Connecticut, Idaho, Illinois, Indiana, Iowa, Maine, Massachusetts, Michigan, Minnesota, Montana, Nebraska, New Hampshire, New Jersey, New York, North Dakota, Ohio, Oregon, Pennsylvania, Rhode Island, South Dakota, Vermont, Washington, Wisconsin, and Wyoming. Source: U.S. Bureau of Labor Statistics, Census of Fatal Occupational Injuries | |||||||
In 2012, 50 truck drivers were killed in incidents in which more than one fatal work-related injury occurred. Of these, 49 (98 percent) were transportation incidents. In 17 cases (34 percent), two or more vehicles collided while moving in opposite directions, and in 14 cases (28 percent), the vehicles struck an object on the side of the roadway.
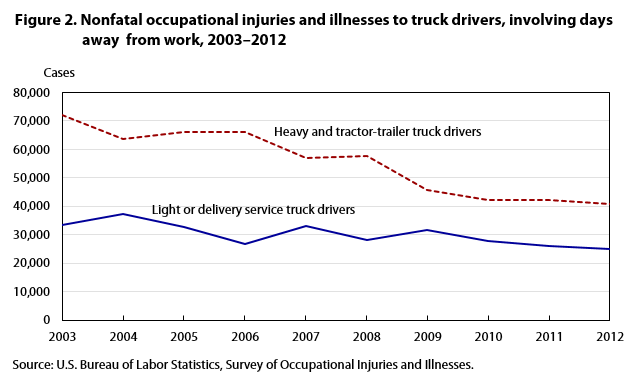
Nonfatal injuries and illnesses to truck drivers trended downward each year from 2003 to 2012. Although fewer injury and illness cases occurred during the economic downturn than before it, the decline in such cases has continued during the recovery (see figure 2).
| Year | Number of nonfatal injuries and illnesses to heavy and tractor-trailer truck drivers | Number of nonfatal injuries and illnesses to light or delivery service truck drivers |
|---|---|---|
| 2003 | 71,900 | 33,280 |
| 2004 | 63,570 | 37,160 |
| 2005 | 65,930 | 32,740 |
| 2006 | 66,040 | 26,760 |
| 2007 | 57,050 | 32,930 |
| 2008 | 57,700 | 28,040 |
| 2009 | 45,610 | 31,600 |
| 2010 | 42,140 | 27,800 |
| 2011 | 42,270 | 25,860 |
| 2012 | 40,580 | 24,860 |
| Source: U.S Bureau of Labor Statistics, Survey of Occupational Injuries and Illnesses. | ||
The nonfatal injuries and illnesses were mostly not related to transportation incidents. For delivery drivers, 13 percent of the injuries and illnesses were due to transportation incidents, which trailed overexertion and bodily reaction (41 percent); falls, slips, and trips (23 percent); and contact with object or equipment (19 percent). For tractor-trailer drivers, the leading causes of nonfatal cases also were overexertion and bodily reaction (35 percent); falls, slips, and trips (30 percent); contact with object or equipment (17 percent); and transportation incidents (14 percent).
Key findings from the SOII include the following:
· Floors, walkways, and ground surfaces were the sources of injury of 61 percent of those delivery truck drivers who were injured as a result of falls, slips, and trips. In 7 percent of the falls, slips, and trips cases, the secondary source group was ice, sleet, or snow.8 In a case in which a truck driver slipped on ice, fell to the ground, and suffered an injury, the ground would be coded as the primary source and the ice would be the secondary source.
· Among tractor-trailer drivers injured by contact with objects or equipment, a vehicle was the source of injury 28 percent of the time. For delivery truck drivers, this figure was 31 percent.
· Of the overexertion injuries to delivery truck drivers, 40 percent were due to lifting containers, such as boxes or packages, and 34 percent were due to lifting or lowering objects.
Among private sector workers with injuries requiring days away from work, 43 percent were age 45 or older. This percentage was the about same for injured delivery truck drivers, but among injured tractor-trailer truck drivers, this figure was 62 percent. Forty-three percent of the injured delivery truck drivers had 5 or more years of service. Both groups of injured truck drivers took more days to recover than the median of 8 days for all injured workers. The median number of days away from work for tractor-trailer truck drivers was 19, and the median for delivery truck drivers was 15.
From 2003 to 2012, injuries and illnesses involving days away from work declined 44 percent for tractor-trailer drivers and 25 percent for delivery drivers. This decline in injury and illness cases occurred over the entire workforce, with cases falling 30 percent for all private industry occupations.
Truck drivers experienced higher than average rates of both fatal injuries and nonfatal injuries and illnesses compared with all private industry occupations in 2012. Over the 2003 to 2012 period, the number of both fatal injuries and nonfatal injuries and illnesses to truck drivers decreased. The majority of fatal injuries were from transportation incidents, although nonfatal cases were more likely caused by overexertion, falls, and contact with objects.
!--?pagebreak?-->!--?pagebreak?-->!--?pagebreak?-->Sean M. Smith, "Workplace hazards of truck drivers," Monthly Labor Review, U.S. Bureau of Labor Statistics, April 2015, https://doi.org/10.21916/mlr.2015.8
1 Data on fatal injuries are from “Census of Fatal Occupational Injuries (CFOI)” (U.S. Bureau of Labor Statistics, 2009), https://www.bls.gov/iif/oshcfoi1.htm. Fatal injuries in this article are based on revised counts for 2012. Data on nonfatal injuries and illnesses are from the Survey of Occupational Injuries and Illnesses (SOII) program, which collects data from a sample of business establishments in the United States; see “Injuries, illnesses, and fatalities” (IFF) (U.S. Bureau of Labor Statistics), https://www.bls.gov/iif/home.htm. For more information on both the CFOI and SOII programs, see “Occupational safety and health statistics,” BLS Handbook of Methods, chapter 9 (U.S. Bureau of Labor Statistics), https://www.bls.gov/opub/hom/p df/homch9.pdf. The IFF program uses the Occupational Injury and Illness Classification System (OIICS) to define event or exposure, nature, part of body, and source; see “Injuries, illnesses, and fatalities,” Occupational Injury and Illness Classification Manual (U.S. Bureau of Labor Statistics), https://www.bls.gov/iif/oshoiics.htm. Occupation is defined using the Standard Occupational Classification (SOC) system; see Standard Occupational Classification (U.S. Bureau of Labor Statistics), https://www.bls.gov/soc/home.htm. Industry is defined using the North American Industrial Classification System (NAICS); see “BLS information” (U.S. Bureau of Labor Statistics), https://www.bls.gov/bls/naics.htm.
2 “Commercial motor vehicle facts,” 2014 Pocket Guide to Large Truck and Bus Statistics (Federal Motor Carrier Safety Administration, October 2014).
3 “Occupational safety and health statistics,” BLS Handbook of Methods.
4 For more information on the regulations, see “Summary of hours of service regulations” (Federal Motor Carrier Safety Administration, December 2014).
5 “Weighted number of involved vehicles by critical reason (general Level, and specific level), crash type, and vehicle type,” table 13, Large-Truck Crash Causation Study: An Initial Overview, National Highway Traffic Safety Administration (U.S. Department of Transportation, August 2006), p. 24, http://www-nrd.nhtsa.dot.gov/Pubs/810646.pdf.
6 2014 Pocket Guide to Large Truck and Bus Statistics, “Commercial motor vehicle facts.”
7 “Summary of hours of service regulations” (Federal Motor Carrier Safety Administration).
8 The “source” (also referred to as primary source) and “secondary source” identify the objects, substances, equipment, and other factors that were responsible for the injury or illness incurred by the worker or that precipitated the event or exposure.