
An official website of the United States government
An official website of the United States government
The .gov means it's official.
Federal government websites often end in .gov or .mil. Before sharing sensitive information,
make sure you're on a federal government site.
The site is secure.
The
https:// ensures that you are connecting to the official website and that any
information you provide is encrypted and transmitted securely.

Crossref 0
Benefits (and Rewards), Strategic Compensation and Talent Management, 2026.
Direct, Absenteeism, and Disability Cost Burden of Obesity Among Privately Insured Employees, Journal of Occupational & Environmental Medicine, 2020.
In this article, we examine the factors explaining differences in public and private sector health insurance premiums for enrollees with single coverage. We use data from the 2000 and 2014 Medical Expenditure Panel Survey-Insurance Component, along with decomposition methods, to explore the relative explanatory importance of plan features and benefit generosity, such as deductibles and other forms of cost sharing, basic employee characteristics (e.g., age, gender, and education), and unionization. While there was little difference in public and private sector premiums in 2000, by 2014, public premiums had exceeded private premiums by 14 to 19 percent. We find that differences in plan characteristics played a substantial role in explaining premium differences in 2014, but they were not the only, or even the most important, factor. Differences in worker age, gender, marital status, and educational attainment were also important factors, as was workforce unionization.
With many state and local governments facing difficult fiscal challenges in recent years, the compensation of public employees has come under increased scrutiny. Although the cost of health insurance benefits for active workers is not perceived as a “crisis” in the way underfunded pensions are, health benefits in 2014 were the costliest voluntary nonwage benefit for employers.1 Over the past decade and a half, that cost has grown more rapidly in the public sector than in the private sector. According to data from the U.S. Bureau of Labor Statistics, between 2000 and 2014, health insurance costs as a share of total compensation rose by roughly 4 percentage points for nonfederal public sector employers, compared with roughly 2 percentage points for private sector employers. Data from the Medical Expenditure Panel Survey-Insurance Component (MEPS-IC), which we use in this study, show that, in 2000, average health insurance premiums for single coverage were 10 percent higher for local government enrollees than for private sector enrollees; however, by 2014, that difference had grown to 19 percent. Public sector enrollees also generally contribute a smaller proportion of total premium costs than do private sector enrollees (e.g., 13 percent for local enrollees versus 24 percent for private enrollees in 2014).
Economic theory predicts that, in competitive labor markets, rising health insurance costs will affect wages. If this is the case, the increase in public sector premiums need not imply an increase in the overall compensation of the sector’s workers. However, recent research suggests that the wages of public sector workers do not adjust to fully offset higher health insurance costs,2 although this result must be interpreted cautiously given limited evidence for a compensating wage differential for health benefits.3
To evaluate the policy and welfare implications of differences in health insurance premiums for public and private sector enrollees, we need to understand the determinants of these differences. One possible explanation for the increasing gap in premiums is that, in certain aspects, public sector health plans have become relatively more generous than private sector plans. This may have occurred if, for example, private employers have been more aggressive than public employers in increasing deductibles and other forms of cost sharing in response to rising healthcare costs. If this is the case, public sector benefits can be seen as increasing in value relative to private sector benefits. Without a corresponding decline in wages, this increase would imply an increase in compensation. However, public–private differences in premiums will also reflect differences in the demographic characteristics of employees in the two sectors, as public sector employees are more likely to be older and female than private sector workers.
In this article, we examine the factors explaining differences in health insurance premiums for actively employed public and private sector enrollees with single coverage. Specifically, we use data from the 2000–14 MEPS-IC to compare premiums for enrollees at private employers with premiums for enrollees in state and local governments. After documenting changes in mean premiums over our analysis period, we focus on explaining public and private sector premium differences in 2000 and 2014. We use
Over the years, economic research examining public and private sector compensation has produced mixed results. Some analyses have suggested that public sector employees earn more than observationally similar workers in private sector firms, whereas other analyses have found that the compensation gap favors the private sector.4 These conflicting results have been due to differences in analysis periods, in the choice of household or employer data, and in the methods used to control for employee characteristics. However, a consistent finding of this research is that, compared with private sector compensation, public sector compensation has been more heavily weighted toward nonwage benefits. There is also evidence that the public–private benefit gap has grown in recent years.
In terms of cost, health insurance is the most important voluntary nonwage employee benefit, representing 8.4 percent of total compensation and 26.5 percent of the cost per hour worked for nonwage benefits at the end of 2014.5 Several largely descriptive studies using different data sources indicate that, in the early 2000s, premiums were similar between sectors, but that since then, premiums for plans offered to public employees have grown faster than those offered to private employees. Using data from the 2004 Kaiser/HRET Employer Health Benefits Annual Survey to compare private and public sector managed-care offerings, Christopher Reddick found that premiums were slightly higher in the public sector.6 More recent Kaiser/HRET survey estimates indicate that, by 2014, the average single coverage premium for nonfederal public enrollees had reached $6,727, compared with $5,646 for private sector enrollees in firms with a for-profit ownership structure.7 Private sector enrollees at not-for-profit organizations had premiums ($6,587) much closer to those for public sector enrollees. Using data from the 2014 MEPS-IC, Karen Davis found that public sector premiums for single coverage were higher than private sector premiums in all census divisions except West South Central.8
Previous studies provided limited information on why plans offered to public employees had higher premiums. Reddick found that, in 2004, private sector employers were more likely than public sector employers to offer alternative health plan options such as high-deductible health plans and health savings accounts.9 In addition, a few studies using semistructured interview data from the Community Tracking Survey examined how employers responded to rising health benefit costs in the early 2000s.10 Survey responses suggested that public employers were more reluctant than private firms to reduce the generosity of health benefits. For example, public employers were less likely to increase copayments for prescription drugs or to introduce tiered formularies that required enrollees to pay more for certain branded drugs.11 Greater unionization in the public sector also served as an important constraint on the ability of state and local governments to cut benefits in response to rising healthcare costs.
In this article, we extend the comparative literature on public and private health insurance premiums. We explicitly consider the extent to which differences in mean premiums for plans covering public and private sector enrollees can be explained by differences in benefit generosity as opposed to differences in workforce and employer characteristics. In other words, do public sector enrollees receive more generous health benefits than their private sector counterparts, or are they just more expensive to insure?
The MEPS-IC is a nationally representative survey of establishments fielded annually by the U.S. Census Bureau under sponsorship by the Agency for Healthcare Research and Quality. Despite its name, this component of the MEPS is not a panel but a repeated cross-section of establishments. The MEPS-IC collects data from employers in the private and public sectors, but public sector information is gathered only from state and local governments, not the federal government.12
In 2014, state and local governments employed 5.3 million and 13.9 million workers, respectively, compared with over 121 million employees in the private sector.13 The MEPS-IC sample of private sector establishments—a sample containing between 30,000 and 35,000 observations in most years—is drawn annually from the most recently updated version of the Business Register, which is maintained by the U.S. Census Bureau. The unit of observation is the establishment, rather than the firm, and it is possible for multiple establishments from a single firm to appear in the sample as separate observations. Roughly two-thirds of the observations are single-unit establishments (for which there is no distinction between the establishment and the firm).
The state and local government sample for the MEPS-IC is much smaller—roughly 3,000 observations per year—but is nationally representative of nonfederal public employees. The public sector data include all state government units and local government units with at least 5,000 employees. These units represent a census and therefore lack a sampling error. The data also include smaller local governments that are sampled from the Census of Governments, with stratification by census division. This sampling is performed at the government-unit level, which is defined as all sites under a single controlling government entity.14 Local governments include counties, municipalities, townships, special districts, and school districts, and most of their employment is in elementary and secondary education. While the activities of state governments span different industries, they are concentrated in higher education, corrections, and hospitals.
The MEPS-IC asks private and public sector employers whether they offer health insurance to their active workers. For those offering insurance, the survey instrument includes detailed plan-level questions for up to four health plans for private sector establishments and all health plans for state and local governments. These questions ask about premiums, plan type, employee premium contributions, coverage of certain benefits (e.g., prescription-drug and dental coverage), whether the plan was self-insured, deductibles, copayment amounts, coinsurance rates, and limits on out-of-pocket spending. The MEPS-IC also collects information on establishment and workforce characteristics, such as the size of the firm or government unit, the percentage of the workforce that is unionized, and whether the employer provides health insurance to retirees.
To examine differences between public and private premiums, we use 2000 and 2014 MEPS-IC data and Oaxaca–Blinder decomposition methods. Because the employer sizes for private sector and local government establishments both range from small (fewer than 10 employees) to large (1,000 or more employees), our local–private comparisons compare premiums for all enrollees in local governments with premiums for all enrollees in the private sector.15 Since all state government employers have at least 1,000 employees—and size is an important predictor of whether an employer offers health insurance and the comprehensiveness of benefits—our comparisons of state government and private sector premiums restrict the sample of private establishments to those in firms with 1,000 or more employees.
We analyze differences in mean public and private sector premiums, as shown in equation (1). We perform these analyses separately with data for 2000 and 2014. In the equation, the subscript  represents each of the 2 years examined, and the subscripts public and private refer to the specific public and private sector establishment types included in each comparison.

We estimate equation (2) as a pooled regression of premiums for public and private sector enrollees for each comparison set:

where  represents the vector of slope and intercept parameters from the pooled regressions within each year for each comparison set, and
 represents the vector of predictors and a constant.
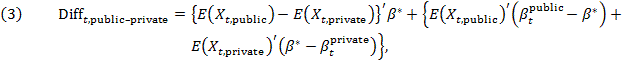
Using equation (2) to calculate the mean difference in premiums in equation (1), we can rearrange the regression coefficients and expected values of our independent variables so that they can be used in an Oaxaca–Blinder decomposition. The decomposition is shown in equation (3), where  represents coefficients from the pooled regressions within each year and each comparison set, and
  and
and  represent coefficients from models run separately for the samples of public and private enrollees in each comparison set. The expected values of the independent variables are estimated with the use of the means of the variables in our samples.
where the explained component  and the unexplained component
  .
.
Note that the interpretation of our results depends on how we interpret the coefficients. If the coefficients reflect a degree of correlation with unobserved variables, we may be attributing differences to a predictor even though the true difference may be due to an unobserved variable. Because this issue is problematic in interpreting our measure of unionization (described below), we perform a number of sensitivity tests to evaluate our results with respect to this measure.
For each year, we show the dollar amount of the premium differences that are due to differences in the characteristics of public and private sector enrollees (i.e., the explained component). The amount for the unexplained component can be calculated as the total mean difference in premiums minus the amount for the explained component. Since we estimate OLS models, we can separate the explained component further, to show the detailed contributions from different predictors (e.g., X1 and X2):

The predictors included in our models are described below.
While our decomposition models are estimated separately for 2000 and 2014, we do not attempt to explicitly decompose the widening gap in premiums over time. Given the large changes that occurred in the employer-sponsored insurance market during our analysis period, it is difficult to select one set of regression coefficients and use it across years. For example, the coefficient on the variable measuring whether a plan had a deductible was large and positive in 2000, but much smaller in 2014. One explanation for this change could be that, in 2000, the coefficient captured the effects of an unmeasured plan characteristic associated with plans with deductibles, but this association was no longer present in 2014.
Because of changes in coefficients over time, the apparent increase in the dollar amount of the contributions to the explained portion of the models likely reflects the effects of changes in coefficients and in plan, employer, and workforce characteristics. To aid readers with interpreting the decomposition results, appendix table A-1 shows selected contributions to the explained portion of the decomposition that were calculated with the use of coefficients from models estimated for both 2000 and 2014. For these selected estimates, the larger dollar contributions in 2014 are due to changing coefficients and widening differences in plan, employer, and workforce characteristics.
In analyzing differences in health insurance premiums, it is important to distinguish between those which are related to the comprehensiveness of benefits and those which are driven by the risk characteristics of employees and employers. Therefore, in our Oaxaca–Blinder models, we include plan, employer, and workforce characteristics. For plan characteristics, we include the following measures: an indicator for whether the plan has an overall deductible, the individual deductible level, hospital and physician coinsurance rates and copayment amounts (including an indicator for whether the hospital copayment is per stay or per day), an indicator for whether the plan has an out-of-pocket maximum, and the maximum out-of-pocket level. We inflate all dollar values to 2014 levels, using the all-items Consumer Price Index for All Urban Consumers.
Premiums may vary by the use of in- and out-of-network providers and the requirement that enrollees visit a gatekeeper before seeing a specialist. For this reason, we define five different plan types, using plan-level MEPS-IC information on provider arrangements and gatekeeper requirements: (1) plans that allow enrollees to visit any providers with no differential cost incentives (e.g., fee-for-service, or FFS, plans), (2) plans with a mixture of in- and out-of-network providers that have a gatekeeper (e.g., point-of-service, or POS, plans), (3) plans with a mixture of providers that do not have a gatekeeper (e.g., preferred-provider organization, or PPO, plans), (4) plans that require enrollees to use in-network providers (e.g., health maintenance organization, or HMO, plans) and do not have a gatekeeper, and (5) HMO plans that do have a gatekeeper (the omitted category).
Since the services covered by a health plan can affect its cost, our models include two indicators for whether the plan covers dental care and prescription drugs. We also include an indicator for whether the plan is self-insured—a feature employers may adopt in an attempt to reduce premium costs—although the evidence for lower premiums for self-insured plans is inconsistent.16
One important distinction between public and private workplaces is that a higher percentage of public sector employees are union members with contractually negotiated benefits. In 2014, 29.8 percent of state government employees and 41.9 percent of local government employees were members of a union, compared with 6.6 percent of private sector employees.17 It is well documented that unionization is associated with higher rates of coverage for health insurance and other nonwage benefits.18 Some research has also noted the various ways in which unions may constrain public employers’ ability to change health insurance benefits.19 Given that some plan design features are unobserved in our data, including unionization as a control variable may account for unobserved differences in benefits (e.g., size of provider network or limits on the formulary for prescription drugs). At the same time, a more unionized workforce also may have characteristics different from those of a workforce that has no, or fewer, unionized workers. In our models, we include a measure for the proportion of the establishment’s workforce that belongs to a union, noting that the coefficient on this variable is difficult to interpret because of possible correlation between our unionization measure and unobserved insurance benefits or unobserved workforce characteristics. To test whether our unionization measure is capturing information on such benefits and characteristics, we perform sensitivity tests by including and excluding this measure and evaluating any resulting changes in plan and workforce contributions toward explaining premium differences.
We also include an establishment-level indicator for whether the employer offers health insurance to retirees. We include this measure at the establishment, rather than the plan, level, because the MEPS-IC does not contain information on which plans might enroll retirees. If retirees are included in the same risk pool as active employees, this could increase premiums because of the greater risk and higher cost associated with insuring older individuals.20 Providing evidence that this might occur, 43 states in 2014 offered non-Medicare eligible retirees and their dependents the same plans as those offered to active employees, and 29 of these states enrolled retirees at a premium rate that also applied to active employees.21 The public sector offers retiree benefits more often than the private sector. This may be due, in part, to a higher concentration of small employers in the private sector, differences in the occupational mix of workers, or both.22
As noted earlier, it is important to identify differences between public and private premiums that are driven by the characteristics of employees in the two sectors. Studies have shown that workers in the public sector are more likely to be older, to be female, to be married, and to have higher levels of education and longer job tenure than private sector workers.23 Since the MEPS-IC public sector data on worker characteristics have relatively high rates of item nonresponse compared with the survey’s private sector data, we impute worker demographic characteristics for all observations in both sectors. This imputation is performed by creating means from the full sample of the 2000 Decennial Census and the 2014 American Community Survey (ACS) and merging them with the MEPS-IC records.
To create these means, we first limit the samples from each data source to adults who are full-time workers (individuals ages 18 to 64 who worked at least 35 hours per week) and employed in state governments, local governments, and the private sector. We average these data at the state and detailed industry levels for private sector workers and at the state level for state and local government workers.24 We construct means for the percentages of workers who are female, married, and married females. We also produce averages for all workers and for female workers who are in the following age groups: 18–25 years, 26–35 years, 36–45 years, 46–55 years, and 56–64 years. In addition, we generate means for workers with the following levels of educational attainment: less than high school, high school diploma, some college, associate’s degree, bachelor’s degree, and graduate degree. Finally, we include state fixed effects to capture variations in the geographic costs of healthcare and other state-level differences. We use plan-level data from the MEPS-IC and weight all estimates by the number of enrollees.
Although premiums for government enrollees were consistently higher than those for private sector enrollees from 2000 to 2014, the gap widened over the period. (See figure 1.) In 2000, average local government premiums were 10 percent higher than private sector premiums ($4,012 versus $3,652), and average state premiums were 3 percent higher than large-firm private premiums ($3,705 versus $3,602). (See table 1.) By 2014, average local government premiums exceeded private sector premiums by $1,106 (19 percent), while state government premiums exceeded large-firm private premiums by $826 (14 percent).
| Year | Local government | State government | Private, all firms | Private, large firms |
|---|---|---|---|---|
|
2000 |
$4,012 | $3,705 | $3,652 | $3,602 |
|
2001 |
4,367 | 3,951 | 3,874 | 3,816 |
|
2002 |
4,868 | 4,299 | 4,208 | 4,141 |
|
2003 |
5,231 | 4,589 | 4,492 | 4,440 |
|
2004 |
5,531 | 4,962 | 4,644 | 4,616 |
|
2005 |
5,652 | 5,336 | 4,837 | 4,792 |
|
2006 |
5,802 | 5,444 | 4,845 | 4,782 |
|
2007 |
5,909 | 5,511 | 4,836 | 4,776 |
|
2008 |
6,016 | 5,578 | 4,826 | 4,770 |
|
2009 |
6,280 | 6,014 | 5,160 | 5,165 |
|
2010 |
6,570 | 6,060 | 5,368 | 5,354 |
|
2011 |
6,541 | 6,316 | 5,499 | 5,523 |
|
2012 |
6,536 | 6,319 | 5,553 | 5,519 |
|
2013 |
6,769 | 6,578 | 5,666 | 5,655 |
|
2014 |
6,945 | 6,670 | 5,839 | 5,844 |
|
Note: Because data were not collected in 2007, estimates for that year are averages of 2006 and 2008 premiums. Premiums are inflated to 2014 dollars with the use of the all-items Consumer Price Index for All Urban Consumers. Differences between local and private premiums and between state government and large-firm private premiums are significant at p < 0.05. Source: Medical Expenditure Panel Survey-Insurance Component, 2000–14. |
||||
| Plan characteristics | 2000 | 2014 | 2000 | 2014 | ||||
|---|---|---|---|---|---|---|---|---|
| Local government | Private, all | Local government | Private, all | State government | Private, large firms | State government | Private, large firms | |
| Premiums (2014 dollars) | 4,012*** | 3,652 | 6,945*** | 5,839 | 3,705* | 3,602 | 6,670*** | 5,844 |
| Plan type (percent) | ||||||||
| Fee for service (FFS) | 9.9** | 7.6 | 4.0** | 5.8 | 13.9*** | 7.7 | 0.5*** | 3.1 |
| Preferred-provider organization (PPO) | 42.7† | 40.4 | 59.9*** | 64.9 | 28.2*** | 42.8 | 59.5*** | 76.6 |
| Point of service (POS) | 14.4*** | 19.5 | 11.3*** | 7.8 | 7.3*** | 17.8 | 9.8*** | 5.1 |
| Health maintenance organization (HMO), with gatekeeper | 30.1 | 28.5 | 14.9*** | 12.1 | 46.5*** | 29.3 | 18.3*** | 7.3 |
| HMO, no gatekeeper | 2.9* | 4 | 9.9 | 9.4 | 4.2*** | 2.4 | 11.9*** | 7.9 |
| Self-insured (percent) | 20.0*** | 34.9 | 37.4*** | 44.8 | 30.0*** | 70.7 | 61.6*** | 80.5 |
| Dental coverage (percent) | 20.5*** | 26.4 | 13.0*** | 17.4 | 14.3*** | 23.2 | 8.1*** | 14.3 |
| Prescription drug coverage (percent) | 97.0* | 95.9 | 97.2** | 98.1 | 95.7 | 95.6 | 94.9*** | 98.2 |
| Cost sharing | ||||||||
| Deductibles (2014 dollars) | 166*** | 229 | 589*** | 1,113 | 145 | 153 | 408*** | 945 |
| Deductibles (> $0) (2014 dollars) | 384*** | 525 | 930*** | 1,350 | 387* | 424 | 666*** | 1,112 |
| Percent with Deductible > $0 | 43.1 | 43.6 | 63.4*** | 82.5 | 37.4 | 36.1 | 61.2*** | 85 |
| Copayments | ||||||||
| Hospital copayment (2014 dollars) | 90 | 88 | 153 | 139 | 54*** | 77 | 174*** | 83 |
| Hospital copayment if > $0 (2014 dollars) | 358† | 407 | 459*** | 585 | 186*** | 343 | 381† | 418 |
| Percent with copayment per hospital stay | 22.3** | 18.8 | 30.0*** | 19.6 | 25.3*** | 20 | 45.8*** | 17.7 |
| Physician copayment (2014 dollars) | 11*** | 13 | 17** | 16 | 10*** | 13 | 15*** | 13 |
| Physician copayment if > $0 (2014 dollars) | 16*** | 18 | 22*** | 25 | 14*** | 17 | 20*** | 24 |
| Coinsurance rates (percent) | ||||||||
| Hospital coinsurance rate | 6.5** | 7.3 | 10.7*** | 13.5 | 5.9** | 6.6 | 8.3*** | 15 |
| Hospital coinsurance rate if > 0 | 16.9 | 16.9 | 19.2*** | 20.1 | 16.2 | 15.9 | 18.6*** | 19.4 |
| Physician coinsurance rate | 4.5** | 3.7 | 4.0*** | 6.3 | 0.1*** | 3.8 | 3.5*** | 8.3 |
| Physician coinsurance rate if > 0 | 17.7 | 18 | 19.3** | 20.3 | 17.5 | 17.6 | 18.9*** | 20.1 |
| Out-of-pocket maximum (2014 dollars) | 1,367*** | 1,555 | 2,812*** | 3,263 | 1,226*** | 1,529 | 3,271 | 3,250 |
| No maximum (percent) | 32.3 | 32.4 | 9.2 | 8.7 | 45.9*** | 31.5 | 4.1*** | 7.0 |
| Maximum if > $0 (2014 dollars) | 2,027*** | 2,299 | 3,098*** | 3,575 | 2,265 | 2,233 | 3,412† | 3,496 |
| Number of enrollees (thousands) | 3,569 | 29,500 | 4,326 | 29,000 | 1,369 | 13,900 | 1,550 | 15,100 |
| †p < 0.10, *p < 0.05, **p < 0.01, ***p < 0.001 Note: Dollar measures are inflated to 2014 dollars with the use of the all-items Consumer Price Index for All Urban Consumers. Significant differences between local and private plans are indicated on the local government estimate. Significant differences between state and large-firm private plans are indicated on the state government estimate. Estimates are weighted by the number of enrollees in the plan. Source: 2000 and 2014 Medical Expenditure Panel Survey-Insurance Component. | ||||||||
In table 2, we present the results of the Oaxaca–Blinder decomposition models for public–private premium differences in 2000 and 2014. As discussed earlier, we estimate our decomposition models separately for the 2 years and compare (1) premiums for local government enrollees with those for all private enrollees and (2) premiums for state government enrollees with those for private sector enrollees in large firms. The estimates in table 2 show the contributions of differences in plan, worker, and employer characteristics toward explaining premium differences for public and private sector enrollees. They also show the remaining unexplained portion from the models.25
| Plan characteristics | Local government–all private firms | State government–large private firms | ||
|---|---|---|---|---|
| 2000 (2014 dollars) | 2014 | 2000 (2014 dollars) | 2014 | |
| Premiums | ||||
| Public | $4,012 | $6,945 | $3,705 | $6,670 |
| Private | 3,652 | 5,839 | 3,602 | 5,844 |
| Difference | 360*** | 1,106*** | 103** | 826*** |
| Difference contributed by | ||||
| Plan characteristics | 12 | 174*** | -24 | 206*** |
| Selected plan characteristics | ||||
| Deductibles | 11* | 135*** | 9† | 169*** |
| Hospital copayments | 2 | -0.3 | 26** | -29 |
| Hospital coinsurance | 7* | 32*** | 8* | 137*** |
| Physician out of pocket | 0.4 | 15* | -2 | 18 |
| Out-of-pocket maximums | 3 | 32*** | 6 | 10† |
| Plan type | 7 | -24*** | -42** | -58** |
| Dental | -20*** | -13** | -29*** | -28** |
| Prescription drug coverage | 2 | -4 | 0.3 | -13† |
| Self-insured | -10** | -0.1 | -28** | -13† |
| Age, marital status, female | 57 | 304*** | -212** | 280*** |
| Educational attainment | 112*** | 162** | 248*** | 78 |
| Unionization | 245*** | 336*** | 184*** | 181*** |
| Retiree health insurance offered | -33 | 70* | -48 | 98** |
| Firm/government unit size | -103*** | -88*** | — | — |
| State fixed effects | -4 | -32** | 19 | -35** |
| Total explained | 277*** | 925*** | 138 | 796*** |
| Residual/unexplained | 83 | 181* | -35 | 30 |
| †p < 0.10, *p < 0.05, **p < 0.01, ***p < 0.001 Note: Premiums, deductibles, and copayment amounts for 2000 are inflated to 2014 dollars with the use of the all-items Consumer Price Index for All Urban Consumers. "Total explained" may differ from the sum of individual contributions because of rounding. Plan characteristics: total deductibles, positive deductible indicator, hospital and physician copayments and coinsurance rates, hospital copayment per stay indicator, out-of-pocket maximum, no-out-of-pocket maximum indicator, plan type indicators (HMO, no gatekeeper; PPO; POS; FFS; HMO, with gatekeeper (omitted category)), dental coverage and prescription drug coverage indicators. Selected plan characteristics: deductibles (total deductibles, positive deductible indicator), hospital copayments (hospital copayment and hospital copayments per stay indicator), physician out of pocket (physician copayment and physician coinsurance), out-of-pocket maximums (out-of-pocket maximum, no-out-of-pocket maximum indicator), plan type (indicators for HMO, no gatekeeper; PPO; POS; FFS; HMO, with gatekeeper (omitted category)). Age, marital status, female: 26–35 years, 36–45 years, 46–55 years, 56 or more years; married, female, married female, female and in specified age categories (omitted categories: 18–25 years, female and 18–25 years of age). Educational attainment: high school completed, some college, associate’s degree, bachelor’s degree, graduate degree (omitted category: less than high school). Firm/government unit size: 10–24 employees, 25–99 employees, 100–499 employees, 500–999 employees, and 1,000 or more employees (omitted category: fewer than 10 employees). Source: Authors' calculations using the 2000 and 2014 Medical Expenditure Panel Survey-Insurance Component with merged data from the 2000 Decennial Census and the 2014 American Community Survey. | ||||
Overall, the Oaxaca–Blinder model’s explained effects, which reflect the contributions of differences in characteristics between the public and private sectors, are very important for understanding why public premiums were higher than private sector premiums in both years. For example, in our local–private models, differences in characteristics explained $277 of the $360 premium gap in 2000 and $925 of the $1,106 premium gap in 2014. The explanation for these findings is multifaceted. In 2000, a more educated workforce and a higher rate of unionization contributed toward the relatively high premiums for local government enrollees, but plan characteristics, as a group, did not have a significant contribution because of the offsetting positive and negative effects of specific plan characteristics. By 2014, however, differences in plan characteristics were important in explaining premium differences, as were differences in demographic characteristics, rates of unionization, and the possibility that retirees were included in the insurance plans’ risk pools. Below, we discuss the detailed results from the decomposition models (table 2), alongside descriptive characteristics for the two sectors (tables 1, 3, and 4).
| Establishment characteristics | 2000 | 2014 | 2000 | 2014 | ||||
|---|---|---|---|---|---|---|---|---|
| Local government | Private, all | Local government | Private, all | State government | Private, large firms | State government | Private, large firms | |
| Firm or government unit size | ||||||||
| Less than 10 employees | 1.1*** | 9.6 | 0.8*** | 5.8 | — | — | — | — |
| 10–24 employees | 1.2*** | 8.6 | 1.2*** | 6.7 | — | — | — | — |
| 25–99 employees | 5.4*** | 14.6 | 4.6*** | 14.4 | — | — | — | — |
| 100–499 employees | 20.1*** | 15.2 | 18.7** | 15.8 | — | — | — | — |
| 500–999 employees | 11.8*** | 5.0 | 12.6*** | 5.3 | — | — | — | — |
| 1,000 or more employees | 60.3*** | 47.1 | 62.2*** | 52.0 | 100.0 | 100.0 | 100.0 | 100.0 |
| Workers belonging to a union at enrollee's establishment | 29.8*** | 4.5 | 35.3*** | 4.7 | 32.6*** | 6.5 | 30.4*** | 6.2 |
| Enrollees’ employer offers retiree health insurance | 70.7*** | 27.9 | 77.7*** | 25.5 | 98.7*** | 48.0 | 88.6*** | 42.6 |
| **p < 0.01, ***p < 0.001 Note: Estimates are weighted by the number of enrollees in the plan. Significant differences between local and private plans are indicated on the local government estimate. Significant differences between state and large-firm private plans are indicated on the state government estimate. Source: 2000 and 2014 Medical Expenditure Panel Survey-Insurance Component. | ||||||||
| Worker characteristics | 2000 | 2014 | 2000 | 2014 | ||||
|---|---|---|---|---|---|---|---|---|
| Local government | Private, all | Local government | Private, all | State government | Private, large firms | State government | Private, large firms | |
| Age | ||||||||
| 18–25 years | 6.3*** | 13.5 | 5.7*** | 11.2 | 6.1*** | 13.4 | 5.7*** | 11.1 |
| 26–35 years | 22.5*** | 28.1 | 21.4*** | 25.7 | 21.7*** | 27.9 | 21.3*** | 25.6 |
| 36–45 years | 29.6*** | 29.3 | 25.0*** | 24.1 | 29.9*** | 29.4 | 25.0*** | 24.0 |
| 46–55 years | 30.6*** | 21.0 | 28.3*** | 24.3 | 31.1*** | 21.3 | 28.3*** | 24.5 |
| 56 years or older | 11.0*** | 8.1 | 19.6*** | 14.7 | 11.2*** | 8.1 | 19.8*** | 14.8 |
| Female | 54.0*** | 44.9 | 58.7*** | 44.7 | 56.5*** | 47.3 | 58.8*** | 46.8 |
| Married | 67.0*** | 58.5 | 60.8*** | 54.2 | 64.5*** | 58.4 | 61.1*** | 53.9 |
| Married female | 34.3*** | 24.0 | 33.8*** | 22.3 | 33.8*** | 25.2 | 34.1*** | 23.2 |
| Female × age | ||||||||
| 18–25 years | 3.4*** | 6.2 | 3.3*** | 5.0 | 3.6*** | 6.6 | 3.2*** | 5.2 |
| 26–35 years | 11.4*** | 12.5 | 12.4*** | 11.5 | 12.2*** | 13.1 | 12.3** | 11.9 |
| 36–45 years | 15.7*** | 13.0 | 14.6*** | 10.5 | 17.3*** | 13.8 | 14.6*** | 11.1 |
| 46–55 years | 17.3*** | 9.6 | 16.9*** | 11.0 | 17.6*** | 10.1 | 17.0*** | 11.6 |
| 56 years or older | 6.2*** | 3.6 | 11.5*** | 6.7 | 5.8*** | 3.7 | 11.7*** | 7.1 |
| Educational attainment | ||||||||
| Less than high school | 5.4*** | 11.7 | 2.1*** | 7.8 | 3.7*** | 11.0 | 2.1*** | 7.1 |
| High school | 19.4*** | 27.7 | 13.8*** | 25.2 | 16.5*** | 27.4 | 14.1*** | 24.3 |
| Some college | 21.9*** | 24.7 | 16.3*** | 22.4 | 19.0*** | 25.0 | 15.9*** | 22.6 |
| Associate's degree | 7.5*** | 8.0 | 8.2*** | 9.8 | 7.1*** | 8.3 | 8.1*** | 10.3 |
| Bachelor's degree | 25.4*** | 19.6 | 29.1*** | 23.1 | 27.3*** | 20.5 | 29.0*** | 23.9 |
| Graduate degree | 20.4*** | 8.3 | 30.5*** | 11.7 | 26.5*** | 7.9 | 30.9*** | 11.9 |
| **p < 0.01, ***p < 0.001 Note: Estimates are weighted by the number of enrollees in the plan. Significant differences between local and private plans are indicated on the local government estimate. Significant differences between state and large-firm private plans are indicated on the state government estimate. Source: Estimates calculated from the 2000 Decennial Census and the 2014 American Community Survey and merged back onto the 2000 and 2014 Medical Expenditure Panel Survey-Insurance Component. | ||||||||
Differences in plan characteristics were not a significant factor in explaining differences between private sector premiums and either state or local government premiums in 2000. Premium differences in that year were not large, and neither were differences in plan characteristics. (See table 1.) For example, a similar percentage of public and private enrollees had plans with deductibles in 2000. However, among these enrollees, the mean deductible for private enrollees was significantly larger than the corresponding mean for public enrollees.
By 2014, differences in benefits had widened. Holding other factors constant, combined differences in plan type, out-of-pocket cost-sharing arrangements, and covered services led premiums for local government enrollees to be $174 higher than those for private enrollees ($206 in the model comparing state government enrollees and large-firm private enrollees).26 In the local–private model, differences in deductibles alone contributed $135 toward this $174 total, reflecting the $524 gap (see table 1) in unconditional deductibles between local government and private sector enrollees. Similarly, the $537 difference in unconditional deductibles between state government and large-firm private enrollees in 2014 contributed $169 toward the premium differences in that year.
In addition, differences in hospital coinsurance rates for state government and private enrollees accounted for $137 of the state–private premium difference in 2014 and $32 of the local–private premium gap. The 2014 decompositions also show that differences in out-of-pocket maximums contributed $32 toward the local–private premium gap and $10 toward the state–private premium gap (p < 0.10 for the latter estimate). In contrast, differences in plan type and dental coverage (which is offered more often in the private than in the public sector) pulled premiums in the opposite direction, contributing toward private premiums being higher than public sector premiums.
Unionization is an important factor in explaining public–private differences in premiums. In 2014, differences in unionization rates contributed $336 toward the gap between local and private premiums and $181 of the gap between state and large-firm private premiums. To understand whether these contributions resulted from differences in unobserved worker characteristics or in unobserved benefit generosity negotiated by unions, we reran our models by excluding unionization. Omitting unionization greatly reduced the explained portion of the decomposition models (a reduction of $300 in the 2014
The demographic characteristics of potential enrollees in a health insurance plan help determine the risk and cost—and, therefore, the premiums—associated with insuring these individuals. As shown in table 4, there were significant differences in the demographic characteristics of public and private sector employees in both 2000 and 2014. As other studies have shown, public sector workers are more likely to be female, older, and married than private sector workers. Differences in these three measures accounted for $304 of the 2014 premium difference between local and all private enrollees and $280 of the difference between state and large-firm private enrollees.27 Public sector workers also had higher levels of educational attainment than private sector workers, and this difference contributed $112 and $162 toward the local–private premium gap in 2000 and 2014, respectively. While differences in educational attainment contributed $248 toward the gap between state and large-firm private premiums in 2000, they did not contribute to the large premium gap in 2014.
Employer offers of retiree health insurance were far more common in the public than in the private sector in both 2000 and 2014, with 40 to 50 percentage-point differences in the rates at which enrollees worked for employers offering this benefit. In 2014, differences in the offer rates of retiree health insurance accounted for $70 of the local–private premium gap and $98 of the gap between state and large-firm private premiums.28 As noted earlier, these differences may reflect the possibility that the premiums for some public sector plans were higher than those in the private sector, since public plans are more likely to cover more expensive retired employees. Finally, in 2014, differences in firm size between local government and private sector employers, along with the different distribution of employers across states, contributed toward private premiums being higher than public premiums. The fact that government enrollees were more likely to be employed at larger employers than private sector enrollees (see table 3) lowered government premiums relative to private premiums.
In this article, we used data from the 2000 and 2014 MEPS-IC to compare health insurance premiums for public and private sector enrollees. We used Oaxaca–Blinder decomposition methods to examine the contribution of plan, worker, and employer characteristics toward explaining the public sector’s higher premiums. While there was little difference in premiums in the two sectors in 2000, we found that a more educated workforce and a higher rate of unionization in the public sector contributed toward local government enrollees’ higher premiums in that year. By 2014, the gaps between public and private sector premiums had grown larger, with public sector premiums exceeding private sector premiums by 14 to 19 percent. We found that differences in plan characteristics played a substantial role in explaining these differences in 2014, but that these characteristics were not the only, or even the most important, factor. Differences in plan characteristics accounted for $174 of the $1,106 gap between local and private premiums in 2014 and $206 of the $826 gap between state premiums and large-firm private premiums in that year. In comparison, the combined contributions of differences in the age, marital status, and educational attainment of workers and in the share of workers who were female explained $466 of the $1,106 premium gap between local government and all private enrollees in 2014. Similarly, these combined contributions accounted for $359 of the $826 premium gap between state government and large-firm private enrollees.
Unionization also contributed more toward explaining public–private premium gaps than did plan characteristics in 2014 ($336 of the gap between local and private premiums and $181 of the gap between state and large-firm private premiums). Given the results of our sensitivity analyses, this measure likely reflects variations in worker, rather than plan, characteristics.
To the best of our knowledge, our study is the first to decompose differences in public and private premiums with the aim of identifying specific factors that contribute to higher public sector premiums. While we found that the design features of plans offered by state and local governments contributed to the public sector’s higher premiums in 2014, our decomposition analysis revealed that worker and employer characteristics also played a large role—in some comparisons, even larger than that of plan characteristics. We believe that our results on the relative contribution of plan generosity and workforce characteristics can inform the broader debate on the relative compensation of public and private sector workers.
| Coefficients | Explained portion | |
|---|---|---|
| 2000 | 2014 | |
| Local government units–all private firms | ||
| Plan characteristics | ||
| 2000 | $12 | $51 |
| 2014 | 26 | 174 |
| Age, marital status, female | ||
| 2000 | 57 | 136 |
| 2014 | 123 | 304 |
| State government units–large private firms | ||
| Plan characteristics | ||
| 2000 | -24 | 172 |
| 2014 | -143 | 206 |
| Age, marital status, female | ||
| 2000 | -212 | -10 |
| 2014 | 166 | 280 |
| Source: Authors' calculations using the 2000 and 2014 Medical Expenditure Panel Survey-Insurance Component with merged data from the 2000 Decennial Census and the 2014 American Community Survey. | ||
Disclaimer: Any opinions and conclusions expressed here are those of the authors and do not necessarily represent the views of the U.S. Census Bureau, the Agency for Healthcare Research and Quality, or the University of Michigan. All results have been reviewed to ensure that no confidential information has been disclosed.
Alice M. Zawacki, Jessica P. Vistnes, and Thomas C. Buchmueller, "Why are employer-sponsored health insurance premiums higher in the public sector than in the private sector?," Monthly Labor Review, U.S. Bureau of Labor Statistics, September 2018, https://doi.org/10.21916/mlr.2018.22
1 “Underfunded pensions: tackling an ‘invisible’ crisis,” Knowledge@Wharton, January 26, 2015, http://knowledge.wharton.upenn.edu/article/underfunded-pensions-tackling-an-invisible-crisis/; and “Employer costs for employee compensation historical listing: National Compensation Survey, March 2004–March 2017” (U.S. Bureau of Labor Statistics), https://www.bls.gov/ncs/ect/sp/ececqrtn.pdf.
2 Jeffrey Clemens and David M. Cutler, “Who pays for public employee health costs?” Journal of Health Economics, vol. 38, 2014, pp. 65–76; Paige Qin and Michael Chernew, “Compensating wage differentials and the impact of health insurance in the public sector on wages and hours,” Journal of Health Economics, vol. 38, 2014, pp. 77–87; and Darren Lubotsky and Craig A. Olson, “Premium copayments and the trade-off between wages and employer-provided health insurance,” Journal of Health Economics, vol. 44, 2015, pp. 63–79.
3 Janet Currie and Brigitte C. Madrian, “Health, health insurance and the labor market,” in Orley Ashenfelter and David Card, eds., Handbook of labor economics, vol. 3 (Elsevier Science B.V., 1999).
4 Joseph Gyourko and Joseph Tracy, “An analysis of public- and private-sector wages allowing for endogenous choices of both government and union status,” Journal of Labor Economics, vol. 6, no. 2, April 1988, pp. 229–253; Bradley R. Braden and Stephanie L. Hyland, “Cost of employee compensation in public and private sectors,” Monthly Labor Review, May 1993, https://www.bls.gov/opub/mlr/1993/05/art2full.pdf; Dale Belman and John S. Heywood, “Public-sector wage comparability: the role of earnings dispersion,” Public Finance Review, vol. 32, no. 6, November 2004, pp. 567–587; Josefa Ramoni-Perazzi and Don Bellante, “Do truly comparable public and private sector workers show any compensation differential?” Journal of Labor Research, vol. 28, no. 1, 2007, pp. 117–133; Ken McDonnell, “Benefit cost comparisons between state and local governments and private-sector employers,” EBRI Notes, vol. 29, no. 6, June 2008, pp. 2–6; Jeffrey Keefe, “Debunking the myth of the overcompensated public employee: the evidence,” EPI Briefing Paper 276 (Economic Policy Institute, September 15, 2010); Keith A. Bender and John S. Heywood, “Out of balance? Comparing public and private sector compensation over 20 years” (Center for State and Local Government Excellence and National Institute for Retirement Security, April 2010); Alicia H. Munnell, Jean-Pierre Aubry, Josh Hurwitz, and Laura Quinby, “Comparing compensation: state-local versus private sector workers,” State and Local Pension Plans, no. 20 (Center for Retirement Research at Boston College, September 2011); and Maury Gittleman and Brooks Pierce, “Compensation for state and local government workers,” Journal of Economic Perspectives, vol. 26, no 1, 2012, pp. 217–242.
5 “Employer Costs for Employee Compensation historical listing: National Compensation Survey, March
6 Christopher G. Reddick, “Comparing public and private choices of managed health care plans: rhetoric versus reality,” Public Personnel Management, vol. 36, no. 3, 2007, pp. 223–245.
7 Employer health benefits 2014 annual survey (Kaiser Family Foundation and Health Research and Educational Trust, 2014).
8 Karen Davis, “Premiums and employee contributions for employer-sponsored health insurance: private versus public sector, 2014,” Statistical Brief 486 (Agency for Healthcare Research and Quality, March 2016).
9 Reddick, “Comparing public and private choices of managed health care plans.”
10 Carolyn Watts, Jon B. Christianson, Lance Heineccius, and Sally Trude, “The role of public employers in a changing health care market,” Health Affairs, vol. 22, no. 1, 2003, pp. 173–180; Sally Trude, Jon B. Christianson, Cara S. Lesser, Carolyn Watts, and Andrea M. Benoit, “Employer-sponsored health insurance: pressing problems, incremental changes,” Health Affairs, vol. 21, no. 1, 2002, pp. 66–75; and Robert E. Hurley, Laurie Felland, Anneliese Gerland, and Jeremy Pickreign, “Public employees’ health benefits survive major threats, so far,” Health Affairs (web exclusives), April 18, 2006, pp. w195–w203.
11 Watts et al., “The role of public employers in a changing health care market”; and Trude et al., “Employer-sponsored health insurance.”
12 For more information on the MEPS-IC, see https://meps.ahrq.gov/mepsweb/survey_comp/Insurance.jsp.
13 See “2014 Annual Survey of Public Employment and Payroll” (U.S. Census Bureau), https://www.census.gov/data/datasets/2014/econ/apes/annual-apes.html; and “2014 County Business Patterns” (U.S. Census Bureau), https://www.census.gov/programs-surveys/cbp/data/tables.2014.html.
14 Government units are defined as organized entities with governmental character and with managerial discretion in their own affairs that is distinct from that of any other governmental unit’s administrative structure. This definition can apply to universities and community colleges, as well as to state and other branches of government. States or local parent governments determine the level of entities that are considered governments. These determinations can vary by state, leaving some states without any dependent governments (i.e., entities, such as libraries or school boards, associated with a parental governmental agency) that report as separate units. For example, some states define all their universities as one government entity, whereas other states define each separate university as a separate government entity; see State and local government statistics at a crossroads (National Research Council, 2007), https://www.nap.edu/catalog/12000/state-and-local-government-statistics-at-a-crossroads.
15 These models include the following indicators for firm or government unit size: fewer than 10 employees (the omitted category), 10–24 employees, 25–99 employees, 100–499 employees, 500–999 employees, and 1,000 or more employees.
16 Gail A. Jensen and Jon R. Gabel, “The erosion of purchased health insurance,” Inquiry, vol. 25, no. 3, 1988, pp. 328–343; Gail A. Jensen and Michael A. Morrisey, “Group health insurance: a hedonic price approach,” The Review of Economics and Statistics, vol. 72, no. 1, February 1990, pp. 38–44; and Jon Gabel, Gary Claxton, Erin Holve, Jeremy Pickreign, Heidi Whitmore, Kelley Dhont, Samantha Hawkins, and Diane Rowland, “Health benefits in 2003: premiums reach thirteen-year high as employers adopt new forms of cost sharing,” Health Affairs, vol. 22, no. 5, September/October 2003, pp. 117–126.
17 Union membership (annual) news release, USDL-18-0080 (U.S. Department of Labor, January 19, 2018), https://www.bls.gov/news.release/union2.htm.
18 Thomas B. Buchmueller, John DiNardo, and Robert G. Valletta, “Union effects on health insurance provision and coverage in the United States,” Industrial and Labor Relations Review, vol. 55, no. 4, July 2002, pp. 610–627; Thomas B. Buchmueller, John DiNardo, and Robert G. Valletta, “A submerging labor market institution? Unions and the nonwage aspects of work,” in Richard B. Freeman, Joni Hersch, and Lawrence Mishel, eds., Emerging labor market institutions for the twenty-first century (National Bureau of Economic Research, 2004), http://www.nber.org/books/free04-1; and “National Compensation Survey: employee benefits in state and local governments in the United States, September 2007” (U.S. Bureau of Labor Statistics, 2008).
19 Trude et al., “Employer-sponsored health insurance”; Watts et al., “The role of public employers in a changing health care market”; and Hurley et al., “Public employees’ health benefits survive major threats, so far.”
20 In response to rising costs, some states are expanding their health-plan risk pools to include employees from local governments. The National Council of State Legislatures has reported that state-employee health plans often combine their enrollee pool with that of other government-employee participants (see http://www.ncsl.org/research/health/health-insurance-premiums.aspx). For example, 21 states expanded their pools with participants from cities, towns, and counties; 16 states with participants from colleges and universities; and 19 states with participants from public schools. The MEPS-IC enrollment data for the public sector do not capture this detail, but our models control for state fixed effects.
We were unable to find data showing whether public or private employers were more likely to pool retirees with active employees. Some state governments have included retirees in the active-employee risk pool in order to reduce liabilities they must report for the expected costs of health benefits promised to current and future retirees under Government Accounting Standard Statement 45; see Katie Meyer, Colleen Schlecht, and Betta Sherman, “Challenges and current practices in state employee healthcare,” NASPE white paper (Chicago, IL: University of Chicago, 2010), https://knowledgecenter.csg.org/kc/system/files/NASPE_Healthcare_Whitepaper_0.pdf. In addition, some employers have created separate retiree-only plans for exemption from certain costly requirements of the Affordable Care Act; see Frank McArdle, Tricia Neuman, and Jennifer Huang, “Retiree health benefits at the crossroads” (Kaiser Family Foundation, 2014), https://www.kff.org/medicare/report/retiree-health-benefits-at-the-crossroads/.
21 In some cases, the premium rate for retirees is 1–5 percent higher than that for active employees; see “State employee health plan spending: an examination of premiums, cost drivers, and policy approaches” (Pew Charitable Trusts and the John D. and Catherine T. MacArthur Foundation, August 2014), http://www.pewtrusts.org/en/research-and-analysis/reports/2014/08/state-employee-health-plan-spending.
22 See Hurley et al., “Public employees’ health benefits survive major threats, so far”; and “New data series highlights employee access to medical care and retirement benefits,” Program Perspectives, vol. 2, no. 4 (U.S. Bureau of Labor Statistics, July 2010), https://www.bls.gov/opub/perspectives/program_perspectives_vol2_issue4.pdf. The MEPS-IC does not collect data on the occupational mix of the employer’s workforce.
23 Employee tenure in 2010, USDL-10-1278 (U.S. Department of Labor, September 14, 2010), https://www.bls.gov/news.release/archives/tenure_09142010.pdf; Ramoni-Perazzi and Bellante, “Do truly comparable public and private sector workers show any compensation differential?”; Bender and Heywood, “Out of balance?”; and Gerald Mayer, “Selected characteristics of private and public sector workers,” CRS Report R41897 (Congressional Research Service, March 21, 2014), https://fas.org/sgp/crs/misc/R41897.pdf.
24 For each year, we merge these measures with MEPS-IC establishments by state and four-digit ACS industry code and by state and two-digit North American Industry Classification System (NAICS) industry level. For the produced statistic to be considered reliable enough for merging, we require cells in the ACS to have at least 100 observations. If cells by state and four-digit ACS industry code do not meet this requirement, we use the mean by state and two-digit NAICS level. If this procedure still fails to yield at least 100 observations for the cell, we use state-level means.
25 We performed a sensitivity analysis using an alternative method of clustering standard errors, clustering these errors by state and two-digit NAICS industry level and treating state government and local government units as separate industries. While this method’s standard errors for the explained portion of the decomposition model were generally larger than the standard errors from our models adjusted for the survey design of the MEPS-IC, the statistical significance of our results was largely unchanged. The only differences were observed in the models comparing local government and private sector premiums in 2000 and the models comparing state government and large-firm private premiums in 2014. In these models, the contributions to the explained portion of the difference derived from differences in the percentage of plans that were self-insured were no longer significant, and the contributions from the state fixed effects for both models in 2014 were also no longer significant.
26 Appendix table A-1 provides information to assist readers in identifying how much of the increases in the contribution of plan characteristics and other factors between 2000 and 2014 were due to changes in coefficients over time. For example, in the local–private Oaxaca model, plan characteristics contributed $12 toward explaining premium differences in 2000 but $174 in 2014. Alternatively, if we use the coefficients from the 2000 model to evaluate the effect of differences in plan characteristics in 2014, we find that plan characteristics contributed $51 toward premium differences. The difference between the original estimate of $174 and this alternative estimate of $51 is due to changes in the coefficients between the 2014 and 2000 models.
27 To assess any potential biases from using imputed state-industry measures versus establishment-level measures reported by respondents (“collected” measures), we performed sensitivity tests by running a set of premium regressions for private sector establishments in 2000 and 2014. For these tests, we chose private sector establishments because they had adequate item response rates on variables measuring the percentage of the workforce that is female and the percentage that is age 50 or older. We found that any potential biases from using imputed versus collected data on workers at different levels of aggregation are difficult to generalize. This is because the “collected” coefficients on the variable measuring the percentage of female workers were smaller than the “imputed” coefficients in the 2014 model, but the “collected” coefficients on the variable measuring the percentage of workers age 50 or older were bigger than the “imputed” coefficients in both the 2000 and 2014 models. The use of imputed versus collected variables did not affect other coefficients in the models.
28 Note that the results were similar when we excluded retiree health insurance from our models.