
An official website of the United States government
An official website of the United States government
The .gov means it's official.
Federal government websites often end in .gov or .mil. Before sharing sensitive information,
make sure you're on a federal government site.
The site is secure.
The
https:// ensures that you are connecting to the official website and that any
information you provide is encrypted and transmitted securely.
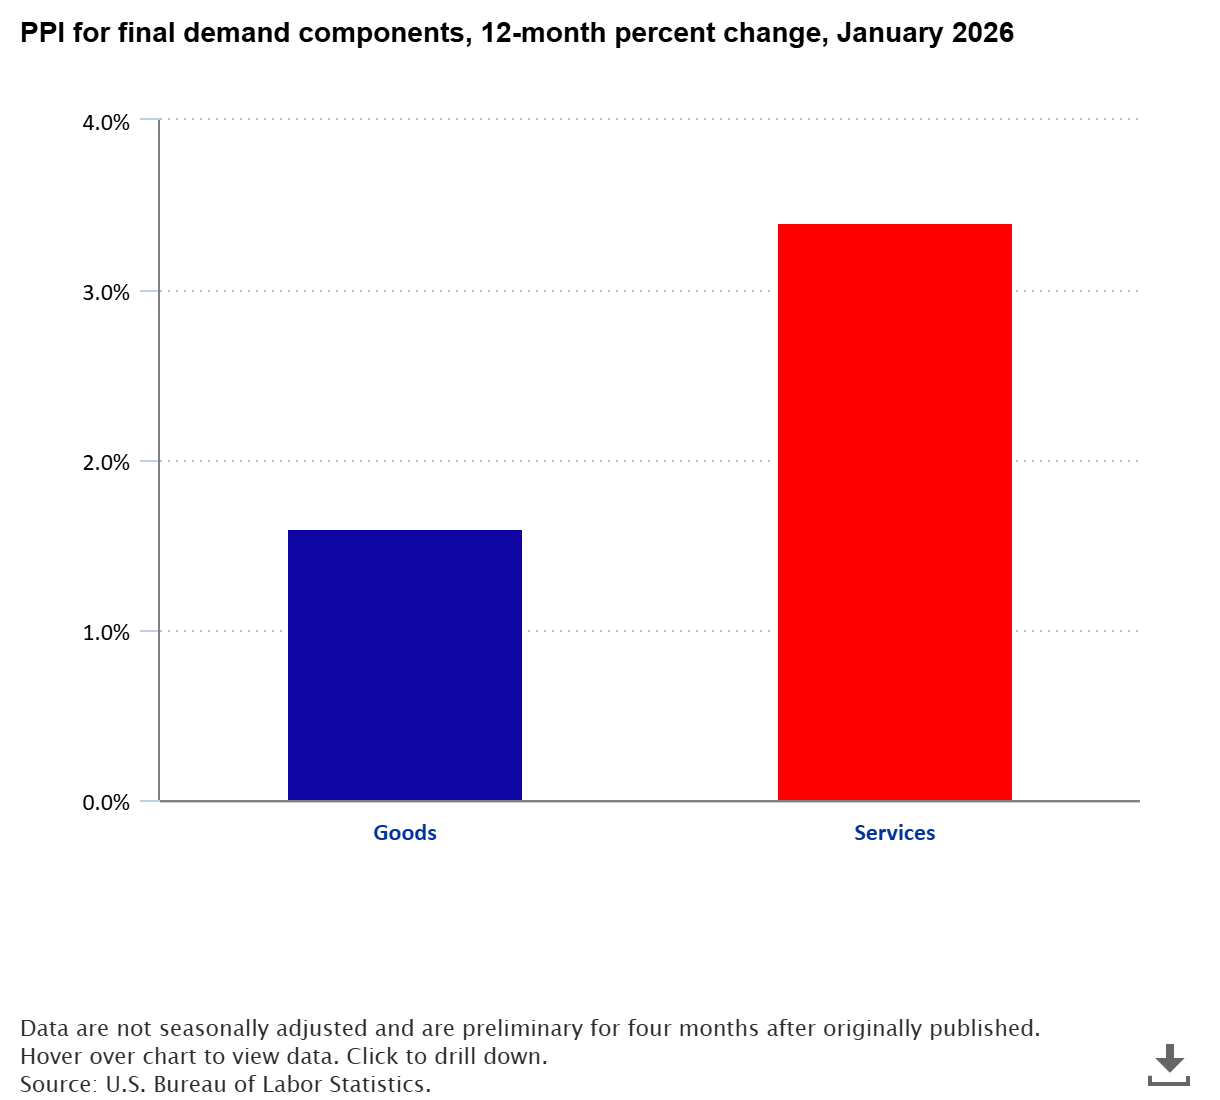
Producer prices increased 2.9 percent from January 2025 to January 2026
read full article »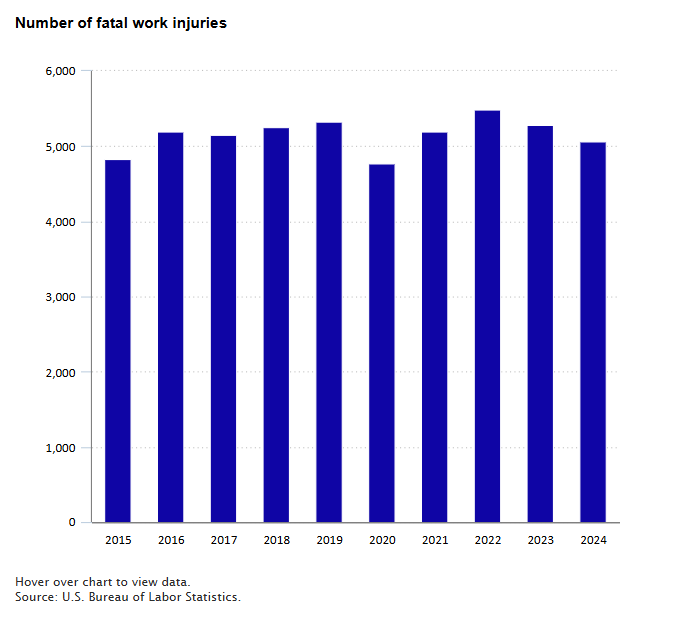
There were 5,070 fatal work injuries recorded in the United States in 2024, down 4.0 percent from 5,283 in 2023. A worker died every 104 minutes from a work-related injury in 2024 compared to 99 minutes in 2023.
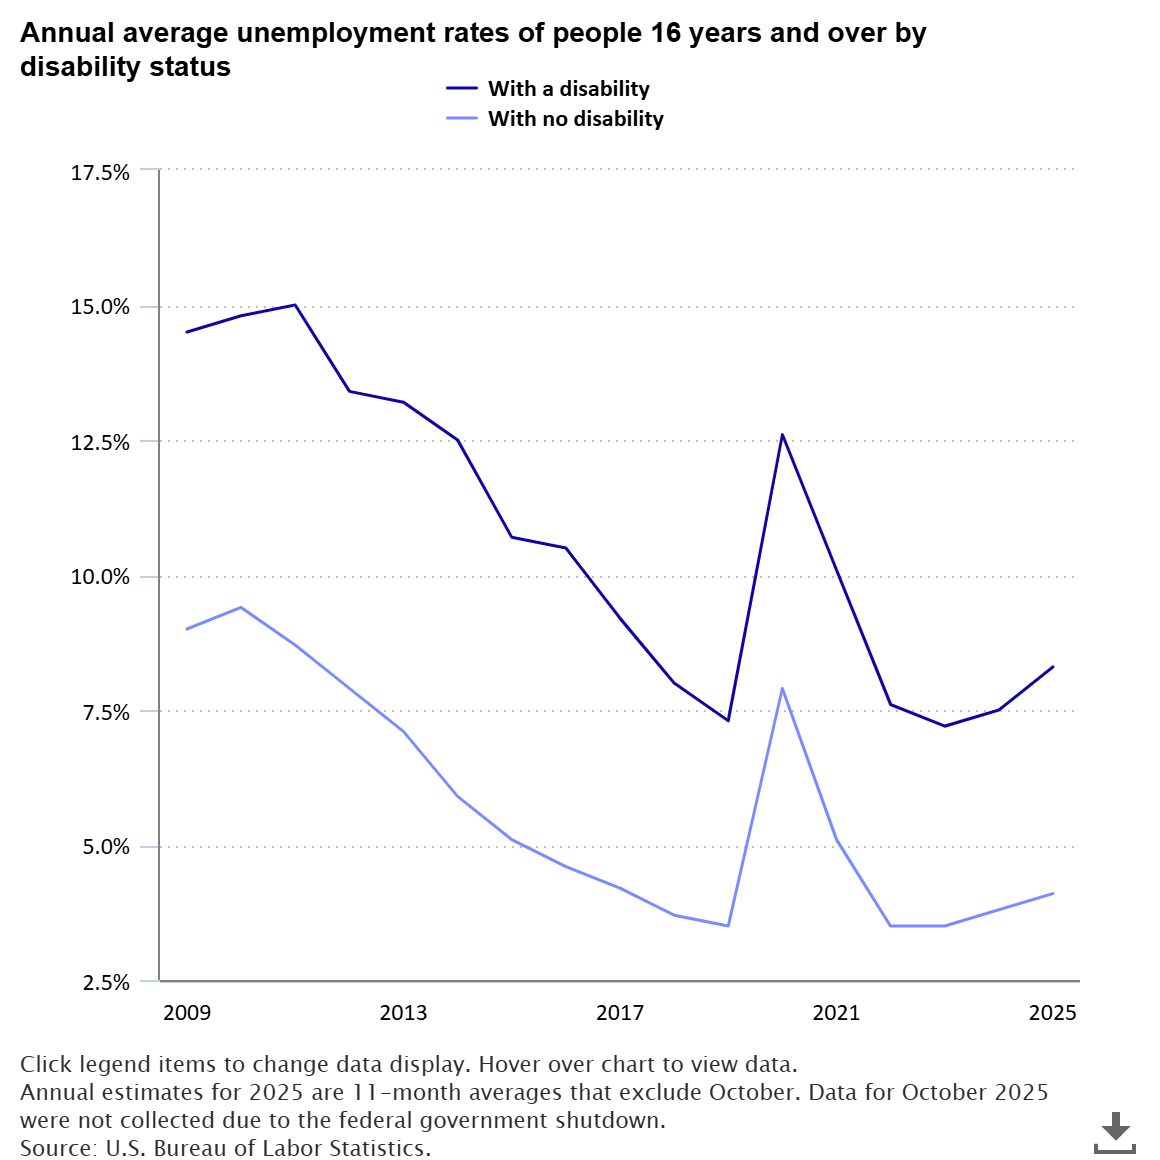
In 2025, the unemployment rate for people with a disability rose to 8.3 percent—about double the 4.1-percent rate for those without a disability. Over the year, the rate increased by 0.8 percentage point for people with a disability, compared with a 0.3-percentage point increase for those without a disability.
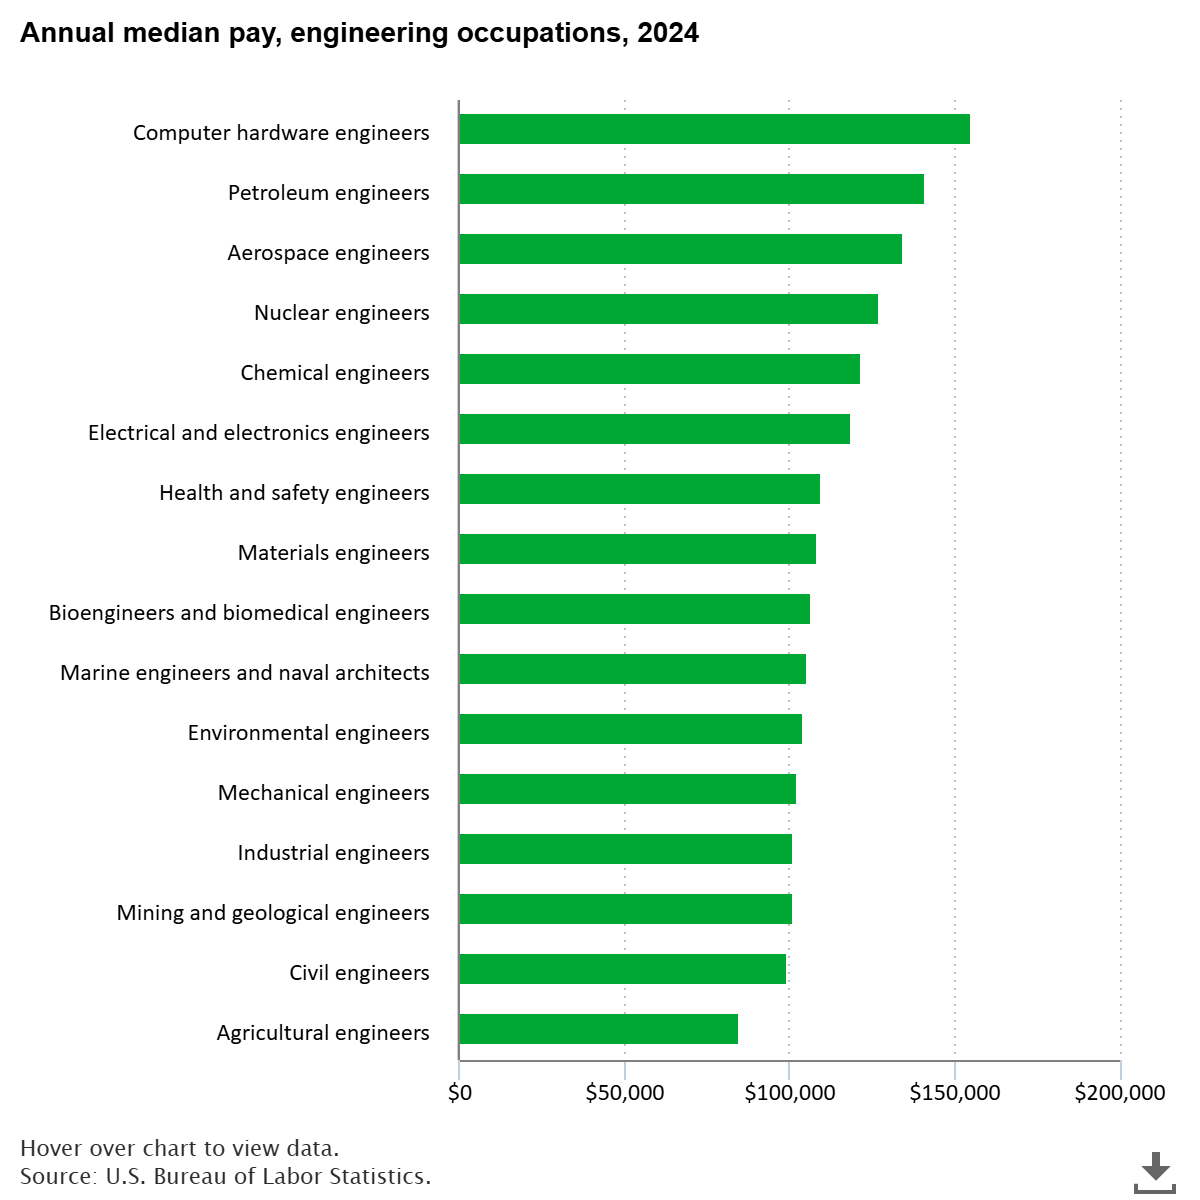
Engineers work in a diverse range of fields, such as agriculture, energy, transportation, biotechnology, computing, and manufacturing. But no matter their field, all engineers apply scientific principles to construct, power, and repair our world.
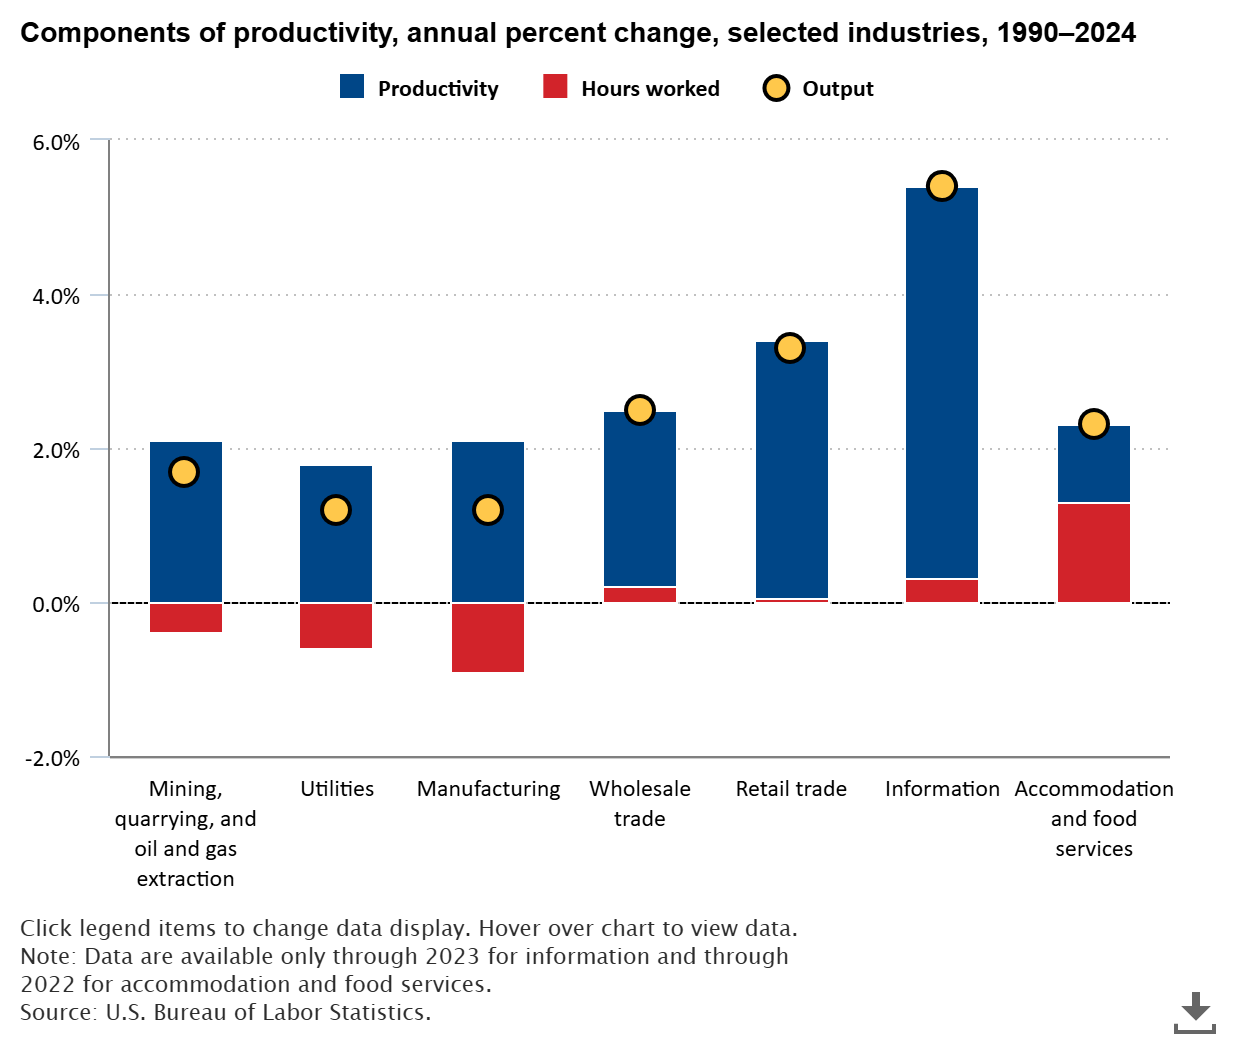
While growth in annual hours worked has slowed since 2000, many industries have sustained high rates of output growth through gains in productivity, which is the ratio of output per hour of work. Developments in technology and business practices are common in industries with high productivity growth. Less often, some industries have increased output by accelerating or maintaining growth in hours worked. Thus, patterns of output growth can be described as "productivity-driven," "hours-driven," and "balanced growth."
OF INTEREST
