An official website of the United States government
 United States Department of Labor
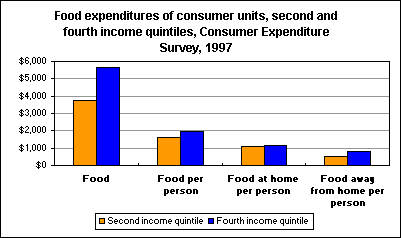
Food expenditures by consumer units vary by income group, in part because average family size also varies by income level.

[Chart data—TXT]
For example, the chart compares the food expenditures of consumer units in the second income quintile (that is, the next-to-lowest 20 percent) and in the fourth income quintile (the next-to-highest 20 percent). On average, consumer units in the second quintile spent $3,729 on food in 1997, while those in the fourth quintile spent $5,680, or 52 percent more.
However, the average number of persons in second-quintile consumer units was 2.3 while in the fourth quintile the average was 2.9. Therefore, there was a smaller difference between the quintiles in food expenditures per person. The average expenditure on food per person was $1,621 in the second quintile and $1,959 in the fourth, for a 21-percent difference.
Per person expenditures for food at home were quite similar for the two groups—$1,120 in the second and $1,144 in the fourth quintile. There was a substantial difference in expenditures per person for food away from home. In the second quintile, the figure was $501 while in the fourth quintile the corresponding number was 62 percent higher, at $814.
These data are a product of the BLS Consumer Expenditure Survey program. Additional information is available from "Consumer Expenditure Survey: Quarterly Data from the Interview Survey, Fourth Quarter 1997: Using Consumer Unit Characteristics to Compare Expenditures," BLS Report 933.
Bureau of Labor Statistics, U.S. Department of Labor, The Economics Daily, Comparing food expenditures by income group at https://www.bls.gov/opub/ted/1999/aug/wk4/art03.htm (visited May 09, 2025).

