
An official website of the United States government
An official website of the United States government
The .gov means it's official.
Federal government websites often end in .gov or .mil. Before sharing sensitive information,
make sure you're on a federal government site.
The site is secure.
The
https:// ensures that you are connecting to the official website and that any
information you provide is encrypted and transmitted securely.
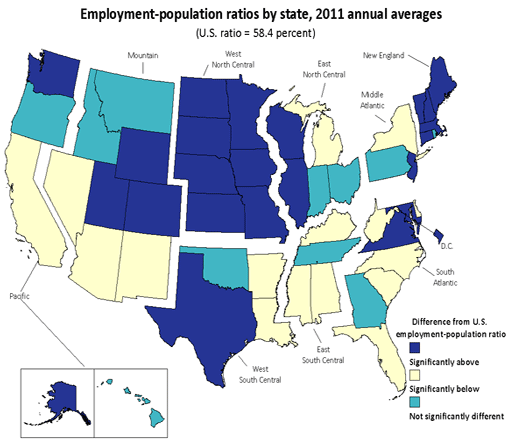
Twenty-three states and the District of Columbia recorded employment-population ratios that were significantly above the U.S. ratio of 58.4 percent in 2011, and 16 states had ratios that were appreciably below it. The remaining 11 states had ratios that were not measurably different from that of the nation.
| State | Employment-population ratio (percent) | Difference from U.S. ratio |
|---|---|---|
Alabama | 53.4 | Significantly below |
Alaska | 64.2 | Significantly above |
Arizona | 55.8 | Significantly below |
Arkansas | 55.9 | Significantly below |
California | 56.0 | Significantly below |
Colorado | 63.7 | Significantly above |
Connecticut | 62.0 | Significantly above |
Delaware | 57.3 | Significantly below |
District of Columbia | 60.1 | Significantly above |
Florida | 54.4 | Significantly below |
Georgia | 57.8 | Not significantly different |
Hawaii | 58.6 | Not significantly different |
Idaho | 59.6 | Not significantly different |
Illinois | 59.5 | Significantly above |
Indiana | 58.0 | Not significantly different |
Iowa | 65.9 | Significantly above |
Kansas | 64.8 | Significantly above |
Kentucky | 55.5 | Significantly below |
Louisiana | 54.9 | Significantly below |
Maine | 60.3 | Significantly above |
Maryland | 62.8 | Significantly above |
Massachusetts | 60.7 | Significantly above |
Michigan | 53.9 | Significantly below |
Minnesota | 67.1 | Significantly above |
Mississippi | 53.5 | Significantly below |
Missouri | 59.9 | Significantly above |
Montana | 59.8 | Not significantly different |
Nebraska | 68.5 | Significantly above |
Nevada | 57.2 | Significantly below |
New Hampshire | 65.9 | Significantly above |
New Jersey | 59.8 | Significantly above |
New Mexico | 54.3 | Significantly below |
New York | 56.5 | Significantly below |
North Carolina | 56.2 | Significantly below |
North Dakota | 69.3 | Significantly above |
Ohio | 59.0 | Not significantly different |
Oklahoma | 57.9 | Not significantly different |
Oregon | 58.8 | Not significantly different |
Pennsylvania | 58.1 | Not significantly different |
Rhode Island | 59.3 | Not significantly different |
South Carolina | 53.5 | Significantly below |
South Dakota | 68.1 | Significantly above |
Tennessee | 57.2 | Not significantly different |
Texas | 60.4 | Significantly above |
Utah | 62.5 | Significantly above |
Vermont | 66.4 | Significantly above |
Virginia | 64.7 | Significantly above |
Washington | 59.6 | Significantly above |
West Virginia | 49.5 | Significantly below |
Wisconsin | 63.5 | Significantly above |
Wyoming | 65.4 | Significantly above |
These data are featured in the TED article, State employment-population ratios in 2011.
West Virginia again reported the lowest employment-population ratio among the states, 49.5 percent. West Virginia has had the lowest employment-population ratio each year since the series began in 1976.
Five states registered the lowest employment-population ratios in their series in 2011: California, 56.0 percent; Hawaii, 58.6 percent; Nevada, 57.2 percent; New Mexico, 54.3 percent; and North Carolina, 56.2 percent.
In 2011, Utah registered the largest statistically significant employment-population ratio decline among the states (−1.0 percentage point). The next largest occurred in Arizona (−0.9 percentage point), Nevada and New Mexico (−0.8 percentage point each) and New York (−0.5 point). The District of Columbia also reported a measurable decline (−1.3 percentage points). Virginia posted the only significant ratio increase among states (+0.2 percentage point). The remaining 44 states had employment-population ratios that were not significantly different from those of a year earlier.
These employment data are from the Local Area Unemployment Statistics program. The employment-population ratio is the proportion of the civilian noninstitutional population 16 years of age and over that is employed. For more information, see "Regional and State Unemployment — 2011 Annual Averages" (HTML) (PDF), news release USDL-12-0371.
Bureau of Labor Statistics, U.S. Department of Labor, The Economics Daily, State employment-population ratios in 2011 at https://www.bls.gov/opub/ted/2012/ted_20120301.htm (visited July 22, 2026).
