An official website of the United States government
An official website of the United States government
The .gov means it's official.
Federal government websites often end in .gov or .mil. Before sharing sensitive information,
make sure you're on a federal government site.
The site is secure.
The
https:// ensures that you are connecting to the official website and that any
information you provide is encrypted and transmitted securely.
In 2011, there were 24.4 million foreign-born persons in the U.S. labor force, comprising 15.9 percent of the total. The unemployment rate for the foreign born was 9.1 percent in 2011 (down from 9.8 percent in 2010). The jobless rate of the native born was 8.9 percent in 2011 (compared with 9.6 percent in the prior year).
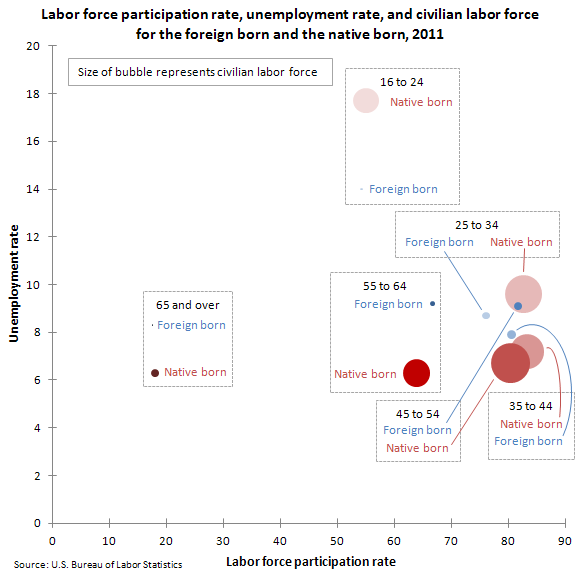
Overall, the unemployment rates of the foreign born in younger age groups (16 to 34 years) tend to be lower than the jobless rates for the native born. In 2011, the unemployment rate of foreign-born persons 16 to 24 years was 14.0 percent, while for their native-born counterparts the rate was 17.7 percent. Among persons 25 to 34 years of age, the unemployment rate of the foreign born was 8.7 percent, while for the native born it was 9.6 percent.
Among older workers (ages 35 and up), unemployment rates of the foreign born tend to be higher than for the native born. The unemployment rate of older foreign-born workers ranged from 7.9 percent for 35- to 44-year-olds to 9.2 percent for 55- to 64-year-olds. In contrast, the rate for older native-born workers ranged from 6.3 percent for those 55 years and over to 7.2 percent for those 35 to 44 years.
In 2011, the labor force participation rate of the foreign born was 67.0 percent. The labor force participation rate of the native born was 63.6 percent. Both the foreign-born and native-born labor force participation rates were over 80 percent in the 35 to 44 and 45 to 54 age brackets. The proportion of the foreign-born labor force made up of 25- to 54-year-olds was higher than for their native-born counterparts. Labor force participation is typically highest among persons in that age bracket.
These data are from the Current Population Survey. For more information, see "Foreign-Born Workers: Labor Force Characteristics – 2011," news release USDL-12-1019 (HTML) (PDF). The foreign born are persons who reside in the United States but who were born outside the country or one of its outlying areas to parents who were not U.S. citizens. The foreign born include legally admitted immigrants, refugees, temporary residents such as students and temporary workers, and undocumented immigrants.
Bureau of Labor Statistics, U.S. Department of Labor, The Economics Daily, Employment status of the foreign born and native born by age, 2011 at https://www.bls.gov/opub/ted/2012/ted_20120529.htm (visited July 29, 2026).