
An official website of the United States government
An official website of the United States government
The .gov means it's official.
Federal government websites often end in .gov or .mil. Before sharing sensitive information,
make sure you're on a federal government site.
The site is secure.
The
https:// ensures that you are connecting to the official website and that any
information you provide is encrypted and transmitted securely.
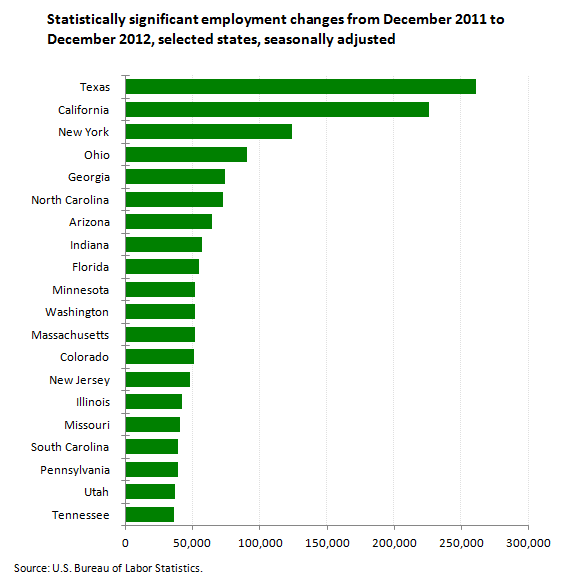
Over the year, 30 states experienced statistically significant changes in employment. The largest over-the-year jobs increase occurred in Texas, where employment increased from 10,643,200 to 10,904,000 from December 2011 to December 2012 (a change of +260,800), followed by California (+225,900) and New York (+123,600). Only West Virginia’s employment decreased (-13,900).
| State | Employment | Over-the-year change(p) | |
|---|---|---|---|
| Dec 2011 | Dec 2012(p) | ||
Texas | 10,643,200 | 10,904,000 | 260,800 |
California | 14,172,900 | 14,398,800 | 225,900 |
New York | 8,717,000 | 8,840,600 | 123,600 |
Ohio | 5,094,300 | 5,185,000 | 90,700 |
Georgia | 3,897,000 | 3,971,100 | 74,100 |
North Carolina | 3,932,200 | 4,004,600 | 72,400 |
Arizona | 2,415,000 | 2,479,300 | 64,300 |
Indiana | 2,849,600 | 2,906,800 | 57,200 |
Florida | 7,333,200 | 7,388,100 | 54,900 |
Minnesota | 2,683,300 | 2,735,200 | 51,900 |
Washington | 2,834,000 | 2,885,700 | 51,700 |
Massachusetts | 3,211,800 | 3,263,400 | 51,600 |
Colorado | 2,265,300 | 2,316,600 | 51,300 |
New Jersey | 3,874,600 | 3,922,600 | 48,000 |
Illinois | 5,676,000 | 5,717,900 | 41,900 |
Missouri | 2,632,500 | 2,672,700 | 40,200 |
Pennsylvania | 5,712,800 | 5,751,500 | 38,700 |
South Carolina | 1,840,400 | 1,879,100 | 38,700 |
Utah | 1,223,000 | 1,260,100 | 37,100 |
Tennessee | 2,673,500 | 2,709,900 | 36,400 |
Footnotes: | |||
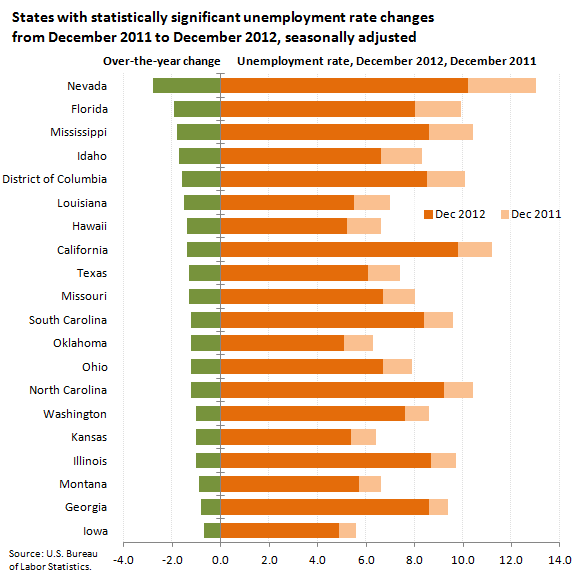
From December 2011 to December 2012, 19 states and the District of Columbia reported statistically significant unemployment rate changes, all of which were declines. The largest of these occurred in Nevada, where the unemployment rate decreased from 13.0 percent to 10.2 percent over the year (a change of -2.8 percentage points), followed by Florida (-1.9 points) and Mississippi (-1.8 points).
| State | Unemployment rate | Over-the-year change(p) | |
|---|---|---|---|
| Dec 2011 | Dec 2012(p) | ||
Nevada | 13.0 | 10.2 | -2.8 |
Florida | 9.9 | 8.0 | -1.9 |
Mississippi | 10.4 | 8.6 | -1.8 |
Idaho | 8.3 | 6.6 | -1.7 |
District of Columbia | 10.1 | 8.5 | -1.6 |
Louisiana | 7.0 | 5.5 | -1.5 |
California | 11.2 | 9.8 | -1.4 |
Hawaii | 6.6 | 5.2 | -1.4 |
Missouri | 8.0 | 6.7 | -1.3 |
Texas | 7.4 | 6.1 | -1.3 |
North Carolina | 10.4 | 9.2 | -1.2 |
Ohio | 7.9 | 6.7 | -1.2 |
Oklahoma | 6.3 | 5.1 | -1.2 |
South Carolina | 9.6 | 8.4 | -1.2 |
Illinois | 9.7 | 8.7 | -1.0 |
Kansas | 6.4 | 5.4 | -1.0 |
Washington | 8.6 | 7.6 | -1.0 |
Montana | 6.6 | 5.7 | -0.9 |
Georgia | 9.4 | 8.6 | -0.8 |
Iowa | 5.6 | 4.9 | -0.7 |
Footnotes: | |||
Nevada and Rhode Island, each with an unemployment rate of 10.2 percent, recorded the highest unemployment rates among the states in December 2012. North Dakota again registered the lowest jobless rate, 3.2 percent. The unemployment rates in Rhode Island and North Dakota did not change significantly over the year.
These data are from the Current Employment Statistics (State and Metro Area) and Local Area Unemployment Statistics programs. Data for the most recent month are preliminary and subject to revision. To learn more, see "Regional and State Employment and Unemployment — December 2012" (HTML) (PDF), news release USDL-13-0059.
Bureau of Labor Statistics, U.S. Department of Labor, The Economics Daily, Texas has largest over-the-year employment increase; Nevada has largest unemployment rate decrease at https://www.bls.gov/opub/ted/2013/ted_20130122.htm (visited July 22, 2026).
