An official website of the United States government
 United States Department of Labor
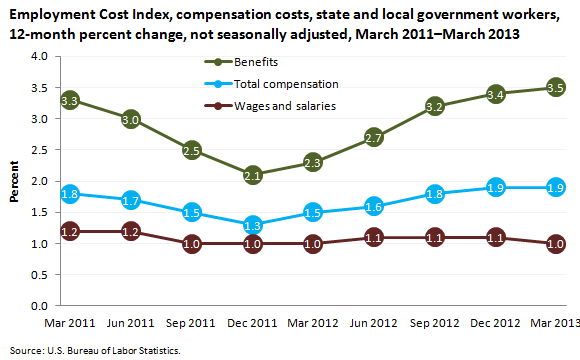
Compensation costs for state and local government workers increased 1.9 percent for the 12-month period ending March 2013. In March 2012 the increase was 1.5 percent.

| Total compensation | Wages and salaries | Benefits | |
|---|---|---|---|
Mar 2011 | 1.8 | 1.2 | 3.3 |
Jun 2011 | 1.7 | 1.2 | 3.0 |
Sep 2011 | 1.5 | 1.0 | 2.5 |
Dec 2011 | 1.3 | 1.0 | 2.1 |
Mar 2012 | 1.5 | 1.0 | 2.3 |
Jun 2012 | 1.6 | 1.1 | 2.7 |
Sep 2012 | 1.8 | 1.1 | 3.2 |
Dec 2012 | 1.9 | 1.1 | 3.4 |
Mar 2013 | 1.9 | 1.0 | 3.5 |
Wages and salaries were up 1.0 percent for the 12-month period ending March 2013, the same as the March 2012 change. Prior values for this series, which began in June 1982, ranged from 1.0 percent to 8.5 percent.
Benefit costs increased 3.5 percent in March 2013, up from the March 2012 increase of 2.3 percent.
These data are from the Employment Cost Trends program. To learn more, see “Employment Cost Index — March 2013” (HTML) (PDF), news release USDL-13-0781.
Bureau of Labor Statistics, U.S. Department of Labor, The Economics Daily, Compensation costs in March 2013: state and local government workers at https://www.bls.gov/opub/ted/2013/ted_20130501.htm (visited February 18, 2026).

