An official website of the United States government
 United States Department of Labor
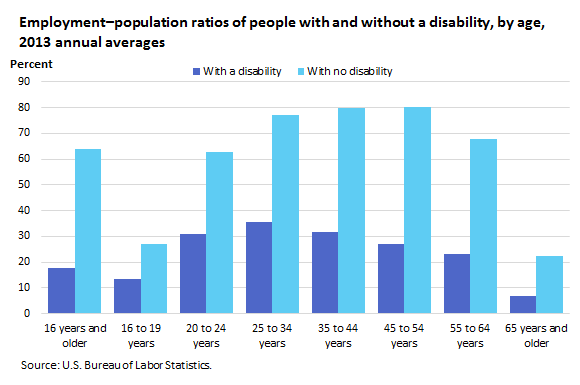
In 2013, 17.6 percent of people with a disability were employed. In contrast, the employment–population ratio for those without a disability was 64.0 percent. The employment–population ratio was little changed from 2012 to 2013 for both groups.

| Age | With a disability | With no disability |
|---|---|---|
16 years and older | 17.6 | 64.0 |
16 to 19 years | 13.4 | 27.1 |
20 to 24 years | 31.0 | 62.9 |
25 to 34 years | 35.7 | 77.0 |
35 to 44 years | 31.7 | 79.9 |
45 to 54 years | 26.9 | 80.4 |
55 to 64 years | 23.2 | 67.7 |
65 years and older | 6.9 | 22.4 |
The lower employment–population ratio among people with a disability is due, in part, to the large share of people with a disability who were age 65 and older. Older people are less likely to be employed than are people in younger age groups. Across all age groups, however, people with a disability were much less likely to be employed than those with no disability.
These data are from the Current Population Survey. For more information, see "Persons with a Disability: Labor Force Characteristics — 2013" (HTML) (PDF), news release USDL‑14‑1076.
Bureau of Labor Statistics, U.S. Department of Labor, The Economics Daily, Employment of people with disabilities in 2013 at https://www.bls.gov/opub/ted/2014/ted_20140626.htm (visited February 04, 2026).

