
An official website of the United States government
An official website of the United States government
The .gov means it's official.
Federal government websites often end in .gov or .mil. Before sharing sensitive information,
make sure you're on a federal government site.
The site is secure.
The
https:// ensures that you are connecting to the official website and that any
information you provide is encrypted and transmitted securely.
The Occupational Requirements Survey (ORS) publishes job-related information on physical demands; environmental conditions; education, training, and experience; as well as cognitive and mental requirements. The Occupational Employment and Wage Statistics (OEWS) survey produces employment and wage estimates for approximately 830 occupations. The ORS and OEWS programs survey business establishments (employers). BLS encourages users to consider the employment estimates from OEWS as the most reliable and representative occupational employment data produced by BLS.
ORS can be used to identify the percentage of workers that have specific job requirements. Combining this with OEWS data, users can derive estimates of occupational employment with specific requirements. Understanding the number of jobs with specific requirements can be useful to job seekers, vocational and rehabilitation experts, human resource professionals, hiring managers, safety and medical professionals, and the disability community. The estimates from these two programs can be used to understand the nature of work, benchmark job requirements, develop recruitment plans, and assess job risks. By combining data from these programs, the BLS can provide detailed occupational employment data such as the estimated number of jobs in an occupation with a specific job requirement, employment for jobs with a specific set of requirements, and a list of occupations meeting a selection of requirement thresholds.[1] Users should consider each survey’s design, methodology, and reliability before combining estimates.[2]
In instances where percentage of worker estimates cannot be published as point values, the estimate may be published as a range. Ranges incorporate the point estimate’s standard error to form a one-sided 90-percent confidence interval, rounded to the nearest 5 percent. For more information on ranges, see the range estimates factsheet. Following each of the approaches below is additional guidance applying the same or similar methods when working with range estimates.
To estimate the occupational employment with specific job requirements, multiply the percentage of workers that have selected job requirements from ORS by the occupational employment from OEWS. Some job requirements may be grouped together and are considered additive, such as levels of strength (e.g., light or medium) or specific vocational preparation (SVP). Additive job requirements can be added together before calculating the occupational employment.[3]
For example, to calculate the number of general office clerks required to have specific vocational preparation of a month or less:
SVP levels are additive, so 35.7 percent of general office clerks are required to have a month or less of specific vocational preparation.
There are 2,517,350 general office clerks in the national economy according to OEWS. Therefore, 2,517,350 multiplied by 35.7 percent is about 898,694 general office clerks in the national economy where the minimum specific vocational preparation required is a month or less.
Range estimates
Let’s consider the percentage of dental hygienists requiring light or medium strength:
44.1 percent of dental hygienists required light strength
Less than 5 percent of dental hygienists required medium strength
In this example, any percentage of dental hygienists up to 5 percent required medium strength. Users can choose to use the bound of the range estimate when working with additive job requirements to get a sense of the number of workers with those requirements.
To calculate the maximum dental hygienists that could require light or medium strength:
The upper bound of the range estimate for medium strength, 5 percent, added with the percentage of dental hygienists requiring light strength, 44.1 percent, results in 49.1 percent of dental hygienists that could require light or medium strength.
Multiplying 49.1 percent and the number of dental hygienists in the economy, 214,700 workers, results in up to 105,418 dental hygienists that could be required to use light or medium strength.
Using ORS percentage estimates and OEWS employment data, estimates of the employment for multiple job requirements can be calculated. This is helpful for determining the lower and upper bounds of employment in a detailed occupation with multiple requirements. It is at the data user’s discretion to determine which bound best fits their purposes. When applying this method, users can combine stand-alone requirements as well as additive requirements by assuming job requirements exist similarly across different subsets of the population.
Consider an example using the following ORS requirement percentages for general office clerks:
Sedentary and light strength levels are additive, with 96.0 percent of general office clerks required to perform work with a sedentary or light strength level. Quiet noise intensity is used as a stand-alone estimate in this example.
There are 2,517,350 general office clerks in the national economy according to OEWS.
2,517,350 * 27.0 percent ≈ 679,685 with a quiet noise intensity level
2,517,350 * 96.0 percent ≈ 2,416,656 with a sedentary or light strength level
Assuming these job requirements exist similarly in different subsets of the population, this example can be refined further by multiplying the two job requirement percentages to the estimated employment from the previous step. This example assumes that a quiet noise intensity requirement exists uniformly across worker strength levels.
679,685 * 96.0 percent ≈ 652,497
or
2,416,656 * 27.0 percent ≈ 652,497
Therefore, an estimated 679,685 general office clerks in the national economy experience a quiet noise intensity level, and of these, an estimated 652,497 have a strength level not exceeding light.[4]
Extending the example above further, 26.5 percent of general office clerks do not have a supervisor present.
2,517,350 * 26.5 percent ≈ 667,098 general office clerks with no supervisor present
This requirement represents the lowest percentage of the requirements selected, meaning at the maximum, no more than 667,098 general office clerks meet these combined requirements. Again, this number can be refined further by assuming these job requirements exist similarly in different subsets of the population, and each requirement’s percentage can be multiplied together by the occupational employment.
2,517,350 * 96.0 percent of workers with sedentary or light strength levels * 27.0 percent of workers with quiet noise intensity level * 26.5 percent of workers with supervisor not present ≈ 172,912 general office clerks
Therefore, an estimated 667,098 general office clerks have no supervisor present, and of these an estimated 172,912 require sedentary or light strength and have a quiet noise intensity level.
Range estimates
The percentage of roofers exposed to a loud noise level is published as a range of less than 25 percent rather than a point estimate. A medium strength level was required for 74.7 percent of roofers. There are 131,980 roofers in the national economy according to OEWS. A user can use the range boundary to determine the maximum number of roofers that experienced loud noise and required medium strength.
131,980 * 25 percent ≈ 32,995 with a loud noise intensity level
131,980 * 74.7 percent ≈ 98,589 with a medium strength level
Again, we assume that job requirements exist similarly in subsets of the population.
98,589 * 25 percent ≈ 24,647
or
32,995 * 74.7 percent ≈ 24,647
Therefore, less than 32,995 roofers in the national economy experience a loud noise intensity level, and of these, less than 24,647 are estimated to have a medium strength level.
Data from ORS can be used to identify occupations that meet user-determined thresholds for multiple job requirements. Once occupations meeting a combination of requirements are identified, OEWS can be used to find the total employment for those occupations. This is helpful for job seekers who would like to see the types and numbers of jobs available for their given set of skills and limitations.
This approach provides the total employment in occupations that meet requirement thresholds; it does not provide the number of jobs with specific requirements. Additionally, in cases where the threshold outlined covers more than one estimate from an additive group, it may be necessary to add estimates to identify occupations. This would create a broader estimate (such as “sedentary or light strength level”), rather than listing each requirement separately.
For example, consider the following occupational requirement thresholds:
General office clerks and insurance sales agents are occupations that meet this combination of thresholds. There are 2,517,350 general office clerks and 445,540 insurance sales agents in the national economy according to OEWS.
Range estimates
Thresholds can be applied to range estimates using the same method as above. Users should note that range estimates include a confidence interval around the estimate while point estimates do not. To have comparable thresholds for ranges and point estimates, users can build confidence intervals around point estimates prior to applying thresholds. See the following section for more information on building confidence intervals.
When considering the standard errors of combined estimates, one approach is to create a simple confidence interval around each of the estimates. Another more rigorous approach is to use a pooled standard error calculation to produce a confidence interval for the combined estimates.[5] More information on standard errors and confidence intervals is available on the ORS standard errors page.[6]
Using the example above, there are 2,517,350 general office clerks and the relative standard error is 0.6 percent. For SVP 2, the estimate is 33.7 percent, and the standard error is 2.3.
For the OEWS estimate, first convert the relative standard error to a standard error.
2,517,350 * 0.6 percent = 15,104
Next, calculate the OEWS confidence interval.
2,517,350 +/- (1.645 * 15,104) = 2,517,350 +/- 24,846 = [2,492,504, 2,542,196]
If an ORS point estimate is available, calculate the confidence interval.
33.7 +/- (1.645 * 2.3) = 33.7 +/- 3.8 = [29.9, 37.5] percent
Alternatively, if an ORS range estimate is available, use it in place of a calculated confidence interval.
<35% = [0.0, 35.0] percent
Using the lower bounds will provide a smaller number of workers with selected job requirements and using the upper bounds will provide more workers with those requirements.
Lower bounds: 2,492,504 * 29.9 percent ≈ 745,259 general office clerks with SVP 2
Upper bounds: 2,542,196 * 37.5 percent ≈ 953,324 general office clerks with SVP 2
Summary Calculation: (2,517,350 +/- 24,846) * (33.7 +/- 3.8) ≈ [745,259, 953,324]
Range estimates
This same approach of simple confidence interval (90%) is used to calculate ORS range estimates. When estimates are provided as ranges rather than point values, a confidence interval (90%) is calculated around the estimate. If the estimate is between 0 and 50 percent, the upper bound of the confidence interval is provided and rounded up to the nearest 5 percent (e.g., less than 45 percent). If the estimate is between 50 and 100, the lower bound of the confidence interval is given and rounded down to the nearest 5 percent (e.g., greater than 75 percent).
Users interested in a more rigorous approach to estimating the variance of a composite ORS-OEWS estimate may consider using the variance of a product of two independent random variables.[7]
Continuing with the same example, this formula can be used to estimate the variance of a composite ORS-OEWS estimate as follows. Note that the composite ORS-OEWS estimate is the product of the ORS estimate and the OEWS estimate. The variance of an estimate is equal to the square of its standard error.

= ((0.337)^2 + (0.023)^2 )*((2,517,350)^2 + (15,104)^2 ) - ((0.337)^2*(2,517,350)^2)
= 3,378,329,261

Therefore, the 90% confidence interval for this estimate is:

≈ (0.337*2,517,350) +/- (1.645*58,123)
≈ 848,347 +/- 95,613
≈ [752,734, 943,960]
Using the lower bound will provide a smaller number of workers with selected job requirements (approximately 752,734 general office clerks with SVP 2) and using the upper bound will provide more workers with those requirements (approximately 943,960 general office clerks with SVP 2).
OEWS provides employment estimates at multiple levels of geographic detail—national, state, metropolitan, and nonmetropolitan areas—while the ORS provides estimates representative of the national economy and not by geographic area. Users should keep in mind the level of accuracy required for their specific purpose, particularly when using these methods for state, metropolitan, and nonmetropolitan areas.
Users should be aware that although ORS data is not produced by state, metropolitan, or nonmetropolitan areas, certain requirement estimates may differ by region for a variety of reasons. Users should evaluate regional differences before combining estimates from ORS. The following are a few examples of factors that may cause regional differences in requirements.
The credentials required for some occupations may vary based on state and local laws. Some occupations only require licenses in certain states to operate. Here are a few examples of occupations that have license requirements in some, but not all, states: hairdressers, security guards, electricians, and plumbers. Electricians require a license to perform their work in many states, but in others, like New York, there are no laws requiring credentials, prior work experience, or on-the-job training for electricians.[8]
Based on climate and geographical differences as well as differences in industry composition between specific regions, it is reasonable to expect that the frequency of occupational requirements for outdoor exposure would not be consistent for an occupation when comparing different state and metropolitan areas. For example, a cashier in Florida may be required to spend more time outdoors than a cashier in a northern state.
Union membership rates vary widely across the United States. This will likely correlate to differences in the requirements placed on workers, especially when looking at localities with large differences in union participation.
[1]Examples provided are based on the 2023 reference period estimates for ORS and 2022 reference period estimates for OEWS.
[2]Note that for all combined ORS-OEWS estimates, the reliability of the combined estimate will necessarily be lower than the reliability of each individual estimate. For more information about each survey’s design, see the ORS Handbook of Methods and the OEWS overview.
[3]For more information, see the category and additive codes factsheet.
[4]Except for additive requirements, job requirements are collected separately. The actual amount of overlap between distinct requirements is unknown. For example, all jobs with requirement A could also have requirement B, or no jobs with requirement A may also have requirement B. The lower bound assumes the percentage of jobs with a given requirement is not affected by whether jobs have other requirements. That is, if 30 percent of jobs have requirement A, that 30 percent applies regardless of jobs having requirement B. The upper bound is the estimated number of workers with the least prevalent requirement also have the more prevalent ones. There are a variety of assumptions included in this approach and requirements could even be negatively correlated, e.g., in the extreme case, no jobs with requirement A also have requirement B.
[5]The pooled standard error approach assumes that the ORS and OEWS estimates are independent.
[6]A more rigorous approach, beyond the scope of this factsheet, is to use parametric bootstrapping to estimate the variance of a combined ORS-OEWS estimates. Replicate samples can be generated for job requirements estimates by drawing random estimates from the normal distribution defined by the estimate and its standard error. The same can be done for a corresponding OEWS employment estimate. For each replicate, the randomly sampled ORS estimate and the randomly sampled OEWS estimate can be multiplied to produce a combined ORS-OEWS estimate. The combined estimates for each replicate can in turn be used to produce a variance estimate for the combined ORS-OEWS estimate:
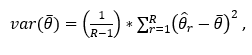
where:

represents the ORS estimate multiplied by the OEWS estimate,
R
represents the number of bootstrap replicates, and

represents the product of the randomly sampled ORS estimate and the randomly sampled OEWS estimate for each replicate r.
The standard error for the estimate is the square root of the variance.
Other methods for calculating the reliability of estimates are included for reference, see A measurement error model approach to survey data integration: combining information from two surveys and Data Fusion: Identification Problems, Validity, and Multiple Imputation. The authors and funding for the research are not affiliated with the BLS.
[7]The variance of a product is found using the following formula:

[8] See the National Conference of State Legislatures' National Occupational Licensing Database for more information.