
An official website of the United States government
An official website of the United States government
The .gov means it's official.
Federal government websites often end in .gov or .mil. Before sharing sensitive information,
make sure you're on a federal government site.
The site is secure.
The
https:// ensures that you are connecting to the official website and that any
information you provide is encrypted and transmitted securely.
Kristin Smyth
U.S. Bureau of Labor Statistics
2 Massachusetts Ave., NE, Room 4166,
Washington, DC 20212
The Occupational Requirements Survey (ORS) is an establishment survey conducted by the Bureau of Labor Statistics (BLS) in collaboration with the Social Security Administration (SSA). The survey collects information on the vocational preparation and the cognitive and physical requirements of occupations in the U.S. economy, as well as the environmental conditions in which those occupations are performed.
These data are collected by BLS field economists who conduct interviews with establishment representatives. To answer the question of whether or not this collection process results in similar measurements as data collected through direct job observation (which is more typical among small scale studies of job tasks), BLS has conducted two previous job observation tests, once in 2015 and another in 2017. Both tests found that moderate to high rates of agreement existed between observed and collected data for most requirements. 1
This paper provides additional data on whether data collected via interview results in similar measures as data collected via observation. It also attempts to identify any differences in the two collection modes at the individual occupation level. The third ORS sample group was collected in 2018 and is referred to here as “the third year of ORS.” 2 A sample of these third year of ORS respondents was re-contacted after providing interview data on work related to the critical function of the job. Field economists then arranged to visit the establishment and observe workers performing their jobs. There was again statistically significant moderate to substantial rates of agreement between observed and collected data for most elements. The measures of agreement were stronger in this test than in previous tests, suggesting the critical function threshold of the 2018 ORS data better aligns with the observed data. There was also a pattern of the one-hour observation time limit resulting in missed presence of certain physical elements but with little bias in the duration of elements found to be present.
The goal of the ORS is to collect and publish occupational information that meets the disability adjudication needs of SSA at the level of the eight-digit Standard Occupational Classification (SOC) system that is used by the Occupational Information Network (O*NET).
The ORS data are collected using the infrastructure of the National Compensation Survey (NCS), which uses field economists (FEs) to collect data. FEs generally collect data elements through an interview with a knowledgeable respondent at the sampled establishment.
For ORS, FEs are collecting occupationally-specific data elements to meet SSA’s needs in the following categories:
In fiscal year 2018, the BLS completed data collection for the final of three independent samples of ORS production, all of which contribute to the 2018 ORS estimates. This most recent sample group is referred to here as “the third year of ORS.” In this round, the BLS collected requirements using a revised scope of work limited to only tasks that were related to the “critical job function” (i.e., the reason the job exists).3 In addition to being related to the critical job function, these tasks had to be “expected and usual.”
As opposed to the third year of ORS collection by FE interview, however, the observation of the job related to all aspects of work, including job functions that were incidental or not specific to one job and were unrelated to the primary hiring and pay factors of jobs. This paper focuses on comparing the data on “critical job function” from the FE interview from the third year of ORS to the “all aspects of work” threshold via observation of the performance of the job.
The first ORS job observation test was conducted in 2015 and was intended to assess whether the data collected through ORS interview collection methods are systematically different than data collected through direct observation. This test was conducted in response to both Federal Register Notice public comments and an external subject matter expert’s recommendations for testing and validation of ORS survey design.4 The test involved re-contacting establishments that had already given interview data in order for two field economists to visit the establishment and observe workers performing their jobs. The test found relatively high rates of agreement between observed and collected data for most physical requirements tested. The 2015 analysis also indicated that the agreement between the two field economists was high, also known as “inter-rater reliability.”
Since the inter-rater reliability was high in the first observation test, the designers of a second job observation test felt confident that valid data could be collected by sending just one field economist to observe a job. Thus, a second job observation test was planned to take advantage of the possible increase in sample size allowed by having just one field economist observe each establishment. The aim for this second test was also to gather information on a new group of selected occupations.
The second job observation test was conducted in 2017 and again involved re-contacting a subset of establishments that were interviewed as part of the second year of ORS production. A different FE than had originally contacted the establishment went to observe selected jobs within the establishment and record data on the selected elements during a typical one-hour observation period. The one-hour observation period sought to achieve a balance between gathering data on as many jobs as possible and the respondent burden involved in conducting such a test. If the FE was cut short in his/her observation, the data were converted to a percentage of the amount of time they were able to observe the incumbent.
A third job observation test was planned in order to add more individual assessments between the two modes of collection, particularly given the new “critical job function.” This third job observation test was conducted through the spring and summer of 2018 and involved re-contact of establishments from the third year of ORS. The same procedures were used as in the second test, and the average observation duration was 58 minutes, the same as the last test.
As the goal of ORS is to produce estimates at the eight-digit O*NET SOC level, this observation test was structured to allow BLS to compare production data to observed data at the eight-digit SOC level. The occupations identified for the test were chosen based on the expected prevalence of certain physical demands in the job (i.e., selecting jobs where there is a higher likelihood of observing the incidence and duration of physical demands, thereby increasing the power to compare data from the two collection modes). From these occupations, the subset was chosen based on three criteria:
This resulted in the following occupations being selected for the third ORS observation test:
Automotive Service Technicians and Mechanics, Automotive Master Mechanics, and Automotive Specialty Technicians were intended to be combined into one occupation for the purposes of analysis.
The sample consisted of 542 preselected quotes from existing third year of ORS establishments. The test sample frame units were ordered by a combination of geography, industry and size class to ensure a representative distribution of available establishments within each of the targeted occupations. The sample was drawn as three separate lists at different points during the third year of ORS collection to allow occupations collected in each of the first three quarters of third year collection to have a chance of selection, since a job could only be observed after interview data had been obtained.
For each of the sampled establishments and jobs, an FE secured an appointment and explained to the respondent the reason for the follow-up visit. He or she then collected data via personal visit. The FEs were instructed not to look at data recorded from the third year of ORS for their establishments. The FE then recorded and coded their observations during the personal visit. FEs attempted to be as inconspicuous as possible and to not ask questions of the observed employee.
In this test, the FEs were instructed to code the duration in minutes during the observation period, which was typically 60 minutes, and to code a duration of zero if the element was not observed. These durations were later fit to the duration scale used in production, described later.
The elements observed in the observation test are shown in Table 1.
| Element | Description |
|---|---|
|
Climbing Ladders/Ropes/Scaffolding |
Ascending or descending ladders, scaffolding, ropes, or poles using feet/legs and hands/arms. |
|
Climbing Ramps/Stairs |
Ascending or descending ramps or stairs primarily using feet and legs. Hands and arms may be used for balance (i.e. to hold a railing). |
|
Communicating Verbally |
Expressing or exchanging ideas by means of the spoken word to impart oral information to clients or the public and to convey detailed spoken instructions to other workers accurately, loudly or quickly. |
|
Crawling |
Moving about on hands and knees or hands and feet. |
|
Crouching |
Bending the body downward and forward by bending the legs and spine. |
|
Fine Manipulation |
Touching, picking, pinching, or otherwise working primarily with fingers rather than the whole hand or arm. |
|
Kneeling |
Bending the legs at the knees to come to rest on knee(s). |
|
Lift/Carry |
Raising or lowering an object from one level to another or transporting an object, usually by holding it in the hands or arms, or wearing it on the body, usually around the waist or upper torso |
|
Overhead Reaching |
Extending the arm(s) with the hand higher than the head and either bending the elbows with the angle at the shoulders about 90 degrees or more or keeping the elbow extended with the angle at the shoulder about 120 degrees or more. |
|
Pushing/Pulling Hands/Arms |
Exerting force upon an object so that it moves away from (pushing) or toward (pulling) the origin of the force. |
|
Sitting/Standing |
Sitting or lying down versus all other postures. |
|
Stooping |
Bending the body forward and down while bending the spine at the waist 45 degrees or more either over something below waist level or down towards an object on or near the ground. |
|
Wetness |
Any contact with water or liquid, not due to weather. |
The duration of most elements for the third year of ORS was classified into five categories:
For the job observation test, we also categorized the share of observation period into these same five categories. The minutes the element was observed were divided by the total observation time to arrive at the percentage of the time the element was observed.
Of those 542 quotes in the test sample, FEs observed 171, or 32%. This compares to the previous (2017) test’s response rate of 34%. As shown in Table 2, the collection rate varied by occupation. For the job observation test, there was no follow-up or refusal conversion, unlike standard ORS collection protocol. This was not required for this test to avoid respondent burden and the associated impacts on production, as well as due to staffing resource limitations. Additionally, collection was stopped on five occupations about two-thirds of the way through the collection period so as to focus on collecting additional data for the occupations showing the most promising response rates. Collection was stopped on computer user support specialists, security guards, hairdressers, executive secretaries, and packers and packagers.
| SOC title | Observed | Refused | Total sampled |
|---|---|---|---|
|
Computer User Support Specialists |
8 | 16 | 57 |
|
Security Guards |
12 | 11 | 57 |
|
First-Line Supervisors of Food Preparation and Serving Workers |
26 | 17 | 57 |
|
Counter Attendants, Cafeteria, Food Concession, and Coffee Shop |
23 | 11 | 45 |
|
Landscaping and Groundskeeping Workers |
26 | 15 | 57 |
|
Hairdressers |
9 | 7 | 41 |
|
Shipping, Receiving, and Traffic Clerks |
17 | 21 | 57 |
|
Executive Secretaries and Administrative Assistants |
9 | 12 | 57 |
|
Automotive Service Technicians and Mechanics |
5 | 4 | 10 |
|
Automotive Master Mechanics |
16 | 6 | 27 |
|
Automotive Specialty Technicians |
11 | 7 | 20 |
|
Packers and Packagers, Hand |
9 | 25 | 57 |
The counts of present and not present for each element for both the observation period and the interview collection data are shown in Table 3. Communicating verbally, fine manipulation, and standing were the elements with the most recorded prevalence. We see the same three elements with the most prevalence in the interview collection data. These counts do not indicate if there was a match between the individual cases, which are investigated visually in the next section.
| Element | Interview Collection | Observation | ||
|---|---|---|---|---|
| Not Present | Present | Not Present | Present | |
|
Climbing Ladders |
150 | 14 | 135 | 7 |
|
Climbing Ramps/Stairs |
144 | 16 | 128 | 11 |
|
Communicating Verbally |
37 | 123 | 29 | 138 |
|
Crawling |
151 | 11 | 156 | 2 |
|
Crouching |
92 | 54 | 114 | 44 |
|
Fine Manipulation |
6 | 142 | 13 | 153 |
|
Kneeling |
104 | 46 | 131 | 27 |
|
Overhead Reaching |
75 | 77 | 69 | 90 |
|
Pushing/Pulling Hands/Arms |
120 | 38 | 41 | 114 |
|
Sitting |
56 | 108 | 81 | 82 |
|
Standing |
3 | 161 | 6 | 165 |
|
Stooping |
42 | 99 | 53 | 112 |
|
Wetness |
77 | 78 | 86 | 74 |
The durations gathered from the observation and the interview can be matched as pairs, as seen visually in Figure 1. Each point represents a job in a particular establishment, and the x- and y-axes represent the duration from the interview collection and the observation. Since there are only five categories, the plots are arranged so the individual points can be seen rather than superimposed within the category.
Figure 1 presents the graphs for an element in which the agreement between the two methods of collection was high, the amount of overhead reaching.6 It allows us to explore the agreement between the two methods of collection visually by each occupation.
Figure 1: Scatterplots of Agreement for Overhead Reaching
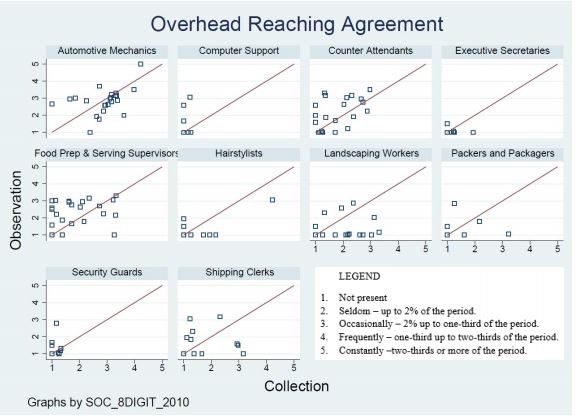
The 45 degree line provides a reference line for perfect agreement, where both the interview and observed duration measures fall into the same category. Points substantially off the diagonal line represent major disagreements in the duration ranking. The graphs for Figure 1 seem to have some clustering around the 45 degree line, indicating similar data was collected in observation as in interview collection. This appears to be different from the scatterplots in Figure 2, which presents the graphs for an element where the agreement between the two methods of collection was only moderate, the amount of fine manipulation.
Figure 2: Scatterplots of Agreement for Fine Manipulation
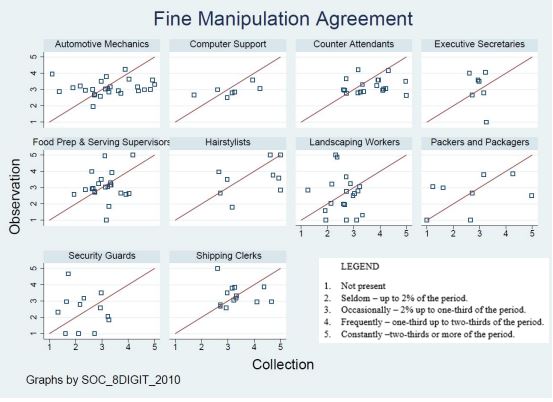
The points do not seem as clustered around the 45 degree line in the same way as the overhead reaching data. This indicates that the agreement measures for this element, based on this visual inspection of the data, are expected to be lower.
As a formal measurement of the agreement between the two methods, we first use a weighted version of Cohen’s kappa. The kappa statistic measures the agreement against a benchmark of the expected agreement, bearing in mind that if there are only a few possible categories the FEs could randomly enter data and agree simply by chance. Cohen’s weighted kappa statistic penalizes for disagreements of higher magnitudes, making its use appropriate for data such as these where the categories are ordered. For example, if the interview data showed an element as occurring frequently and the observation data showed the same element as not present, it is penalized more than if one were frequently and the other was occasionally.
Kappa values generally range from -1 to +1. Negative values of kappa indicate that the level of agreement is less than the expected agreement. Similar to correlation measures, kappa statistics close to (positive) one imply a higher level of agreement. While there exists some controversy in the literature regarding thresholds of kappa, Landis and Koch (1977a) have proposed the following standards: =0 is poor, 0.01–0.20 is slight agreement, 0.21–0.40 is fair agreement, 0.41–0.60 is moderate agreement, 0.61–0.80 is substantial agreement, and 0.81–1 is almost perfect agreement.
Measuring agreement between observed and interview data for the purposes of this test is complicated by two factors:
To partly address the challenges posed by the short duration of the job observation, we re-categorize the durations into four categories, aggregating not present and seldom into one category. This is performed after the observation duration has already been converted into the comparable scale to production:
Table 4 presents multiple measures that allow us to assess the agreement between the two methods. Column 2 presents the level of absolute agreement between methods of collection. These values range from a low of 78% for fine manipulation to 99% for climbing ladders. As can be seen in column 3, however, the expected levels of agreement are also relatively high and as such the weighted kappa statistics are relatively low.7 Averaging across the elements, kappa is 0.21, which falls in the “fair agreements” range and is higher than the last test’s average of 0.14 which fell in the “slight agreements” range. Most agreement measures are statistically higher than expected agreement in a 5 percent one-tailed test (see column 5 of Table 4); the exceptions are climbing ladders, climbing ramps/stairs, crouching, and pushing/pulling with hands/arms.
| ORS Element | Agreement | Expected Agreement | Cohen’s Weighted Kappa | Prob>Z |
|---|---|---|---|---|
|
Climbing Ladders |
99.26% | 99.27% | -0.01 | 0.55 |
|
Climbing Ramps/Stairs |
97.67% | 97.75% | -0.03 | 0.65 |
|
Communicating Verbally |
81.08% | 74.57% | 0.26 | 0 |
|
Crawling(1) |
- | - | - | - |
|
Crouching |
92.75% | 91.68% | 0.13 | 0.06 |
|
Fine Manipulation |
78.17% | 73.60% | 0.17 | 0 |
|
Kneeling |
94.29% | 93.47% | 0.13 | 0.05 |
|
Overhead Reaching |
88.25% | 84.02% | 0.26 | 0 |
|
Pushing/Pulling Hands/Arms |
81.09% | 79.72% | 0.07 | 0.07 |
|
Sitting |
81.84% | 60.98% | 0.53 | 0 |
|
Standing |
88.35% | 75.73% | 0.52 | 0 |
|
Stooping |
84.69% | 81.47% | 0.17 | 0.01 |
|
Wetness |
87.04% | 81.55% | 0.3 | 0 |
An additional table providing these measures for a comparison of present and not present is provided in Appendix A. Seldom is again re-categorized with not present for the analysis. The measures of agreement appear to be similar as when analyzing all categories.
There can be considerable difference in the measures of agreement between occupations. For example, the measures of agreement for crouching, which above seems to have a high level of agreement, are shown below for those occupations with over 20 matching pairs of data. Only one, counter attendants, shows a statistically significant and positive agreement.
| Occupation | Agreement | Expected Agreement | Cohen’s Weighted Kappa | Prob>Z |
|---|---|---|---|---|
|
Automotive mechanics |
80.56% | 84.38% | -0.24 | 0.88 |
|
Counter attendants |
94.12% | 89.04% | 0.46 | 0.03 |
|
Food prep and serving supervisors |
93.94% | 94.35% | -0.07 | 0.66 |
|
Landscaping workers |
90.20% | 88.58% | 0.14 | 0.25 |
The level of agreement ranges from 81% for automotive mechanics to 94% for counter attendants. The kappa value ranges from being negative, implying the observation data matched with the interview data at a rate less than expected simply by chance, to.46 for counter attendants, which falls into the “moderate agreement” part of the kappa interpretation scale. The counter attendants show a statistically higher than expected agreement in a 5 percent one-tailed test.
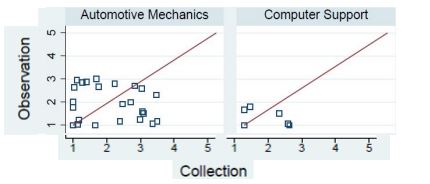
When we examine the scatterplot for this data, it appears that when observing automotive mechanics, crouching was often observed as being either “not present” or being present “occasionally.” In the interview data, this was also the case. But it appears that for this test, it was often the case that the quote recorded as “occasionally” in the interview was “not present” in the observation, and vice versa, resulting in low agreement measures. See Figure 3, below.
Figure 3: Scatterplots of Agreement for Crouching
In general, the weighted kappas by individual occupation were not statistically significant, likely due to the concentration of ratings in one particular category. This is addressed in the next section.
A well-known issue with kappa is the influence of prevalence and bias on the kappa measures. Generally, categories with underlying uniform distributions will result in higher values of kappa. The distributions of the physical elements in ORS, however, tend to be highly skewed. For example, in the jobs selected for observation, climbing ladders is very uncommon in the sampled jobs while fine manipulation is present in almost all cases with durations in the seldom or occasional range. Measuring kappa using data that have skewed prevalence can give rise to the “kappa paradox,” where high levels of rater agreement have relatively low kappa statistics (Feinstein and Cicchetti 1990 and Cicchetti and Feinstein 1990). Table 4 seems to show this sort of high level of agreement for this data.
To account for this, a measure of prevalence and bias adjusted kappa (PABAK) was used.8 The PABAK measure is presented in Table 6. Across all of the elements analyzed, the average value is .69, in the “substantial agreement” range. This is higher than the last test, which saw an average value of 0.55, in the “moderate agreement” range. We are particularly interested in the elements with lower PABAK values, as this indicates less agreement between the modes.
| ORS Element | PABAK | Prob>|t| |
|---|---|---|
|
Climbing Ladders |
0.99 | 0 |
|
Climbing Ramps/Stairs |
0.94 | 0 |
|
Communicating Verbally |
0.55 | 0 |
|
Crawling(1) |
- | - |
|
Crouching(1) |
- | - |
|
Fine Manipulation |
0.48 | 0 |
|
Kneeling |
0.86 | 0 |
|
Overhead Reaching |
0.72 | 0 |
|
Pushing/Pulling Hands/Arms |
0.55 | 0 |
|
Sitting |
0.56 | 0 |
|
Standing |
0.72 | 0 |
|
Stooping |
0.63 | 0 |
|
Wetness |
0.69 | 0 |
|
Note: Dashes indicate data not available. |
||
One of the lowest PABAK values is that for fine manipulation. To examine this element further, we again measure the agreement by occupation:
| Occupation | PABAK | Prob>|t| |
|---|---|---|
|
Food prep and serving supervisors |
0.56 | 0 |
|
Automotive mechanics |
0.42 | 0 |
|
Counter attendants |
0.56 | 0 |
|
Landscaping workers |
0.37 | 0.04 |
In particular, automotive mechanics had a consistent mismatch between the level in observation (which generally seemed to be occasional, see Figure 2) and the interview data (which was inconsistent).
A full set of PABAK measures for the four occupations with at least twenty matched quotes by each element with at least 20 observations of at least occasional duration are provided in Appendix B. Climbing ladders, climbing ramps/stairs, crawling, crouching, and kneeling had too few observations of the occasional duration or higher to make for a full set of measures.
Examining the scatterplots, a natural question is whether the distributions of the variables are different between methods of collection. This is a different question than whether the matched pairs match, instead examining if the distributions indicate that the people being interviewed and the people being observed come from the same overall population and have the same underlying distribution of duration for the elements. We first assess this using a Wilcoxon Rank Test, which tests the null hypothesis that both data are pulled from populations with the same distributions, and thus the matched pairs have a median difference of zero. These results are presented in column 2 of Table 8. It is a test of the hypothesis that the two variables come from the same underlying distribution. Using a 5 percent threshold, the hypothesis is rejected for 4 of the 12 elements. Climbing ladders, climbing ramps/stairs, crouching, fine manipulation, overhead reaching, standing, stooping, and wetness show no statistically significant difference between the distributions of the two methods of collection. For the most part this correlates with the elements that saw the strongest measures of agreement using the PABAK statistic.
Since the interview data is now collected using the “critical function” threshold, and there may be concern that this leaves out some observed physical elements, it would be of particular note if the third year of ORS data appeared to understate the duration of the physical elements. We evaluate this using a sign test. The null hypothesis is that the observed duration is less than or equal to the interview duration. We are interested in cases where the associated p-value is less than 0.05 and, thus, the null hypothesis is rejected. This suggests that the interview data are generally distributed with shorter durations than the observation data (see column 3 of Table 8). The case where this happens, pushing and pulling with hands and arms, has been highlighted. While this could indicate that the third year of ORS data possibly underestimates the duration of this element, it could also just be a function of the procedures for the interview collection versus the observation, The procedures for the interview portion of the test included a minimum amount of force to qualify the action for recordation. A broader scope of all witnessed pushing and pulling was used for the observation. Nevertheless, this is a consistent finding with that of last year’s job observation test, when the procedures were the same.
| ORS Element | Wilcoxon p-value | Ho: p value observed = interview | Ho: p value observed = interview |
|---|---|---|---|
|
Climbing ladders |
0.56 | 0.5 | 0.88 |
|
Climbing Ramps/Stairs |
0.32 | 0.91 | 0.25 |
|
Communicating Verbally |
0 | 1 | 0 |
|
Crawling(1) |
- | - | - |
|
Crouching |
0.14 | 0.95 | 0.1 |
|
Fine Manipulation |
0.55 | 0.76 | 0.32 |
|
Kneeling |
0.02 | 0.99 | 0.02 |
|
Pushing/Pulling Hands/Arms |
0 | 0 | 1 |
|
Reaching Overhead |
0.16 | 0.97 | 0.94 |
|
Sitting |
0.03 | 1 | 0.01 |
|
Standing |
0.18 | 0.92 | 0.13 |
|
Stooping |
0.39 | 0.86 | 0.21 |
|
Wetness |
0.2 | 0.92 | 0.13 |
|
Note: Dashes indicate data not available. |
|||
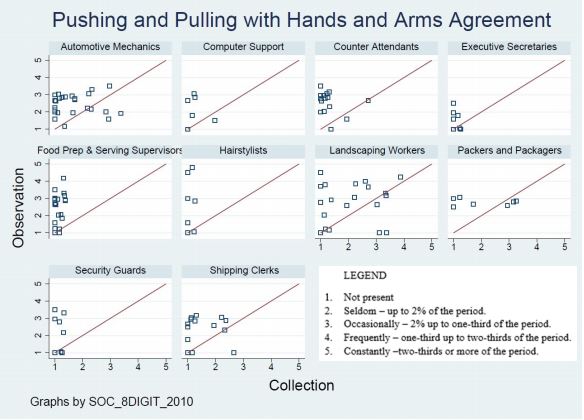
It appears that pushing and pulling with hands/arms is often marked as not present in the interview data but very often seen during the one hour observation. This is reflected in the Wilcoxon rank and sign tests and kappa measures. See Figure 4 for more information.
Three elements appear to have durations distributed with longer durations in the interview data than in the observation – communicating verbally, kneeling, and sitting. This could reflect the difference in the “critical function” threshold, in that observers may have seen and recorded verbal communication, kneeling, or sitting that was not required and thus would not have met the threshold for interview collection.
Figure 4: Scatterplots of Agreement for Pushing and Pulling with Hands and Arms
In the third year of ORS, the BLS collected requirements related to the critical functions of jobs, excluding job functions that were incidental or not specific to one job and were unrelated to the primary hiring and pay factors of jobs. The purpose of the job observation test was to identify differences between this collection approach and direct observation for a variety of ORS elements- mostly physical but also environmental - by comparing the data collected during the third year of ORS to those collected from observation.
Observation occurred at the same establishment for the same job that the interview had taken place, and lasted for a period no longer than 60 minutes. This limitation of the study design could have an impact on the presence of job requirements in the observation data.
Notwithstanding this short time period, the data still generally show that the prevalence adjusted kappa measures of agreement are in the substantial agreement range. However, the Wilcoxon test shows that the distributions of duration coding differed for 4 out of 12 elements, which suggests that the two methods do not always produce distributionally comparable data. In particular, it appears pushing/pulling with hands and arms is generally associated with a lower duration than what was measured during observation of the same job in the same establishment. Given that this was also a finding in the last job observation test, it may be worth doing additional procedures investigation to narrow down why this might be.
Given that the measures of agreement, the kappa measures, and the weighted kappa measures all suggest a stronger measure of agreement between the interview data and the observation data in this test than in previous tests, it appears the new critical job function threshold better aligns with the observed requirements of a job.
(1)Occupational Requirements Survey: results from a job observation pilot test is available at: www.bls.gov/opub/mlr/2016/article/occupational-requirements-survey.htm.
(2)The most recent Occupational Requirements Survey data is available at: www.bls.gov/ors/home.htm.
(3)See “How are we improving ORS?” at: https://www.bls.gov/ors/notices/2019/ors-improvements-09142017.htm.
(4)A link to the subject matter expert’s report can be found here: www.bls.gov/ors/research/collection/pdf/handel-methodological-issues-data-collection-full-report-feb15.pdf.
(5)For more information on “quotes” as used in the NCS (equivalent to their use in ORS), see the BLS Handbook of Methods, www.bls.gov/opub/hom/ncs/home.htm.
(6)A full set of plots is available from the author upon request.
(7)Measures of expected agreement, weighted kappa statistics, and the standard errors needed to compute p values were calculated using Stata (version 12). Stata’s calculations are based on Landis and Koch (1977b) and standard errors are based on Fleiss, Nee, and Landis (1979).
(8) See “Bias, prevalence and kappa.” Byrt T, Bishop J, Carlin JB. J Clin Epidemiol. 1993 May; 46(5):423-9.
Cain & Green, 1983. Reliabilities of Selected Ratings Available from the DOT. Journal of Applied Psychology, 155-165.
Campbell L, Pannett B, Egger P, Cooper C, Coggon, 1997. Validity of a questionnaire for assessing occupational activities. D. Am J Ind Med.
Cicchetti DV and AR Feinstein, 1990. “High agreement but low kappa II: Resolving the paradoxes.” The Journal of Clinical Epidemiology 43: 543-549.
Descatha et al. 2008. Self-administered questionnaire and direct observation by checklist: comparing two methods for physical exposure surveillance in a highly repetitive tasks plant. Applied Ergonomics, 194-198.
Feinstein AR and DV Cicchetti. 1990. “High agreement but low kappa I: The problem of two paradoxes.” The Journal of Clinical Epidemiology 43: 543-549.
Fleiss, J. L., J. C. M. Nee, and J. R. Landis. 1979. Large sample variance of kappa in the case of different sets of raters. Psychological Bulletin 86: 974–977.
Foster, M.R., 1998. Effective job analysis methods. Handbook of human resource management in government.
Halgren, Kevin H., 2012. Computing Inter-rater Reliability for Observational Data: An Overview and Tutorial. Tutorials in Quantitative Methods for Psychology, 8(1), 23-34.
Kilbom 1994. Assessment of physical exposure in relation to work-related musculoskeletal disorders - what information can be obtained from systematic observations? Scand J Work Environ Health, 30-45.
Landis JR and Koch GG. 1977a. The measurement of observer agreement for categorical data. Biometrics. 33:159–174.
Landis JR and Koch GG. 1977b. A one-way components of variance method for categorical data. Biometrics. 33:671–679.
Lysaght, R & Shaw, L, 2010. Job Analysis: What it is and how it is used. International Encyclopedia of Rehabilitation.
Martin, McCabe, 2001. Lost time injuries: Demographic variables, self-reports, and observational assessment of occupational demands. The Impacts of Social and Technological Change on Work, Health, and Safety, 177-182.
Nordstrom et al 1998. Comparison of Self-Reported and Expert-Observed Physical Activities at Work in a General Population. American Journal of Industrial Medicine, 29-35.
Stock, Fernandes, Delisle, Vezina, 2005. Reproducibility and validity of workers’ self-reports of physical work demands. Scand J Work Environ Health, 409-437.
Spielholtz et al. 2001. Comparison of self-report, video observation and direct measurement methods for upper extremity musculoskeletal disorder physical risk factors. Ergonomics, 588-613.
Winnemuller, Spielholtz, Kaufman, 2004. Comparison of ergonomist, supervisor, and worker assessments of work-related musculoskeletal risk factors. J Occup Environ Hyg, 414-422.
| ORS Element | Agreement | Expected Agreement | Cohen’s Weighted Kappa | Prob>Z |
|---|---|---|---|---|
|
Climbing Ladders |
97.78% | 97.80% | -0.01 | 0.54 |
|
Climbing Ramps/Stairs |
93.02% | 93.24% | -0.03 | 0.65 |
|
Communicating Verbally |
70.32% | 55.77% | 0.33 | 0 |
|
Crawling(1) |
- | - | - | - |
|
Crouching |
78.26% | 75.05% | 0.13 | 0.06 |
|
Fine Manipulation |
74.65% | 70.98% | 0.13 | 0.06 |
|
Kneeling |
83.57% | 81.12% | 0.13 | 0.04 |
|
Pushing/Pulling Hands/Arms |
50.35% | 47.58% | 0.05 | 0.15 |
|
Reaching Overhead |
68.35% | 57.01% | 0.26 | 0 |
|
Sitting |
75.00% | 49.79% | 0.5 | 0 |
|
Standing |
95.09% | 92.84% | 0.31 | 0 |
|
Stooping |
61.48% | 51.62% | 0.2 | 0.01 |
|
Wetness |
70.14% | 54.76% | 0.34 | 0 |
|
Note: Dashes indicate data not available. |
||||
| Element | PABAK | Prob>|t| |
|---|---|---|
|
Communicating Verbally |
||
|
Food prep and serving |
0.44 | 0 |
|
Automotive mechanics |
0.51 | 0 |
|
Counter attendants |
0.40 | 0.01 |
|
Landscaping workers |
0.72 | 0 |
|
Reaching Overhead |
||
|
Food prep and serving |
0.58 | 0 |
|
Automotive mechanics |
0.58 | 0 |
|
Counter attendants |
0.73 | 0 |
|
Landscaping workers |
0.63 | 0 |
|
Pushing/Pulling with Hands/Arms |
||
|
Food prep and serving |
0.51 | 0 |
|
Automotive mechanics |
0.52 | 0 |
|
Counter attendants |
0.52 | 0 |
|
Landscaping workers |
0.39 | 0.01 |
|
Standing |
||
|
Food prep and serving |
0.97 | 0 |
|
Automotive mechanics |
0.81 | 0 |
|
Counter attendants |
1.00 | - |
|
Landscaping workers |
0.51 | 0 |
|
Sitting |
||
|
Food prep and serving |
0.4 | 0 |
|
Automotive mechanics |
0.72 | 0 |
|
Counter attendants |
0.96 | 0 |
|
Landscaping workers |
0.33 | 0.02 |
|
Stooping |
||
|
Food prep and serving |
0.67 | 0 |
|
Automotive mechanics |
0.66 | 0 |
|
Counter attendants |
0.53 | 0 |
|
Landscaping workers |
0.36 | 0 |
|
Wetness |
||
|
Food prep and serving |
0.58 | 0 |
|
Automotive mechanics |
0.57 | 0 |
|
Counter attendants |
0.66 | 0.01 |
|
Landscaping workers |
0.45 | 0 |
|
Note: Dashes indicate data not available. |
||
Last Modified Date: February 26, 2019