An official website of the United States government
An official website of the United States government
The .gov means it's official.
Federal government websites often end in .gov or .mil. Before sharing sensitive information,
make sure you're on a federal government site.
The site is secure.
The
https:// ensures that you are connecting to the official website and that any
information you provide is encrypted and transmitted securely.
The Occupational Requirements Survey (ORS) is an establishment survey conducted by the Bureau of Labor Statistics (BLS) for the Social Security Administration (SSA). The survey collects information on the vocational preparation and the cognitive and physical requirements of occupations in the U.S. economy, as well as the environmental conditions in which those occupations are performed. The survey estimation process consists of multiple steps including calculation of sample weights that reflect a 2-stage stratified sampling design, adjustments for non-response at the establishment level and occupational level, adjustment for collection of data for a unit other than the assigned unit, adjustment for sample rotation, and benchmarking (post-stratification) of weights. Formulas for generating various types of ORS estimates and corresponding estimates of variances also appear in the paper.
Keywords: estimation, establishment survey, sample weights, adjustment factors, benchmarking
In the summer of 2012, the Social Security Administration (SSA) and the Bureau of Labor Statistics (BLS) signed an interagency agreement, which has been updated annually, to begin the process of testing the collection of data on occupations. As a result, the Occupational Requirements Survey [1] (ORS) was established as a test survey in late 2012. The goal of ORS is to collect and publish occupational information that will replace the outdated data currently used by SSA. More information on the background of ORS can be found in the next section. All ORS products will be made public for use by non-profits, employment agencies, state or federal agencies, the disability community, and other stakeholders.
An ORS interviewer attempts to collect close to 70 data elements (shown in appendix, table 1) related to the occupational requirements of a job. The following four groups of information will be collected:
The survey plans to publish all estimates that meet the reliability and confidentiality criteria. Somewhere between three and thirteen estimates will be calculated for each of the 70 ORS data elements. Around 700 total estimates could be calculated for a single occupation or occupational group. Estimate types include the percentage of workers in a given category, mean, percentiles (10%, 25%, 50%, 75%, and 90%), and the mode.
This paper explores the ORS estimation processes. Section 2 provides background information on the Occupational Requirements Survey. Section 3 summarizes the ORS sample design. Section 4 summarizes the ORS data elements and types of estimates that will be calculated for each. Section 5 details the process for calculating final sample weights, including the use of non-response adjustment at the unit and quote level, adjustment for collection of data for a unit other than the assigned unit, adjustment for sample rotation, and benchmarking (post-stratification) of weights. Section 6 explores the calculation of standard errors. The paper ends with a conclusion and description of further research to be completed.
In addition to providing Social Security benefits to retirees and survivors, the Social Security Administration (SSA) administers two large disability programs, which provide benefit payments to millions of beneficiaries each year. Determinations for adult disability applicants are based on a five-step process that evaluates the capabilities of workers, the requirements of their past work, and their ability to perform other work in the U.S. economy. In some cases, if an applicant is denied disability benefits, SSA policy requires adjudicators to document the decision by citing examples of jobs the claimant can still perform despite restrictions (such as limited ability to balance, stand, or carry objects) [2].
For over 50 years, the Social Security Administration has turned to the Department of Labor's Dictionary of Occupational Titles (DOT) [3] as its primary source of occupational information to process the disability claims [4]. SSA has incorporated many DOT conventions into their disability regulations. However, the DOT was last updated in its entirety in the late 1970’s, although a partial update was completed in 1991. Consequently, the SSA adjudicators who make the disability decisions must continue to refer to an increasingly outdated resource because it remains the most compatible with their statutory mandate and is the best source of data at this time.
When an applicant is denied SSA benefits, SSA must sometimes document the decision by citing examples of jobs that the claimant can still perform, despite their functional limitations. However, since the DOT has not been updated for so long, there are some jobs in the American economy that are not even represented in the DOT, and other jobs, in fact many often-cited jobs, no longer exist in large numbers in the American economy.
SSA has investigated numerous alternative data sources for the DOT, such as adapting the Employment and Training Administration’s Occupational Information Network (O*NET) [5], using the BLS Occupational Employment Statistics program (OES) [6], and developing their own survey. SSA was not successful with any of these potential data sources and turned to the National Compensation Survey [9] program at the Bureau of Labor Statistics.
The ORS sample design is a 2-stage stratified sample of establishments from the entire nation where units are selected by systematic probability proportional to employment size sampling (PPS) at each stage. Stratification is by industry and ownership, directly, and also implicitly by region. Jobs (quotes) are then sampled from the selected establishments by PPS. The frame will be developed from the BLS Quarterly Census of Employment and Wages (QCEW) database [10] with railroads added. Allocation will be proportional to employment size. ORS samples will follow a three-year rotation, though this rotation cycle may change depending on research concerning how often the requirements of work change. For more details on this design, see “Occupational Requirements Survey Sample Design” by Ferguson, et al [7].
ORS is designed to capture occupational information on educational requirements, cognitive and physical demands, and exposures to environmental conditions. An extensive description of ORS data elements and how estimates for each element will be calculated can be found in the paper “Estimation Considerations for the Occupational Requirements Survey” [8].
Many of the ORS data elements will have the percentage of workers, mean, percentiles, and modes estimates for each occupational definition. For example, one ORS data element measures the amount of time during a typical day that a worker, such as a nurse, spends stooping. Occupational definitions are derived from the Standard Occupational Classification Manual (SOC) [11]. Physical demands, such as stooping, are captured in hours, and so mean and percentile estimates (10%, 25%, 50%, 75%, and 90%) will be calculated. Also, the hours of time spent stooping will fall within an SSA-established category and so a percentage of workers estimate will be calculated for each category. SSA defines five categories by a range of hours spent performing an activity – never, seldomly, occasionally, frequently, and constantly. Finally, the mode of the categories will be identified, marking the twelfth estimate related to stooping.
Estimator type will depend on the type of data element. For any categorical data element, a percentage of workers that fall into a given category will be calculated using Formula 1. The percentage of nurses that are not required to reach overhead or the percentage of security guards that are required to have a bachelor’s degree are two examples of categories that will be estimated in ORS. A mode of these percentages will also be identified.
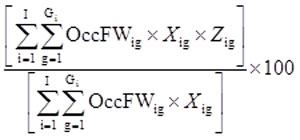
where:
For continuous data elements, mean (Formula 2) and percentile (Formula 3) estimates will be calculated. The number of hours that a teacher is required to stand in a typical day or the number of days of previous experience required for a dental hygienist are examples of continuous data elements estimated in ORS. Some continuous data are placed within pre-specified ranges, they would become categorical values, and percentages will be calculated.
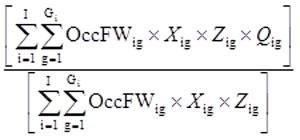
The p-th percentile is the value Qig such that
It is possible that there are no specific quotes ig for which both of these properties hold. This occurs when there exists a plan for which the OccFWig of records whose value is less than Qig equals p percent of all final quote weights. In this situation, the p-th percentile is the average of Qig and the value on the record with the next lowest value (note: the SAS proc means procedure handles this special case automatically). The Qig values must be sorted in ascending order.
Include only quotes that meet the occupational definition and the ORS data element criteria – i.e., where:
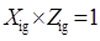
where:
The calculation of sample weights involves several steps. First, the initial weights are calculated, reflecting the two stages of sampling. Then, the initial weights are adjusted for non-response at the establishment level and occupational level. Next, factors are calculated for the collection of a unit other than the assigned unit, sample rotation, and benchmarking (post-stratification). These factors are applied to the weight that was adjusted for non-response.
Both unit and item non-response are expected to occur in the collection of the Occupational Requirements Survey. Unit non-response occurs when a sampled establishment or occupation refuses to provide any ORS data, while item non-response occurs when we obtain incomplete information for an occupation within an establishment.
ORS plans to adjust for unit non-response by re-weighting establishments and occupations within a pre-specified non-response adjustment cell. Once a weighting adjustment has been made to the establishments and occupations within a cell where a unit refused, the weights of all viable units will be further adjusted by benchmarking the weights to the current national employment to obtain the Final Occupational Quote Weight. Imputation will be used to account for item non-response, though details on this topic are being left for another paper.
Establishment Non-response Adjustment Factor
Non-response adjustment among the establishments involves adjusting the weights of the usable units, those with viable data, to account for the unusable units. The process begins by grouping the establishments into non-response cells, identifying the usable and unusable units, calculating the non-response factor, and then either accepting the factor or collapsing the cell in cases where the factor exceeds a maximum value.
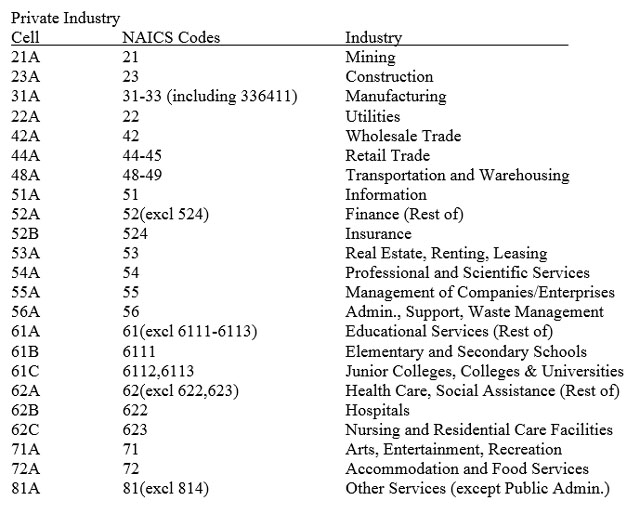
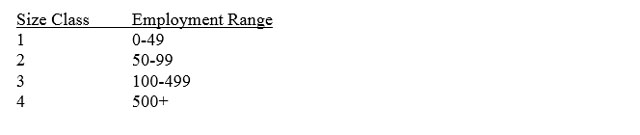
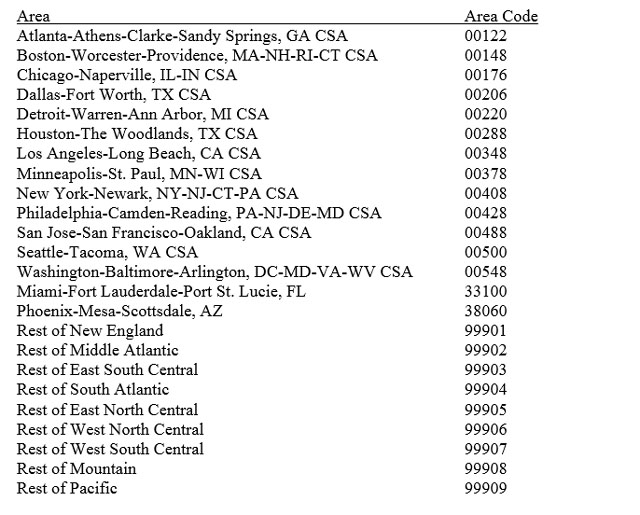
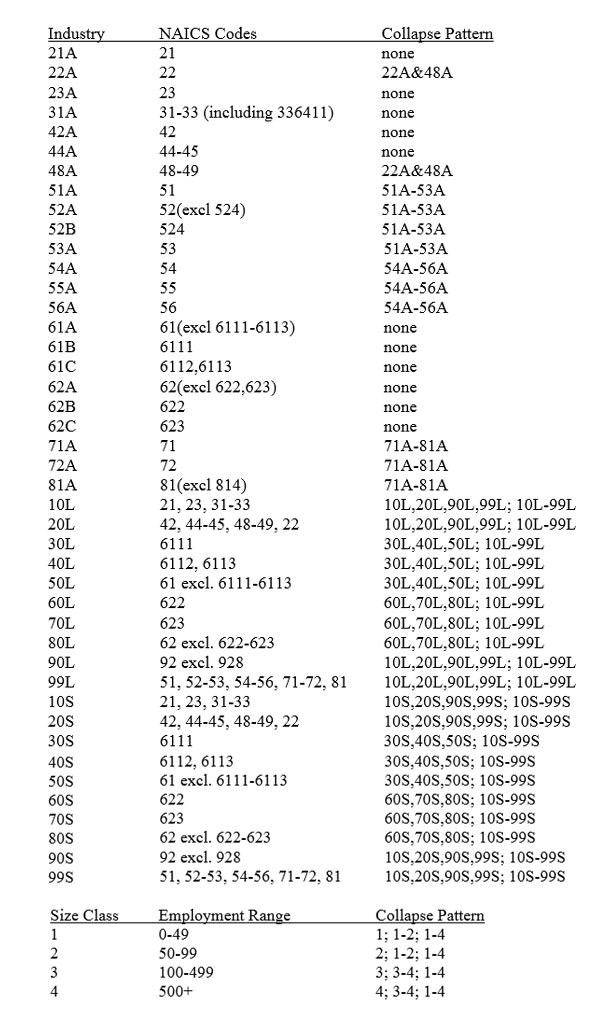
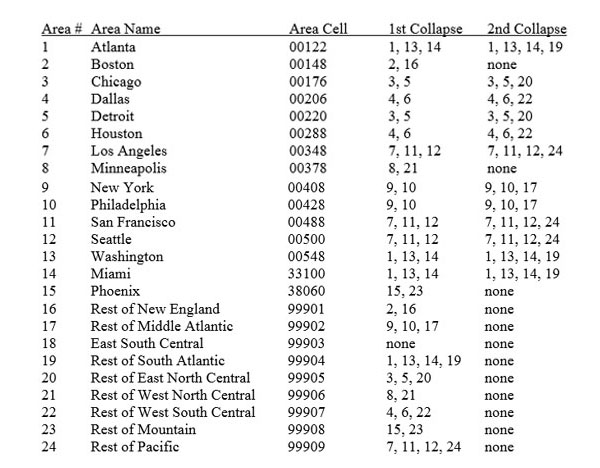
Establishment non-response cells are defined by industry, size class, and area. There are 23 detailed industries, four size classes, and twenty-four areas (see Appendix A). Cells may collapse within industry, size class, and area – that is, a single industry may collapse to a group of industries – before pieces of the cell itself are collapsed. If the cell collapses, area drops out first, then size class. Should the industry collapse pattern be exhausted, any units not adjusted for will remain unadjusted. Collapse patterns can be found in Appendix B.
Non-response cells must collapse under the following circumstances:
The formula for the non-response adjustment factor follows.
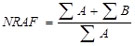
where:
Occupational Non-response Adjustment Factor
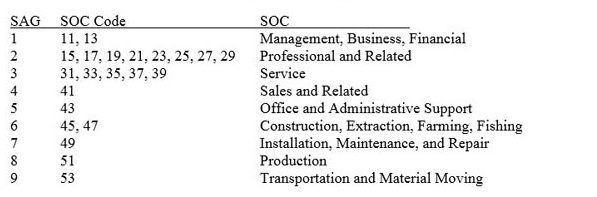
Non-response adjustment among occupations follows the same methods as establishment non-response adjustment with one difference – the definition of the non-response cell. For occupations, the non-response cell also includes an occupational group definition (see Appendix C for group definitions and collapse pattern). The occupational group is the last piece of the non-response cell to collapse.
Other Adjustment Factors
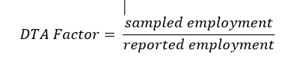
Another adjustment factor that may be calculated is the Different than Assigned Factor (DTA factor). In some cases, the collected unit’s employment differs greatly from the originally sampled unit. There are two such instances – the collected unit is something more than the originally sampled unit or the collected unit is only a piece of the originally sampled unit. These circumstances are noted by the field and, as a result, a DTA factor will be calculated and applied (the DTA factor is set to 1 otherwise). The formula is as follows.
ORS has a three-year rotation, and each year a fully representative sample will be collected. Since up to three years of data will be used in estimation, a sample group factor must be applied so that each sample group contributes an appropriate amount of the total weighted employment. Given that three equally sized samples are used in estimation, the Sample Rotation Factor for each sample will be 1/3.
There are times when a weight adjustment to an establishment or occupation does not fit into the standard non-response adjustment. Instead, a manual weight adjustment is needed. For example, there may be an ambiguous increase in employment at an establishment where a business fluctuation was noted at the same time as a merger with another company. A manual establishment (or occupational) adjustment factor will allow for such an adjustment to the weight, if necessary. If there are no adjustments, this factor is set to 1.
Benchmarking (Post-stratification) Factor
Benchmarking is the process of adjusting the weights so that the final weighted employment matches a targeted population control number. By matching to a population control number, the estimates of weighted employment will better match the employment levels in the current economy.
The process begins with defining benchmark cells, then a population control number is calculated from the product of a growth factor and the current employment levels before the benchmarking factor is calculated. The original benchmark cells are formed from sampled North American Industry Classification System (NAICS) [12] industry definitions (see Appendix A).
The population control numbers are derived from the QCEW Longitudinal Database (LDB), Railroad file, and the Current Employment Survey (CES). The LDB and Railroad file provide the employment data. Since these sources do not have current employment data, the CES is used to make an adjustment to the employment.
To calculate the employment population control numbers, first a CES Growth Factor is calculated. The CES employment is summed within each benchmark cell for the current quarter and for the reference period of the LDB data. After both sets of CES data are summed by benchmark cell, the following CES Growth Factor for each benchmark cell is calculated.
CES Growth Factor = Total Current Quarter CES Employment / Total CES Employment for the older reference period
After the CES Growth Factor has been calculated for each cell, the employment from all units in the LDB and OES Railroad file is summed for each benchmark cell. The final employment population control numbers for each cell are calculated by multiplying the total LDB (with railroad file) employment by the CES Growth Factor for the cell.
Employment control number = LDB employment * CES Growth Factor
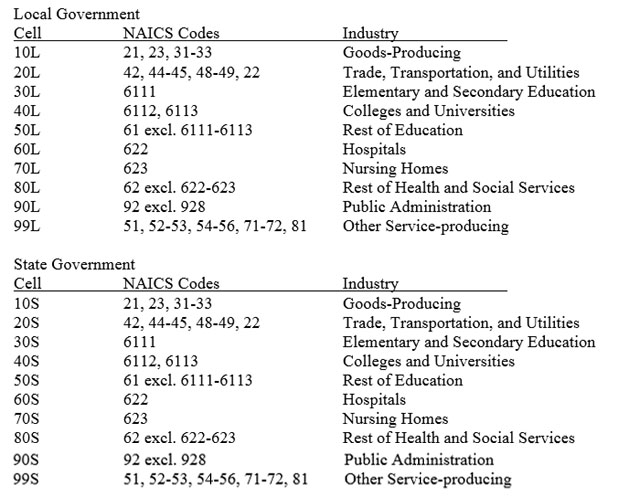
Application of the CES Growth Factor differs slightly for state and local government cells. The CES does not provide data for government at the level of detail of the benchmark cells. The government CES Growth Factors are calculated as described above but are applied to more broadly defined industries. See Appendix A for the details.
During the benchmark process, it may be necessary to collapse benchmark cells and combine the observations into a larger cell. Cell collapsing is the process of combining the contents of multiple benchmark cells to form a new and larger cell. It is necessary to collapse cells when the number of establishments does not reach a minimum threshold or if the benchmarking factor reaches a maximum value. Collapse patterns define how the cells should be collapsed. See Appendix B for collapse patterns.
The original benchmark cells are collapsed as necessary to achieve the minimum number of establishments per cell. Then, for each collapsed benchmark cell, calculate the total weighted employment.

where:
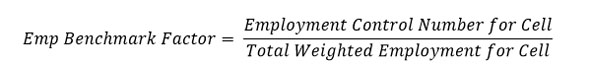
Next, the employment benchmark factors are calculated for each cell by dividing the employment control number for the cell, calculated in Formula 7, by the total weighted employment derived using Formula 8.
If the employment benchmark factor is less than or equal to the maximum value, then the employment benchmark factor calculation is complete. If the population control number for a cell is 0, then the benchmark factor for the cell is set equal to 1 (A cell with a population control number equal to 0 is not collapsed with other cells.) If the factor is greater than the maximum value, the benchmark cells will collapse to the next level in the collapse pattern and the benchmark factor will be re-calculated for the new cell.
In circumstances for which the benchmark factor is still greater than the maximum value, the process of collapsing cells and calculating benchmark factors continues until all benchmark factors are less than or equal to the maximum value or the collapse patterns are exhausted.
If the collapse patterns are exhausted, and the factor is still greater than the maximum value or if the minimum number of establishments was never met, the value of the benchmark factor will be set to the maximum value for all establishments and occupations in the final cell.
The final quote weight - the weight that represents each sampled occupation in estimation - is the product of the sampling weight and all adjustment factors, shown below in Formula 10.
Final Occupational Quote Weight (OccFWig) = Sample Weight * Establishment Non-response Adjustment Factor * Occupational Non-response Adjustment Factor * Sample Rotation Factor * DTA Factor * Manual Adjustment Factors * Employment Benchmark Factor
ORS will provide standard errors for all percentages, means, and percentiles using a modified version of the Balanced Repeated Replication (BRR) method, known as the Fay’s BRR method. Using Fay’s BRR for variance calculation is a process of several steps. First, variance strata are defined and half-samples are constructed within each of the variance strata definitions. The method requires that the number of replicates be a multiple of four and be at least equal to or greater than the number of variance strata. The ORS sample design specifies 23 detailed industry strata in the private sector and 10 industry strata in the government sector, plus 4 regions, making for 132 variance strata. So, the number of replicates to be used in the calculation of variances will be 132.
A Hadamard Matrix helps construct the replicate half-samples by increasing or decreasing the occupational replicate weight based on the variance strata selection flag. All usable quotes were assigned a selection flag during sampling and will appear in each replicate half-sample with an appropriate weight adjustment.
Once the replicate half-samples are established and the occupational replicate weights have been adjusted, estimation is run for each of the 132 replicate half-samples. Variances are calculated for each estimate, using the sum of the differences between the full sample estimate and each of the 132 replicate estimates. The full sample estimates were calculated using the original, unadjusted weights. The variance formula is as follows:

where:
 c) = Variance estimate for estimate of ORS data element c
cr = Estimate for replicate r for ORS data element c
c = Estimate for the full sample for ORS data element c
c) = Variance estimate for estimate of ORS data element c
cr = Estimate for replicate r for ORS data element c
c = Estimate for the full sample for ORS data element cStandard errors are simply the square root of the variance. Relative standard errors are also calculated using the following formula:

where:
c) = Variance estimate for estimate of ORS data element c
c = Estimate for the full sample for ORS data element cA significance test will be run to measure the strength of each mode, determining whether the stated mode is significantly different from all of the other possible mode values. A flag will indicate whether the mode is significantly different and, therefore, considered a "strong" mode.
ORS will use a few re-weighting methods to account for unit non-response. Weight adjustments will occur at both the establishment and occupational level. Four types of factors will be calculated: non-response adjustment factors, employment different than assigned adjustment factors, manual adjustment factors, and benchmarking (post-stratification) factors.
Non-response adjustment factors will be calculated for cells that contain non-responding units. The weight of responding units will increase to account for the weight of non-responding units. Collapsing of the cell will occur if no responding units can be found in the cell, or if the non-response adjustment factor exceeds a pre-determined maximum value. These factors will be calculated for both establishments and occupations.
A different than assigned (DTA) factor will be calculated for all establishments. This factor adjusts for differences in the assigned sample unit compared with the collected sample unit. There are two ways this could happen: an establishment could be collected with employment larger than assigned or it could be collected with employment less than assigned. In either case, a weight adjustment will be made to account for the difference in employment.
Manual adjustment factors are calculated when an adjustment needs to be made but such an adjustment does not fit within the non-response adjustment factor or DTA factor. In these circumstances, a special factor is calculated manually. Such a factor could be calculated for establishments or occupations.
Benchmarking factors ensure that the final weighted employment matches the current employment in the economy. For this process, a ratio will be calculated comparing the frame employment at the time of sampling to employment currently found in the economy. Benchmarking factors are applied to all weights that are used in the estimation process.
ORS will provide a measure of accuracy for every estimate produced. For means, percentages, and percentiles, a standard error will be calculated using Fay’s BRR method. For modes, a significance test will be performed to determine if the mode is significantly different from the other possible values.
ORS plans to adjust for item non-response by using imputation methods or providing estimates for missing or unknown responses. Methods are currently being investigated. Testing began in the spring of 2015 and is ongoing. Results will be presented in a future paper.
| [1] | Occupational Requirements Survey, www.bls.gov/ors/. |
| [2] | Social Security Administration, Occupational Information System Project, www.ssa.gov/disabilityresearch/occupational_info_systems.html.. |
| [3] | U.S. Department of Labor, Employment and Training Administration (1991), “Dictionary of Occupational Titles, Fourth Edition, Revised 1991” |
| [4] | Occupational Information Development Advisory Panel, 2010, www.ssa.gov/oidap/ |
| [5] | U.S. Department of Labor, O*Net Online, www.onetonline.org/ |
| [6] | Bureau of Labor Statistics, Occupational Employment Statistics Program, www.bls.gov/oes/ |
| [7] | Ferguson, Gwyn R., McNulty, Erin. 2015. Occupational Requirements Survey Sample Design. In JSM proceedings, Economic Data: CPI, PPI, NCS Section. Alexandria, VA: American Statistical Association. |
| [8] | Rhein, Brad, Ponikowski, Chester, and McNulty, Erin. 2014. Estimation Considerations for the Occupational Requirements Survey. In JSM proceedings, Government Statistics Section. Alexandria, VA: American Statistical Association. 2134-2146. |
| [9] | National Compensation Survey, www.bls.gov/ncs. |
| [10] | Quarterly Census of Employment and Wages, www.bls.gov/cew. |
| [11] | Standard Occupational Classification System, www.bls.gov/soc. |
| [12] | North American Industry Classification System, www.census.gov/eos/www/naics/. |
Any opinions expressed in this paper are those of the authors and do not constitute policy of the Bureau of Labor Statistics or the Social Security Administration.