An official website of the United States government
An official website of the United States government
The .gov means it's official.
Federal government websites often end in .gov or .mil. Before sharing sensitive information,
make sure you're on a federal government site.
The site is secure.
The
https:// ensures that you are connecting to the official website and that any
information you provide is encrypted and transmitted securely.
25-1226-PHI
Wednesday, July 30, 2025
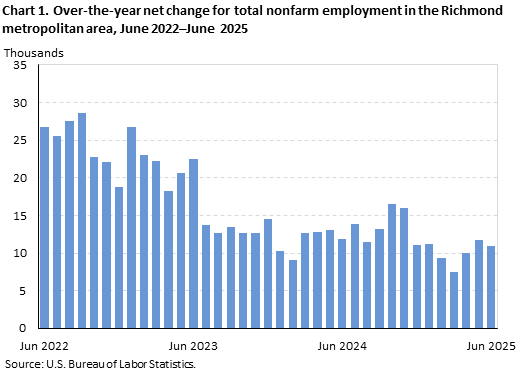
Total nonfarm employment for the Richmond, VA, metropolitan area stood at 734,700 in June, the U.S. Bureau of Labor Statistics reported today. (See chart 1 and table 1.) Regional Commissioner Alexandra Hall Bovee noted that while employment levels in Richmond were little changed over the year, the national rate of job gain was 1.1 percent. (All data in this release are not seasonally adjusted; accordingly, over-the-year analysis is used throughout.)
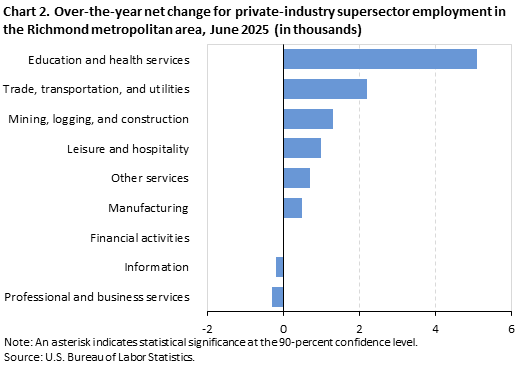
Industry employmentIn Richmond, VA, little changed over the year among the metropolitan area’s private-industry supersectors. (See chart 2.) Education and health services employment stood at 111,400 in June. Trade, transportation and utilities employment stood at 134,000.
The Metropolitan Area Employment and Unemployment news release for July 2025 is scheduled to be released on Wednesday, August 27, 2025, at 10:00 a.m. (ET).
Each year, Current Employment Statistics (CES) estimates are benchmarked to comprehensive counts of employment from the Quarterly Census of Employment and Wages (QCEW). These counts are derived from state unemployment insurance (UI) tax records that nearly all employers are required to file. As part of the benchmark process for benchmark year 2025, census-derived employment counts replace CES payroll employment estimates for all 50 states, the District of Columbia, Puerto Rico, the U.S. Virgin Islands, and about 430 metropolitan areas and divisions for the period from April 2024 to September 2025.
The Bureau of Labor Statistics (BLS) will release first-quarter 2025 data from the QCEW on September 9, 2025, at 10:00 a.m. (ET). At the same time, BLS will publish preliminary benchmark revisions for March 2025 for all 50 states, the District of Columbia, and selected metropolitan areas at the total nonfarm level. The final benchmark revisions for all state and metropolitan area series will be issued with the publication of the January 2026 State Employment and Unemployment news release in March 2026.
This release presents nonfarm payroll employment estimates from the CES program. More information about the CES data is available in the State Employment and Unemployment Summary and the Metropolitan Area Employment and Unemployment Summary. See the Metropolitan Area Employment and Unemployment Technical Note for more information on definitions and methodology.
Reliability of the employment estimates. The estimates presented in this release are based on sample surveys, administrative data, and modeling and, thus, are subject to sampling and other types of errors. Changes in metropolitan area nonfarm payroll employment are cited in the analysis of this release only if they have been determined to be statistically significant at the 90-percent confidence level. Documentation on the reliability of state and area estimates is available for metropolitan areas and metropolitan divisions.
Area definitions. The substate area data published in this news release reflect the U.S. Office of Management and Budget delineations issued on July 21, 2023.
The Richmond, VA Metropolitan Statistical Area includes Amelia, Charles City, Chesterfield, Dinwiddie, Goochland, Hanover, Henrico, King and Queen, King William, New Kent, Powhatan, Prince George, and Sussex Counties and Colonial Heights, Hopewell, Petersburg, and Richmond cities in Virginia.
Additional information
State and area employment data from the CES program are available on the BLS website.
Information in this release will be made available to individuals with sensory impairments upon request. Voice phone: (202) 691-5200; Telecommunications Relay Service: 7-1-1.
| Area | Back data |
Jun 2024 |
Apr 2025 |
May 2025 |
Jun 2025(p) |
Jun 2024 to Jun 2025(p) |
|
|---|---|---|---|---|---|---|---|
| Net change |
Percent change |
||||||
|
United States(1) |
|||||||
|
Total nonfarm |
|
158,722 | 159,227 | 159,958 | 160,475 | 1,753 | 1.1 |
|
Mining and logging |
|
627 | 622 | 623 | 624 | -3 | -0.5 |
|
Construction |
|
8,378 | 8,214 | 8,352 | 8,492 | 114 | 1.4 |
|
Manufacturing |
|
12,908 | 12,717 | 12,738 | 12,816 | -92 | -0.7 |
|
Trade, transportation, and utilities |
|
28,914 | 28,848 | 28,949 | 29,079 | 165 | 0.6 |
|
Information |
|
2,967 | 2,920 | 2,934 | 2,961 | -6 | -0.2 |
|
Financial activities |
|
9,200 | 9,190 | 9,224 | 9,290 | 90 | 1.0 |
|
Professional and business services |
|
22,741 | 22,575 | 22,633 | 22,715 | -26 | -0.1 |
|
Education and health services |
|
26,265 | 27,333 | 27,289 | 27,131 | 866 | 3.3 |
|
Leisure and hospitality |
|
17,488 | 16,859 | 17,307 | 17,732 | 244 | 1.4 |
|
Other services |
|
6,049 | 6,021 | 6,063 | 6,107 | 58 | 1.0 |
|
Government |
|
23,185 | 23,928 | 23,846 | 23,528 | 343 | 1.5 |
|
Richmond Metropolitan Statistical Area |
|||||||
|
Total Nonfarm |
|
723.8 | 725.6 | 731.0 | 734.7 | 10.9 | 1.5 |
|
Mining, logging, & construction |
|
43.3 | 43.3 | 43.6 | 44.6 | 1.3 | 3.0 |
|
Manufacturing |
|
32.1 | 32.3 | 32.5 | 32.6 | 0.5 | 1.6 |
|
Trade, transportation, & utilities |
|
131.8 | 132.4 | 133.5 | 134.0 | 2.2 | 1.7 |
|
Information |
|
6.6 | 6.3 | 6.3 | 6.4 | -0.2 | -3.0 |
|
Financial activities |
|
58.0 | 58.1 | 57.5 | 58.0 | 0.0 | 0.0 |
|
Professional & business services |
|
125.5 | 123.7 | 124.7 | 125.2 | -0.3 | -0.2 |
|
Educational & health services |
|
106.3 | 110.8 | 112.4 | 111.4 | 5.1 | 4.8 |
|
Leisure & hospitality |
|
73.0 | 70.2 | 72.3 | 74.0 | 1.0 | 1.4 |
|
Other services |
|
33.4 | 33.3 | 33.6 | 34.1 | 0.7 | 2.1 |
|
Government |
|
113.8 | 115.2 | 114.6 | 114.4 | 0.6 | 0.5 |
|
Footnotes |
|||||||
|
SOURCE: Current Employment Statistics - National - State and Metropolitan Area |
|||||||
Last Modified Date: Wednesday, July 30, 2025