An official website of the United States government
An official website of the United States government
The .gov means it's official.
Federal government websites often end in .gov or .mil. Before sharing sensitive information,
make sure you're on a federal government site.
The site is secure.
The
https:// ensures that you are connecting to the official website and that any
information you provide is encrypted and transmitted securely.
26-1181-PHI
Friday, July 10, 2026
Workers in the Virginia Beach-Chesapeake-Norfolk, VA-NC Metropolitan Statistical Area had an average (mean) hourly wage of $30.83 in May 2025, compared to the nationwide average of $33.54, the U.S. Bureau of Labor Statistics reported today. Regional Commissioner Lori Keller noted that higher paying major occupational groups included management ($62.45), legal ($55.01), and computer and mathematical ($53.65). Lower paying occupations included food preparation and serving related ($17.57), building and grounds cleaning and maintenance ($17.84), and personal care and service ($17.87). (See table A.)
Occupational groups with the highest employment shares in the Virginia Beach area included office and administrative support (10.5 percent), food preparation and serving related (9.8 percent), and transportation and material moving (8.8 percent). Major occupational groups on the lower end of local employment included legal (0.6 percent); life, physical, and social science (0.9 percent); and arts, design, entertainment, sports, and media (1.2 percent).
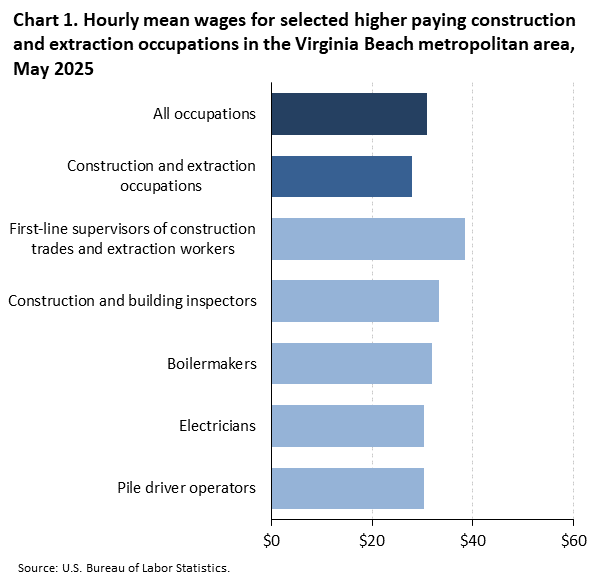
One occupational group—construction and extraction—was chosen to illustrate the diversity of data available for any of the 22 major occupational categories. Virginia Beach had 41,190 jobs in construction and extraction, accounting for 5.4 percent of local area employment, compared to the 4.1-percent share nationally. The average hourly wage for this occupational group locally was $27.87, compared to the national wage of $31.42.
Some of the larger detailed occupations within the construction and extraction group included first-line supervisors of construction trades and extraction workers (6,140), electricians (5,740), and construction laborers (5,660). Among the higher paying jobs in this group were first-line supervisors of construction trades and extraction workers ($38.39) and construction and building inspectors ($33.27). (See chart1.) At the lower end of the wage scale were helpers--pipelayers, plumbers, pipefitters, and steamfitters ($17.93) and helpers--painters, paperhangers, plasterers, and stucco masons ($18.78). (Detailed data for the construction and extraction occupations are presented in table 1; for a complete listing of detailed occupations available go to data.bls.gov/oes/#/area/0047260/2025.)
Location quotients allow us to explore the occupational make-up of a metropolitan area by comparing the composition of jobs in an area relative to the national average. (See table 1.) For example, a location quotient of 2.00 indicates that an occupation accounts for twice the share of employment in the area than it does nationally. In the Virginia Beach area, above-average concentrations of employment were found in some of the occupations within the construction and extraction group. For instance, mechanical insulation workers were employed at 5.43 times the national rate in Virginia Beach, and sheet metal workers, at 3.54 times the U.S. average. Construction laborers had a location quotient of 1.05 in Virginia Beach, indicating that this particular occupation’s local and national employment shares were similar.
The statistics in this release are from the Occupational Employment and Wage Statistics (OEWS) survey, a cooperative effort between BLS and the State Workforce Agencies (SWAs). BLS funds the survey and provides the procedures and technical support. State Workforce Agencies collect most of the data: in this case, Virginia Works, and the North Carolina Department of Commerce.
Because of the lapse in federal appropriations from October 1 through November 12, 2025, additional collection and processing time were required for the May 2025 OEWS survey panel once appropriations resumed. The response rate for the May 2025 survey panel was within the normal range and no additional modifications to the OEWS methodology and procedures were necessary as a result of the shutdown.
The Occupational Employment and Wage Statistics (OEWS) survey is a semiannual survey measuring occupational employment and wage rates for wage and salary workers in nonfarm establishments in the United States. The OEWS data available from BLS include cross-industry occupational employment and wage estimates for the nation; over 530 areas, including states and the District of Columbia, metropolitan statistical areas (MSAs), nonmetropolitan areas, and territories; national industry-specific estimates at the NAICS sector, 3-digit, most 4-digit, and selected 5- and 6-digit industry levels; and national estimates by ownership across all industries and for schools and hospitals. Full OEWS data tables are available online.
Additional information about the OEWS estimates and methodology is available in the national Technical Notes. The overall national response rate for the six panels, based on the 50 states and the District of Columbia, is 66.2 percent based on establishments and 67.2 percent based on weighted sampled employment. Sample sizes and response rates by metropolitan and nonmetropolitan area are available on the Additional OEWS data sets page.
Metropolitan area definitions
The substate area data published in this release reflect the standards and definitions established by the U.S. Office of Management and Budget.
The Virginia Beach-Chesapeake-Norfolk, VA-NC Metropolitan Statistical Area includes Camden County, NC; Currituck County, NC; Gates County, NC; Gloucester County, VA; Isle of Wight County, VA; James City County, VA; Mathews County, VA; Surry County, VA; York County, VA; Chesapeake city, VA; Hampton city, VA; Newport News city, VA; Norfolk city, VA; Poquoson city, VA; Portsmouth city, VA; Suffolk city, VA; Virginia Beach city, VA; and Williamsburg city, VA..
For more information
Answers to frequently asked questions about the OEWS data, as well as general program documentation, are available on the OEWS website.
If you are deaf, hard of hearing, or have a speech disability, please dial 7-1-1 to access telecommunications relay services.
| Occupation (1) | Employment | Mean wages ($) | ||
|---|---|---|---|---|
| Level (2) | Location quotient (3) | Hourly | Annual (4) | |
|
Construction and extraction occupations |
41,190 | 1.31 | 27.87 | 57,970 |
|
First-line supervisors of construction trades and extraction workers |
6,140 | 1.54 | 38.39 | 79,840 |
|
Boilermakers |
90 | 1.83 | 31.93 | 66,400 |
|
Brickmasons and blockmasons |
400 | 1.54 | 24.85 | 51,690 |
|
Carpenters |
4,020 | 1.22 | 26.13 | 54,350 |
|
Floor layers, except carpet, wood, and hard tiles |
50 | 0.41 | 24.24 | 50,420 |
|
Tile and stone setters |
160 | 0.91 | 21.65 | 45,040 |
|
Cement masons and concrete finishers |
790 | 0.78 | 24.47 | 50,890 |
|
Construction laborers |
5,660 | 1.05 | 19.65 | 40,870 |
|
Paving, surfacing, and tamping equipment operators |
340 | 1.66 | 22.46 | 46,710 |
|
Pile driver operators |
70 | 5.87 | 30.27 | 62,960 |
|
Operating engineers and other construction equipment operators |
2,150 | 0.91 | 26.48 | 55,080 |
|
Drywall and ceiling tile installers |
270 | 0.67 | 24.33 | 50,600 |
|
Electricians |
5,740 | 1.54 | 30.30 | 63,030 |
|
Glaziers |
140 | 0.48 | 26.49 | 55,100 |
|
Insulation workers, floor, ceiling, and wall |
160 | 0.75 | 21.61 | 44,960 |
|
Insulation workers, mechanical |
680 | 5.43 | (5) | (5) |
|
Painters, construction and maintenance |
1,610 | 1.45 | 24.13 | 50,180 |
|
Pipelayers |
260 | 1.57 | 23.57 | 49,020 |
|
Plumbers, pipefitters, and steamfitters |
5,100 | 2.23 | 28.50 | 59,280 |
|
Roofers |
350 | 0.53 | 22.82 | 47,470 |
|
Sheet metal workers |
2,080 | 3.54 | 28.17 | 58,580 |
|
Structural iron and steel workers |
700 | 2.09 | 28.22 | 58,700 |
|
Solar photovoltaic installers |
(5) | (5) | 24.42 | 50,800 |
|
Helpers--brickmasons, blockmasons, stonemasons, and tile and marble setters |
80 | 1.20 | 19.35 | 40,250 |
|
Helpers--carpenters |
180 | 1.71 | 20.37 | 42,360 |
|
Helpers--electricians |
450 | 1.43 | 21.95 | 45,660 |
|
Helpers--painters, paperhangers, plasterers, and stucco masons |
80 | 2.07 | 18.78 | 39,050 |
|
Helpers--pipelayers, plumbers, pipefitters, and steamfitters |
380 | 1.74 | 17.93 | 37,290 |
|
Helpers, construction trades, all other |
120 | 0.98 | 19.16 | 39,840 |
|
Construction and building inspectors |
1,260 | 1.75 | 33.27 | 69,210 |
|
Hazardous materials removal workers |
200 | 0.80 | 23.84 | 49,590 |
|
Highway maintenance workers |
270 | 0.36 | 23.33 | 48,530 |
|
Septic tank servicers and sewer pipe cleaners |
290 | 1.92 | 22.43 | 46,640 |
|
Miscellaneous construction and related workers |
120 | 0.83 | 25.52 | 53,070 |
|
Excavating and loading machine and dragline operators, surface mining |
80 | 0.50 | 26.04 | 54,170 |
|
Earth drillers, except oil and gas |
70 | 0.77 | 27.65 | 57,510 |
|
Footnotes: |
||||
Last Modified Date: Friday, July 10, 2026