An official website of the United States government
An official website of the United States government
The .gov means it's official.
Federal government websites often end in .gov or .mil. Before sharing sensitive information,
make sure you're on a federal government site.
The site is secure.
The
https:// ensures that you are connecting to the official website and that any
information you provide is encrypted and transmitted securely.
22-1217-BOS
Tuesday, June 14, 2022
Workers in the Boston-Cambridge-Nashua, MA-NH Metropolitan Statistical Area had an average (mean) hourly wage of $36.95 in May 2021, 32 percent above the nationwide average of $28.01, the U.S. Bureau of Labor Statistics reported today. Regional Commissioner William J. Sibley noted that, after testing for statistical significance, wages in the local area were higher than their respective national averages in all of the 22 major occupational groups.
When compared to the nationwide distribution, Boston area employment was more highly concentrated in 11 of the 22 occupational groups, including management, computer and mathematical, and business and financial operations. Ten groups had employment shares significantly below their national representation, including transportation and material moving, production, and food preparation and serving related. (See table A.)
| Major occupational group | Percent of total employment | Mean hourly wage | |||
|---|---|---|---|---|---|
| United States | Boston | United States | Boston | Percent difference (1) | |
Total, all occupations | 100.0 | 100.0 | $28.01 | $36.95* | 32 |
Management | 6.3 | 10.2* | 59.31 | 72.24* | 22 |
Business and financial operations | 6.4 | 8.1* | 39.72 | 46.27* | 16 |
Computer and mathematical | 3.3 | 5.1* | 48.01 | 54.94* | 14 |
Architecture and engineering | 1.7 | 2.3* | 44.10 | 48.89* | 11 |
Life, physical, and social science | 0.9 | 1.8* | 38.81 | 49.76* | 28 |
Community and social service | 1.6 | 2.0* | 25.94 | 27.44* | 6 |
Legal | 0.8 | 1.0* | 54.38 | 66.35* | 22 |
Educational instruction and library | 5.8 | 6.4* | 29.88 | 37.03* | 24 |
Arts, design, entertainment, sports, and media | 1.3 | 1.4* | 31.78 | 36.33* | 14 |
Healthcare practitioners and technical | 6.2 | 7.0* | 43.80 | 51.66* | 18 |
Healthcare support | 4.7 | 4.7 | 16.02 | 18.79* | 17 |
Protective service | 2.4 | 2.3* | 25.68 | 30.47* | 19 |
Food preparation and serving related | 8.0 | 6.5* | 14.16 | 17.40* | 23 |
Building and grounds cleaning and maintenance | 2.9 | 2.7* | 16.23 | 20.76* | 28 |
Personal care and service | 1.8 | 1.9* | 16.17 | 19.77* | 22 |
Sales and related | 9.4 | 8.4* | 22.15 | 27.77* | 25 |
Office and administrative support | 13.0 | 11.8* | 20.88 | 25.14* | 20 |
Farming, fishing, and forestry | 0.3 | (2)* | 16.70 | 18.98* | 14 |
Construction and extraction | 4.2 | 3.6* | 26.87 | 35.11* | 31 |
Installation, maintenance, and repair | 4.0 | 2.8* | 25.66 | 30.59* | 19 |
Production | 6.0 | 3.9* | 20.71 | 23.27* | 12 |
Transportation and material moving | 9.0 | 6.0* | 19.88 | 21.44* | 8 |
Footnotes: | |||||
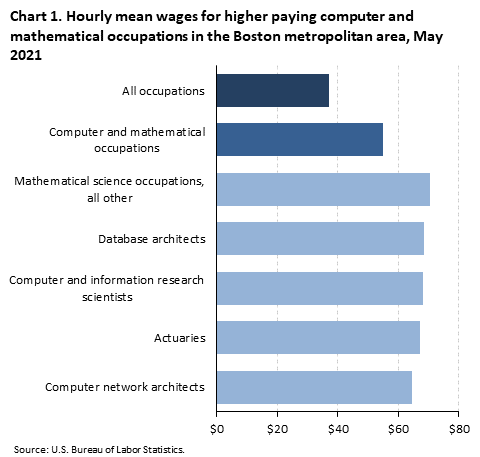
One occupational group—computer and mathematical—was chosen to illustrate the diversity of data available for any of the 22 major occupational categories. Boston had 131,990 jobs in computer and mathematical, accounting for 5.1 percent of local area employment, significantly higher than the 3.3-percent share nationally. The average hourly wage for this occupational group locally was $54.94, significantly above the national wage of $48.01.
Some of the larger detailed occupations within the computer and mathematical group included software developers (55,690), computer user support specialists (13,960), and computer systems analysts (12,500). Among the higher-paying jobs in this group were database architects and computer and information research scientists, with mean hourly wages of $68.65 and $68.22, respectively. At the lower end of the wage scale were computer user support specialists ($34.64) and web and digital interface designers ($40.27). (See chart 1.) (Detailed data for the computer and mathematical occupations are presented in table 1; for a complete listing of detailed occupations available go to www.bls.gov/oes/current/oes_71650.htm.)
Location quotients allow us to explore the occupational make-up of a metropolitan area by comparing the composition of jobs in an area relative to the national average. (See table 1.) For example, a location quotient of 2.0 indicates that an occupation accounts for twice the share of employment in the area than it does nationally. In the Boston area, above-average concentrations of employment were found in many of the occupations within the computer and mathematical group. For instance, software developers were employed at 2.2 times the national rate in Boston, and computer network architects, at 1.7 times the U.S. average. Network and computer systems administrators had a location quotient of 1.1 in Boston, indicating that this particular occupation’s local and national employment shares were similar.
These statistics are from the Occupational Employment and Wage Statistics (OEWS) survey, a federal-state cooperative program between BLS and State Workforce Agencies, in this case, the Massachusetts Department of Economic Research and the New Hampshire Department of Employment Security.
With the May 2021 estimates release, the Occupational Employment and Wage Statistics (OEWS) program has implemented a new model-based (MB3) estimation method. For more information, see the May 2021 Survey Methods and Reliability Statement at www.bls.gov/oes/methods_21.pdf and the Monthly Labor Review article at www.bls.gov/opub/mlr/2019/article/model-based-estimates-for-the-occupational-employment-statistics-program.htm. OEWS estimates for the years 2015-19 were recalculated using the new estimation method and are available as research estimates at www.bls.gov/oes/oes-mb3-methods.htm.
The May 2021 OEWS estimates are also the first estimates based entirely on survey data collected using the 2018 Standard Occupational Classification (SOC) system. To improve data quality, the OEWS program aggregates some occupations to the SOC broad occupation level or as OEWS-specific combinations of 2018 SOC detailed occupations.
The Occupational Employment and Wage Statistics (OEWS) survey is a semiannual survey measuring occupational employment and wage rates for wage and salary workers in nonfarm establishments in the United States. The OEWS data available from BLS include cross-industry occupational employment and wage estimates for the nation; over 580 areas, including states and the District of Columbia, metropolitan statistical areas (MSAs), nonmetropolitan areas, and territories; national industry-specific estimates at the NAICS sector, 3-digit, most 4-digit, and selected 5- and 6-digit industry levels; and national estimates by ownership across all industries and for schools and hospitals. OEWS data are available at www.bls.gov/oes/tables.htm.
The OEWS survey is a cooperative effort between BLS and the State Workforce Agencies (SWAs). BLS funds the survey and provides the procedures and technical support, while the State Workforce Agencies collect most of the data. OEWS estimates are constructed from a sample of about 1.1 million establishments. Each year, two semiannual panels of approximately 179,000 to 187,000 sampled establishments are contacted, one panel in May and the other in November. Responses are obtained by Internet or other electronic means, mail, email, telephone, or personal visit. The May 2021 estimates are based on responses from six semiannual panels collected over a 3-year period: May 2021, November 2020, May 2020, November 2019, May 2019, and November 2018. The unweighted sampled employment of 82 million across all six semiannual panels represents approximately 62 percent of total national employment. The overall national response rate for the six panels, based on the 50 states and the District of Columbia, is 67.2 percent based on establishments and 64.5 percent based on weighted sampled employment. The sample in the Boston-Cambridge-Nashua, MA-NH Metropolitan Statistical Area included 14,159 establishments with a response rate of 64 percent. For more information about OEWS concepts and methodology, go to www.bls.gov/oes/current/oes_tec.htm.
A value that is statistically different from another does not necessarily mean that the difference has economic or practical significance. Statistical significance is concerned with the ability to make confident statements about a universe based on a sample. It is entirely possible that a large difference between two values is not significantly different statistically, while a small difference is, since both the size and heterogeneity of the sample affect the relative error of the data being tested.
Metropolitan area definitions
The substate area data published in this release reflect the standards and definitions established by the U.S. Office of Management and Budget.
The Boston-Cambridge-Nashua, MA-NH Metropolitan Statistical Area includes Abington town, MA; Acton town, MA; Amesbury town, MA; Andover town, MA; Arlington town, MA; Ashby town, MA; Ashland town, MA; Avon town, MA; Ayer town, MA; Bedford town, MA; Belmont town, MA; Berkley town, MA; Berlin town, MA; Beverly city, MA; Billerica town, MA; Bolton town, MA; Boston city, MA; Boxborough town, MA; Boxford town, MA; Braintree town, MA; Bridgewater town, MA; Brockton city, MA; Brookline town, MA; Burlington town, MA; Cambridge city, MA; Canton town, MA; Carlisle town, MA; Carver town, MA; Chelmsford town, MA; Chelsea city, MA; Cohasset town, MA; Concord town, MA; Danvers town, MA; Dedham town, MA; Dighton town, MA; Dover town, MA; Dracut town, MA; Dunstable town, MA; Duxbury town, MA; East Bridgewater town, MA; Easton town, MA; Essex town, MA; Everett city, MA; Foxborough town, MA; Framingham town, MA; Franklin city, MA; Freetown town, MA; Georgetown town, MA; Gloucester city, MA; Groton town, MA; Groveland town, MA; Halifax town, MA; Hamilton town, MA; Hanover town, MA; Hanson town, MA; Harvard town, MA; Haverhill city, MA; Hingham town, MA; Holbrook town, MA; Holliston town, MA; Hopedale town, MA; Hopkinton town, MA; Hudson town, MA; Hull town, MA; Ipswich town, MA; Kingston town, MA; Lakeville town, MA; Lawrence city, MA; Lexington town, MA; Lincoln town, MA; Littleton town, MA; Lowell city, MA; Lynn city, MA; Lynnfield town, MA; Malden city, MA; Manchester by the Sea town, MA; Mansfield town, MA; Marblehead town, MA; Marlborough city, MA; Marshfield town, MA; Maynard town, MA; Medfield town, MA; Medford city, MA; Medway town, MA; Melrose city, MA; Mendon town, MA; Merrimac town, MA; Methuen city, MA; Middleborough town, MA; Middleton town, MA; Milford town, MA; Millis town, MA; Milton town, MA; Nahant town, MA; Natick town, MA; Needham town, MA; Newbury town, MA; Newburyport city, MA; Newton city, MA; Norfolk town, MA; North Andover town, MA; North Reading town, MA; Norton town, MA; Norwell town, MA; Norwood town, MA; Peabody city, MA; Pembroke town, MA; Pepperell town, MA; Plymouth town, MA; Plympton town, MA; Quincy city, MA; Randolph town, MA; Raynham town, MA; Reading town, MA; Revere city, MA; Rochester town, MA; Rockland town, MA; Rockport town, MA; Rowley town, MA; Salem city, MA; Salisbury town, MA; Saugus town, MA; Scituate town, MA; Sharon town, MA; Sherborn town, MA; Shirley town, MA; Somerville city, MA; Southborough town, MA; Stoneham town, MA; Stoughton town, MA; Stow town, MA; Sudbury town, MA; Swampscott town, MA; Taunton city, MA; Tewksbury town, MA; Topsfield town, MA; Townsend town, MA; Tyngsborough town, MA; Wakefield town, MA; Walpole town, MA; Waltham city, MA; Watertown city, MA; Wayland town, MA; Wellesley town, MA; Wenham town, MA; West Bridgewater town, MA; West Newbury town, MA; Westford town, MA; Weston town, MA; Westwood town, MA; Weymouth town, MA; Whitman town, MA; Wilmington town, MA; Winchester town, MA; Winthrop town, MA; Woburn city, MA; Wrentham town, MA; Amherst town, NH; Atkinson town, NH; Brookline town, NH; Chester town, NH; Danville town, NH; Derry town, NH; East Kingston town, NH; Fremont town, NH; Greenfield town, NH; Greenville town, NH; Hampstead town, NH; Hampton Falls town, NH; Hollis town, NH; Hudson town, NH; Kensington town, NH; Kingston town, NH; Litchfield town, NH; Londonderry town, NH; Lyndeboro town, NH; Mason town, NH; Merrimack town, NH; Milford town, NH; Mont Vernon town, NH; Nashua city, NH; Newton town, NH; Pelham town, NH; Plaistow town, NH; Salem town, NH; Sandown town, NH; Seabrook town, NH; South Hampton town, NH; Temple town, NH; Wilton town, NH; and Windham town, NH.
For more information
Answers to frequently asked questions about the OEWS data are available at www.bls.gov/oes/oes_ques.htm. Detailed information about the OEWS program is available at www.bls.gov/oes/oes_doc.htm.
Information in this release will be made available to individuals with sensory impairments upon request. Voice phone: (202) 691-5200; Telecommunications Relay Service: 7-1-1.
| Occupation (1) | Employment | Mean wages | ||
|---|---|---|---|---|
| Level (2) | Location quotient (3) | Hourly | Annual (4) | |
Computer and mathematical occupations | 131,990 | 1.6 | $54.94 | $114,280 |
Computer systems analysts | 12,500 | 1.4 | 54.62 | 113,610 |
Information security analysts | 3,790 | 1.3 | 54.84 | 114,070 |
Computer and information research scientists | (5) | (5) | 68.22 | 141,890 |
Computer network support specialists | 3,050 | 0.9 | 43.85 | 91,210 |
Computer user support specialists | 13,960 | 1.2 | 34.64 | 72,040 |
Computer network architects | 5,150 | 1.7 | 64.49 | 134,140 |
Database administrators | 2,330 | 1.5 | 56.12 | 116,720 |
Database architects | 1,150 | 1.2 | 68.65 | 142,790 |
Network and computer systems administrators | 6,360 | 1.1 | 50.60 | 105,240 |
Computer programmers | 4,480 | 1.6 | 53.08 | 110,410 |
Software developers | 55,690 | 2.2 | 62.21 | 129,400 |
Software quality assurance analysts and testers | 4,300 | 1.2 | 52.42 | 109,040 |
Web developers | 1,790 | 1.2 | 42.66 | 88,730 |
Web and digital interface designers | 2,310 | 1.5 | 40.27 | 83,760 |
Computer occupations, all other | 6,040 | 0.9 | 48.73 | 101,360 |
Actuaries | 630 | 1.5 | 67.07 | 139,510 |
Operations research analysts | 3,050 | 1.7 | 43.10 | 89,660 |
Statisticians | 1,790 | 3.1 | 57.53 | 119,670 |
Data scientists | 2,470 | 1.3 | 54.05 | 112,420 |
Mathematical science occupations, all other | (5) | (5) | 70.37 | 146,370 |
Footnotes: | ||||
Last Modified Date: Tuesday, June 14, 2022