
An official website of the United States government
 United States Department of Labor
An official website of the United States government
United States Department of Labor

The .gov means it's official.
Federal government websites often end in .gov or .mil. Before sharing sensitive information,
make sure you're on a federal government site.

The site is secure.
The
https:// ensures that you are connecting to the official website and that any
information you provide is encrypted and transmitted securely.


Sample surveys are subject to two types of errors: sampling and non-sampling. Sampling errors occur because observations are not taken from every unit in the population, and so sample estimates may differ from population estimates. Non-sampling errors can be attributed to many sources, such as measurement error (including differences in the interpretation of questions across respondents, mistakes in recording or coding the data obtained, etc.), inability or unwillingness of the respondent to provide correct information, and other errors of collection response, processing, coverage, and estimation of missing data.
Small sample size can exacerbate both types of error, making estimates derived from small samples less reliable than those derived from large samples. Nonresponse can also bias estimates, especially when the answer to information not collected due to nonresponse is correlated with propensity to respond. For example, if persons who would answer “yes” to a question never respond, the survey results would report the answer is always “no.”
Research articles examining non-sampling errors in the Consumer Expenditure Surveys (CE), including measurement error and nonresponse bias, are included in the CE library. BLS regularly examines CE data in annual data quality assessments and compares CE results with other sources of federal statistics. For more information, see the Data Quality and Comparisons page.
Standard errors serve two purposes. First, they provide a general measure of the precision of a survey's estimates. Second, they determine whether differences between various estimates are statistically significant, for example, whether a difference in means for two demographic groups sampled (e.g., urban and rural consumers) is likely observed due to an actual difference in the two population means, or to sampling error.
BLS uses the Balanced Repeated Replication (BRR) method to estimate standard errors for CE data. BLS used the standard BRR method through 2024 CE data, and implemented Fay's method, a variant of BRR, starting with 2025 CE data.
Note that computing standard errors for CE income data is more complicated than it is for expenditures, because CE income data are multiply imputed when receipt of, but not values for, income is reported. For information on computing standard errors with multiply imputed data, see the User's Guide to Income Imputation in the CE.
Both BRR variants (standard BRR and Fay's method) compute an estimated population mean, and a variance associated with that mean. The square root of this variance is the standard error of the mean. Both variants use population weights and, for CE data since 1990, 44 replicate weights (described subsequently) in the computation of the standard error. (Note there were 20 replicates in CE data prior to 1990.) The difference is in the computation of the replicate weights, and a constant factor that is applied to the variance obtained in Fay's method before taking its square root to find the standard error.
The population weight is the number of consumer units each sampled unit represents. That is, suppose a consumer unit in the sample represents itself and 4,999 consumer units like it. The population weight for this consumer unit is 5,000. When the population weights for all consumer units in the sample are summed, the total is the estimated number of consumer units in the population.
The estimated population mean, X̄, is the sum of the population-weighted expenditures for each consumer unit divided by the estimated number of consumer units in the population. For example, if the population weight for a consumer unit is 5,000, and that consumer unit spends $10 on an item (good or service) of interest, the population-weighted expenditure for this consumer unit is $50,000. This $50,000 is added to all the other population-weighted expenditures to estimate the total amount spent in the population on the item of interest, also known as the aggregate expenditure for the item. Dividing this sum (aggregate expenditure) by the estimated number of consumer units in the population yields the amount that the average consumer unit spent on the item of interest, denoted as X̄(see formula 1).
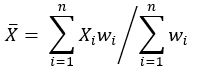
Where:
X is the expenditure for the item of interest
w is the population weight
n is the total of number of consumer units in the sample
To compute the standard error of this mean, the first step is to compute a series of 44 means using replicate weights. Each consumer unit in the sample has 44 replicate weights. Like the population weight, the sum of each replicate weight across consumer units equals the estimated number of consumer units in the population. That is, the sum of the weights across consumer units in the first replicate equals the sum of weights across consumer units in the second replicate, and both equal the estimated total number of consumer units in the population. The mean associated with each replicate weight is computed the same way as just described for the population-weighted mean (see formula 2).
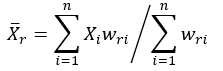
Where:
r is the number of the replicate weight (1 through 44)
The variance in the standard BRR variant is computed using the standard variance formula and replicate weight mean estimate from the population mean estimate. That is, the variance is computed as the sum of the squared difference between each of the 44 replicate weight mean estimates and the population-weighted mean estimate, which is then divided by 44 (see formula 3). The square root of this variance, V̂BRR (X̄), is the standard error of X̄ (see formula 3).
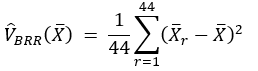
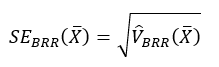
One difference between the standard BRR and Fay's method is in the computation of the replicate weights themselves. In standard BRR, about half of the replicate weights across consumer units have positive values, and about half are equal to 0. In the CE public use microdata, values are either positive or missing, and users convert missing values to 0. In Fay's method, all replicate weights have positive values. However, once computed, the population and replicate weights are used in standard error computation in the same way for both standard BRR and Fay's method.
Another difference between standard BRR and Fay's method is that Fay's method requires an adjustment to the variance formula. Before computing the standard error for CE data, the variance is multiplied by four. The formula to calculate a Fay's method variance is shown in formula 4.
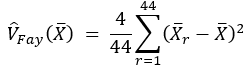
The generalized variance formula demonstrates why the factor of four is needed for Fay's method. As shown in formula 5, the generalized formula is calculated using the number of replicate weights, R, and a constant, k. For both standard BRR and Fay's method variance, the number of replicate weights, R, is 44. The constant, k, for standard BRR is 0 and for Fay's method is a value between 0 and 1, set to one-half for CE data. The generalized formula reduces to the factor of four as the sole difference between standard BRR and Fay's method.
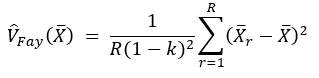
Where:
R is the number of replicate weights
k is a constant between 0 and 1, set to 0.5 for CE data
As noted, the replicate weights in standard BRR are 0 about half the time, but always positive in Fay's method. For this reason, Fay's method mitigates the risk when working with small sample sizes. Previous research by BLS has found Fay's method produces more robust variance measures (for example, this article comparing variance estimation methods for the National Compensation Survey).
Last Modified Date: October 5, 2026