An official website of the United States government
 United States Department of Labor
A recent article using data from the BLS Consumer Expenditure Survey (CE) compares the spending patterns of young (21-to-29-year-old), single adults interviewed in 2004-05 to those of young, single adults interviewed twenty years earlier in 1984-85 (Geoffrey Paulin, Monthly Labor Review, December 2008, "Expenditure patterns of young single adults: two recent generations compared," pp. 19-50; on the Internet at www.bls.gov/opub/mlr/2008/12/art2full.pdf). Below, the author summarizes some of the key findings from the article.
The results show clear differences in some spending patterns and other characteristics for these two groups. However, the results also show some ways in which these two groups are similar.
Young singles in the more recent period were more likely to:
Young singles in the more recent period:
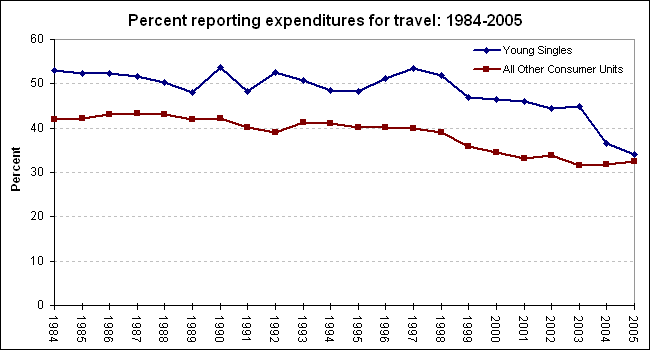
Travel provides a particularly interesting example of how spending by young singles has changed over time. Total outlays for non-business travel by young singles were down in 2004-05 compared with 1984-85, as was the percent of young singles reporting having these travel expenditures.

This decrease in percent reporting is consistent with patterns observed for other households. Some of the decline may be due to price increases for travel-related items. Some may be attributable to new technologies that were not so widely available in 1984-85, such as e-mail, cell phones, and instant messaging that facilitate communication.
Young singles are defined here as persons ranging in age from 21 to 29 years old who have never been married and who constitute their own consumer units (see also www.bls.gov/cex/csxfaqs.htm#definitions). In addition, outlays are analyzed to describe spending patterns and economic status because the income data are not directly comparable over time due to methodological changes in data processing starting with the publication of the 2004 CE data, and because outlays include certain payments that are not included in the definition of expenditures. Other technical differences between outlays and expenditures are described in the article at www.bls.gov/opub/mlr/2008/12/art2full.pdf.
| Year | Young singles | All other consumer units |
|---|---|---|
1984 | 52.9 | 42.0 |
1985 | 52.4 | 42.1 |
1986 | 52.3 | 43.0 |
1987 | 51.6 | 43.3 |
1988 | 50.3 | 43.0 |
1989 | 48.0 | 41.9 |
1990 | 53.6 | 42.1 |
1991 | 48.3 | 40.1 |
1992 | 52.7 | 39.0 |
1993 | 50.9 | 41.2 |
1994 | 48.6 | 41.0 |
1995 | 48.2 | 40.1 |
1996 | 51.1 | 40.1 |
1997 | 53.4 | 40.0 |
1998 | 51.9 | 39.0 |
1999 | 47.0 | 35.9 |
2000 | 46.5 | 34.6 |
2001 | 46.0 | 33.1 |
2002 | 44.5 | 33.7 |
2003 | 44.9 | 31.7 |
2004 | 36.6 | 31.9 |
2005 | 34.2 | 32.5 |
Last Modified Date: April 6, 2018