An official website of the United States government
 United States Department of Labor
The internal CE microdata contains information that could reveal the identity of respondents. BLS changes potentially revealing information to ensure that data users cannot identify survey respondents. We call this process "topcoding" for reported values that exceed a positive threshold and "bottom coding" for reported values that exceed a negative threshold. For simplicity this document refers only to "topcoding".
This page discuss the main aspects of topcoding: Topcoding basic variables, recoding summary variables, conditional recoding, geographic recoding, and transferring topcoded observations to related files.
If CE topcodes an observation, it sets its flag variable to 'T'.
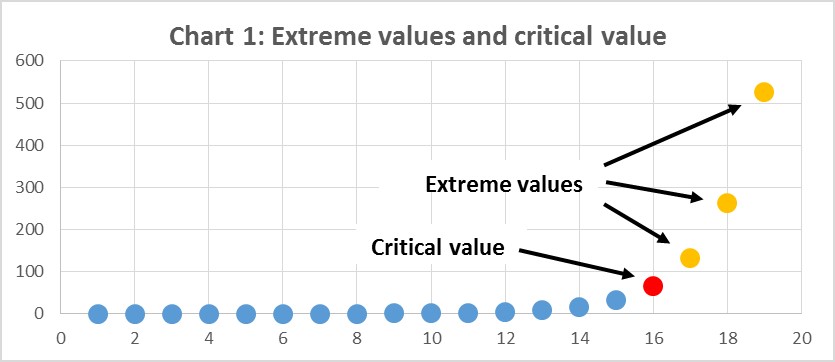
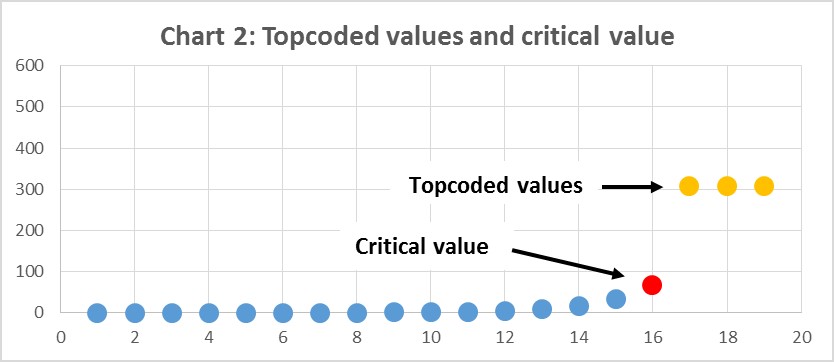
Topcoding variables refers to replacing a reported observation that exceeds a prescribed critical value. CE calculates critical values using the guidelines by the Census Review Board. This method is applied to observations in the FMLI, FMLD, EXPN, and EXPD files.
|
 |
|
 |
All five quarters of data in the CE microdata release are used to determine critical values and topcode amounts. Since the critical value and set of values that need to be topcoded may differ with each annual release, the topcode values may change annually and be applied at a different starting point. By topcoding values in this manner, means are preserved for each five-quarter data release when using the total sample. This will not be the case when means are estimated by characteristic.
Recoding summary variables occurs when an aggregate variable includes a 'feeder' variable that has been topcoded. A feeder variable is a variable that is used to sum an aggregate variable. This method is applied to variables in the FMLI, FMLD, MEMI, and MEMD.
This method involves three steps:
The example below clarifies this method. For example, the variable FSMPFRMX (family income or loss from self-employment) is computed as the sum of the values for the variable SEMPFRMX (member income or loss from self-employment) from the MEMI file. For SEMPFRMX, all values above the critical value of $150,000 (-$170,000) are topcoded to $321,846 (-$435,000).
| SEMPFRMX reported | SEMPFRMX topcoded | FSMPFRMX Topcoded | FSMPFRMX Topcoding flag | ||
|---|---|---|---|---|---|
|
CU 1 |
Member 1 | $95,000 | $95,000 | $170,000 | No |
|
|
Member 2 | $75,000 | $75,000 | ||
|
CU 2 |
Member 1 | $160,000 | $321,846 | $331,846 | Yes |
|
|
Member 2 | $10,000 | $10,000 | ||
|
CU 3 |
Member 1 | $450,000 | $321,846 | $643,692 | Yes |
|
|
Member 2 | $350,000 | $321,846 | ||
|
CU 4 |
Member 1 | $300,000 | $321,846 | -$113,154 | Yes |
|
|
Member 2 | -$200,000 | -$435,000 |
The case for CU 1 and CU 2 demonstrate that aggregate values can differ after topcoding even if the values before topcoding sum to the same amount. CU 1 and CU 2 both reported $170,000 for FSMPFRMX, however CE only topcodes the value reported by member 1 of CU2. Thus, the value for FSMPFRMX for CU2 is higher than for CU1 and is flagged as topcoded while CU1 is not. By using the mean of the subset of observations that are above (below) the critical value as the topcode amount, values on the public use data can be either below or above the actual reported value.
The case of CU3 demonstrates that the topcoded value can be lower than the reported value.
The case of CU4 demonstrates that the reported value for FSMPFRMX can be positive, while the topcoded value can be negative. The reverse can also occur.
Conditional topcoding is applied to variables if data users could deduce revealing information about feeder variables because the variables are used in formulas. A feeder variable is a variable that is used to sum an aggregate variable. This method is used for MEMI and MEMD.
This method involves three steps:
The example below clarifies this method for MEMI but applies as well to MEMD. The five MEMI file variables -- AMTFED, GOVRETX, PRIVPENX, RRRDEDX, and SLTAXX -- describe deductions from the most recent pay. These variables are used in conjunction with GROSPAYX (amount of last gross pay) and SALARYXM (annual wage and salary income) to derive ANFEDTX, ANGOVRTX, ANPRVPNX, ANRRDEDX, and ANSLTX, which represent the estimated annual deductions for each of these income deduction categories. The estimated annual Federal income tax deduction from pay is calculated as
(1) ANFEDTXM = (SALARYXM (AMTFED/GROSPAYX))SALARYXM can be estimated by using the above terms and rearranging such that
(2) SALARYXM = (ANFEDTXM (GROSPAYX/AMTFED))In the above example, a problem with disclosure may arise when neither ANFEDTXM, GROSPAYX, nor AMTFED are topcoded, but SALARYXM is. In this situation, the original value of SALARYXM can be recalculated by inserting the non-topcoded values into equation (2) and solving for SALARYXM. To prevent this, the non-topcoded terms in equation (2) will be suppressed (blanked out) and their associated flags will be assigned a value of 'T'.
The following chart describes the specific rules that CE applies to prevent the potential disclosure outlined above.
The same special suppression for MEMI file variables occurs with the original (pre-income imputation) variables that correspond to the variables noted above (SALARYX, ANFEDTX).
Geographic recoding refers to the process of replacing or suppressing the state code if topcoding is not feasible. This method applies to FMLI and FMLD.
The value of the variable STATE identifies the state of residence. This variable must be suppressed for some observations to meet the Census Disclosure Review Board's criterion that the smallest geographically identifiable area must have a population of at least 100,000. STATE data were evaluated in conjunction with the POPSIZE, REGION, and BLS_URBN variables, which show the population size of the geographic area that is sampled, the four regions, and urban/rural status, respectively. Some STATE codes were suppressed because, in combination with these variables, they could be used to identify areas of 100,000 or less. On approximately 14 percent of the records on the FMLI files the STATE variable is blank.
A small proportion of STATE codes are replaced with codes of states other than the state where the CU resides. By re-coding in this manner, suppression of POPSIZE may be avoided. REGION is suppressed in some states. (In past releases selected observations of POPSIZE required suppression.) In total, approximately 4% of observations are recoded.
States not listed are not in the CE sample.
The table below lists the code CE uses to identify the state, the type of suppression, and the name of the state.
| FIPS CODE | Flag | State | |
|---|---|---|---|
| Prior to 2015 | 2015 forward | ||
|
1 |
D | Alabama | |
|
2 |
Alaska | ||
|
4 |
Arizona | ||
|
5 |
A | A | Arkansas |
|
6 |
B | California | |
|
8 |
B | Colorado | |
|
9 |
Connecticut | ||
|
10 |
C | D | Delaware |
|
11 |
District of Columbia | ||
|
12 |
Florida | ||
|
13 |
F | Georgia | |
|
15 |
Hawaii | ||
|
16 |
A | Idaho | |
|
17 |
B | F | Illinois |
|
18 |
B | B | Indiana |
|
20 |
B | Kansas | |
|
21 |
Kentucky | ||
|
22 |
Louisiana | ||
|
23 |
B | Maine | |
|
24 |
D | D | Maryland |
|
25 |
Massachusetts | ||
|
26 |
B | B | Michigan |
|
27 |
C | F | Minnesota |
|
28 |
A | Mississippi | |
|
29 |
B | Missouri | |
|
30 |
A | A | Montana |
|
31 |
A | Nebraska | |
|
32 |
Nevada | ||
|
33 |
New Hampshire | ||
|
34 |
D | New Jersey | |
|
35 |
A | New Mexico | |
|
36 |
B | New York | |
|
37 |
A | North Carolina | |
|
38 |
A | North Dakota | |
|
39 |
B | B | Ohio |
|
40 |
Oklahoma | ||
|
41 |
B | B | Oregon |
|
42 |
F | Pennsylvania | |
|
44 |
Rhode Island | ||
|
45 |
South Carolina | ||
|
46 |
A | South Dakota | |
|
47 |
B | Tennessee | |
|
48 |
B | B | Texas |
|
49 |
Utah | ||
|
50 |
A | Vermont | |
|
51 |
B | F | Virginia |
|
53 |
B | Washington | |
|
54 |
B | F | West Virginia |
|
55 |
F | D | Wisconsin |
Explanation of suppression codes:
Interfile recoding is used to topcode variables that appear in multiple files. This method is also called "mapping" and is used to topcode observations in the MTBI, ITBI, and DTBD.
This method uses three steps:
Set the flag value to 'T' for that observation of mapped variable.
The concordance file, called Parse file, lists which EXPN variables are mapped to which UCC. To obtain the Parse file, please contact the Consumer Expenditure Survey at the phone number or email address at the bottom of this page. Some UCCs have multiple topcode values depending on where the original value is mapped from.
Last Modified Date: November 4, 2024