
An official website of the United States government
An official website of the United States government
The .gov means it's official.
Federal government websites often end in .gov or .mil. Before sharing sensitive information,
make sure you're on a federal government site.
The site is secure.
The
https:// ensures that you are connecting to the official website and that any
information you provide is encrypted and transmitted securely.
In 1980, Ronald Reagan defeated Jimmy Carter to become the 40th president of the United States; Mt. St. Helens in Washington State erupted; and the U.S. hockey team won the gold medal at the winter Olympics. That year, the Bureau of Labor Statistics (BLS) first initiated the Consumer Expenditure Survey (CE) as a continuing survey, with 2010 marking the 30th anniversary. Since its beginning in the late 1800s, the survey had been conducted at about ten-year intervals, with the 1960-61 and 1972-73 surveys the most recent prior to 1980. However, rapidly changing economic conditions highlighted by the oil crisis in the 1970s illustrated the need for more frequent monitoring of the spending patterns of American consumers. This was especially important because a primary use of the CE data has been to update the expenditure weights for the market basket—the mix of goods and services—used in the BLS Consumer Price Index (CPI), the most widely used measure of inflation in the U.S. economy. Rapid inflation—in excess of 13 percent from 1979 to 1980—further demonstrated the need for more frequent updates to the CPI weights than every decade.
The ongoing CE that began in 1980 consists of two separate components, each with its own questionnaire and sample: 1) an interview survey in which each of the consumer units (CUs) in the sample is interviewed every 3 months over a 12-month period, and 2) a diary survey in which consumer units complete a diary of expenses for two consecutive 1-week periods. Data collection for both survey components is done by the U.S. Census Bureau under contract with BLS. The two survey components are designed to capture different types of consumer expenditures—larger or regularly occurring expenditures that can be easily recalled over a period of time, such as car purchases and rent or utility payments, in the Interview Survey; and smaller, more frequent purchases that cannot be easily recalled, such as grocery items or housekeeping supplies, in the Diary Survey. Since CUs are asked to record all expenditures made during the reporting period in the Diary Survey, however, an overlap in coverage occurs between the two components.
Data published from the first few years of the continuing survey were shown by survey source—either Diary Survey or Interview Survey. However, data published from 1984 to the present have been integrated from the two components, thereby capturing the most reliable data from each component. This results in having comparable data from 1984 through 2008, the most recent year of data. The following section highlights some of the changes in consumer spending from 1984 to 2008.
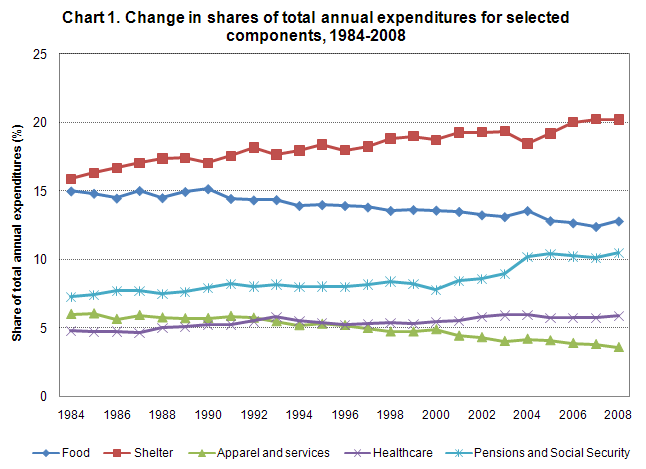
One way to see how spending patterns have changed is to examine the relative shares of average annual expenditures allocated to the different components of spending. During the 1984 through 2008 period, some components’ shares increased steadily, some decreased steadily, and others fluctuated. Also, some items are new to the ongoing survey since 1980, primarily new technology goods and services, and their shares have risen from zero to significant amounts in 2008. Computer hardware and software, internet service, and cell phone service are examples of goods and services for which expenditure data were not collected in 1980. In 2008, combined expenditures for those items accounted for two percent of total spending.
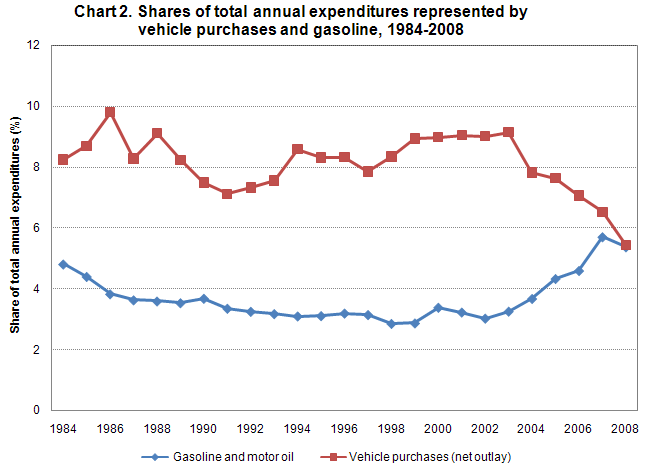
Changes in the relative shares of average annual expenditures include:
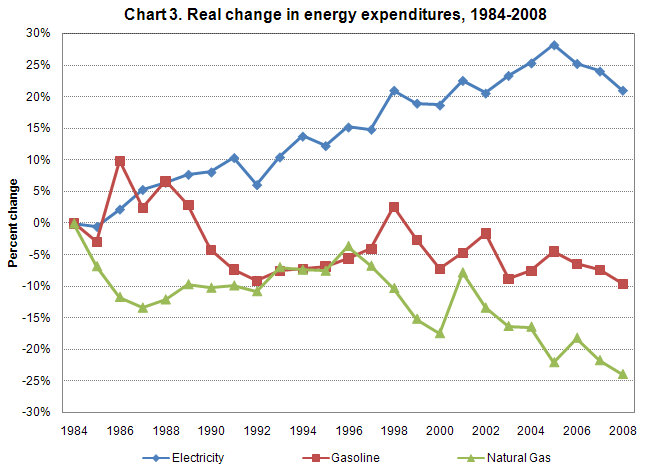
Another way to see how spending has changed over time is to look at spending on consumer goods and services adjusted by the changes in the prices of those items. Prices for most goods and services generally rise over time but there are some, computers for example, whose prices may actually fall. Consumers sometimes adjust their spending when the prices of some goods or services change relative to others. For example, a spike in gasoline prices may cause consumers to forgo long driving trips, or to purchase more fuel-efficient vehicles. Conversely, they may decide not to make such adjustments and pay higher prices, thereby increasing their nominal expenditures for gasoline.
The CPI is one measure of price changes that can be used to adjust nominal expenditures to estimate what are termed “real” expenditures on an item. If the percentage change in the price of an item over time matches the percentage change in expenditures for that item, then there is no change in real expenditures on that item. However, if the percentage price increase exceeds the percentage expenditure increase, then real spending on that item decreases. Conversely, if the percentage price increase is less than the increase in spending, then real spending increases.
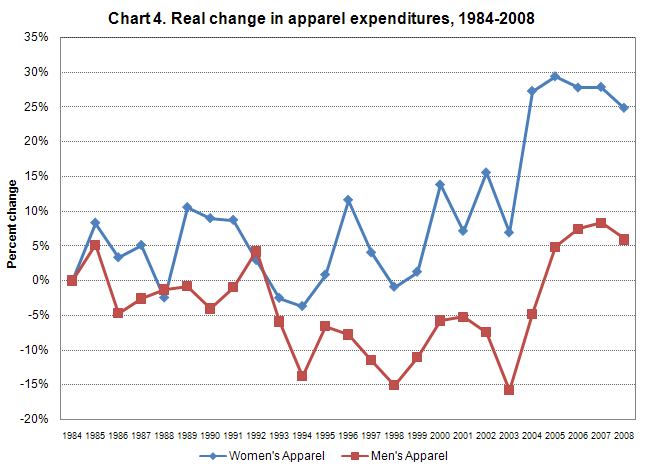
Using nominal CE expenditures for selected items over the period 1984 through 2008 adjusted by the change in CPI prices of those items over that period show the following changes in real spending:
There have been a number of important survey changes since the ongoing CE began in 1980. Some of the noteworthy changes include:
1984 The first year for which data integrated from the Diary Survey and the Interview Survey are available.
1986 A new sample design based on the 1980 Decennial Census is introduced.
1993 CE microdata (data at the consumer unit level) are made available on CD-ROM for sale to the public.
1995 CE data tables are made available to the public on the BLS Website.
1996 A new sample design based on the 1990 Decennial Census is introduced.
1999 The sample of consumer units is expanded by about 50 percent, primarily to facilitate more frequent updates to the CPI expenditure weights.
1999 The CE Division receives funding to establish a separate branch devoted to survey research.
2000 The first year for which standard error tables are available.
2001 Improvements to the survey income estimates are made by introducing income brackets in the data collection.
2003 Data collection in the Interview Survey shifts from paper and pencil to computer assisted personal interview (CAPI).
2004 New tables and classifications are published using 2003 data.
2004 Income estimates are further improved by implementing model-base imputation methods to impute incomes.
2005 A redesigned diary collection instrument is introduced. The new user-friendly diary is designed to encourage diary keeper participation and elicit better reporting of expenditures.
2005 A new sample design based on the 2000 Decennial Census is introduced.
2006 The first of the annual CE public-use microdata workshops is held at BLS.
Work has begun on evaluating how to publish CE data every three months, in addition to the current annual publication of calendar year data. The quarterly data release would include a full year of CE data, updated to the latest calendar quarter data that has been processed—a “rolling four quarters” approach. This will provide more up-to-date information for data users and allow them to better track recent economic developments.
The CE has begun a major project to investigate alternatives for redesigning the surveys. The primary objective of the redesign effort is to improve expenditure estimates through a reduction in measurement error, with a particular emphasis on underreporting. This effort is designed to maintain or improve response rates and keep survey costs at their current level. The project aims to address how survey estimates have been impacted by changes in society, and new consumer products and spending methods, and to explore how new data collection technologies can improve expenditure reporting. Current and planned efforts include:
More information about these and other aspects of the redesign will be discussed in future articles and reports.
Last Modified Date: January 26, 2010