
An official website of the United States government
An official website of the United States government
The .gov means it's official.
Federal government websites often end in .gov or .mil. Before sharing sensitive information,
make sure you're on a federal government site.
The site is secure.
The
https:// ensures that you are connecting to the official website and that any
information you provide is encrypted and transmitted securely.
This major group comprises the following occupations: Chefs and Head Cooks ; First-Line Supervisors of Food Preparation and Serving Workers ; Cooks, Fast Food ; Cooks, Institution and Cafeteria ; Cooks, Private Household ; Cooks, Restaurant ; Cooks, Short Order ; Cooks, All Other ; Food Preparation Workers ; Bartenders ; Combined Food Preparation and Serving Workers, Including Fast Food ; Counter Attendants, Cafeteria, Food Concession, and Coffee Shop ; Waiters and Waitresses ; Food Servers, Nonrestaurant ; Dining Room and Cafeteria Attendants and Bartender Helpers ; Dishwashers ; Hosts and Hostesses, Restaurant, Lounge, and Coffee Shop ; Food Preparation and Serving Related Workers, All Other
Employment estimate and mean wage estimates for this major group:
| Employment (1) | Employment RSE (3) |
Mean hourly wage |
Mean annual wage (2) |
Wage RSE (3) |
|---|---|---|---|---|
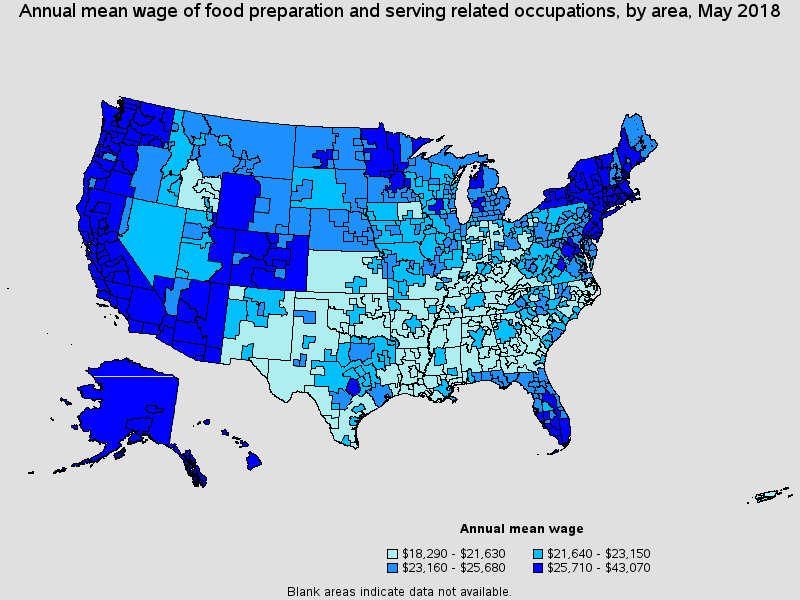
| 13,374,620 | 0.1 % | $12.30 | $25,580 | 0.2 % |
Percentile wage estimates for this major group:
| Percentile | 10% | 25% | 50% (Median) |
75% | 90% |
|---|---|---|---|---|---|
| Hourly Wage | $8.49 | $9.33 | $11.09 | $13.59 | $17.96 |
| Annual Wage (2) | $17,660 | $19,410 | $23,070 | $28,270 | $37,360 |
Industries with the highest published employment and wages for this occupation are provided. For a list of all industries with employment in this occupation, see the Create Customized Tables function.
Industries with the highest levels of employment in this occupation:
| Industry | Employment (1) | Percent of industry employment | Hourly mean wage | Annual mean wage (2) |
|---|---|---|---|---|
| Restaurants and Other Eating Places | 9,647,490 | 90.22 | $11.94 | $24,830 |
| Special Food Services | 581,630 | 81.08 | $13.45 | $27,980 |
| Traveler Accommodation | 511,820 | 25.59 | $14.72 | $30,610 |
| Food and Beverage Stores (4451 and 4452 only) | 383,430 | 13.12 | $12.62 | $26,250 |
| Elementary and Secondary Schools | 368,050 | 4.31 | $12.92 | $26,880 |
Industries with the highest concentration of employment in this occupation:
| Industry | Employment (1) | Percent of industry employment | Hourly mean wage | Annual mean wage (2) |
|---|---|---|---|---|
| Restaurants and Other Eating Places | 9,647,490 | 90.22 | $11.94 | $24,830 |
| Drinking Places (Alcoholic Beverages) | 334,680 | 85.51 | $12.40 | $25,790 |
| Special Food Services | 581,630 | 81.08 | $13.45 | $27,980 |
| Rooming and Boarding Houses | 4,290 | 35.93 | $12.68 | $26,370 |
| Traveler Accommodation | 511,820 | 25.59 | $14.72 | $30,610 |
Top paying industries for this occupation:
| Industry | Employment (1) | Percent of industry employment | Hourly mean wage | Annual mean wage (2) |
|---|---|---|---|---|
| Securities, Commodity Contracts, and Other Financial Investments and Related Activities | 50 | 0.01 | $21.42 | $44,550 |
| Rail Transportation | 830 | 0.36 | $21.21 | $44,120 |
| Federal Executive Branch (OES Designation) | 12,530 | 0.63 | $19.96 | $41,510 |
| Advertising, Public Relations, and Related Services | 80 | 0.02 | $19.70 | $40,970 |
| Aerospace Product and Parts Manufacturing | 40 | 0.01 | $19.07 | $39,670 |
States and areas with the highest published employment, location quotients, and wages for this occupation are provided. For a list of all areas with employment in this occupation, see the Create Customized Tables function.
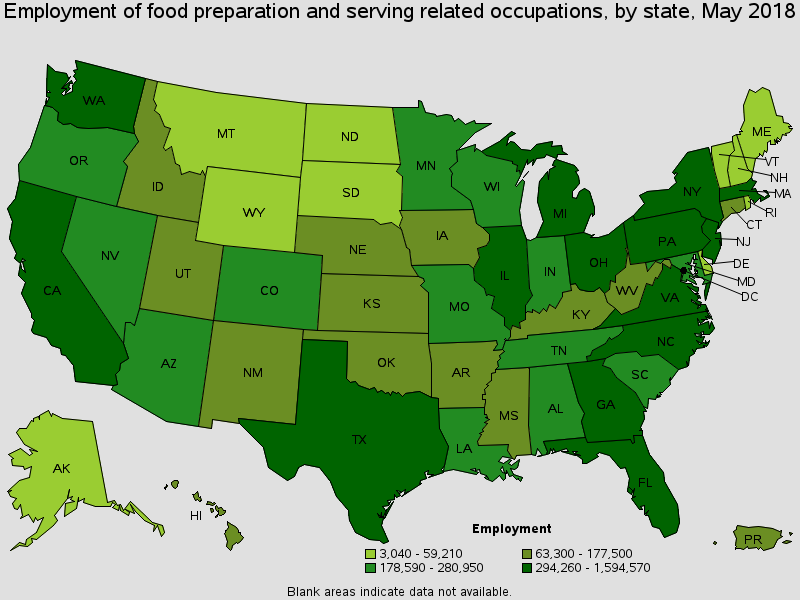
States with the highest employment level in this occupation:
| State | Employment (1) | Employment per thousand jobs | Location quotient (9) | Hourly mean wage | Annual mean wage (2) |
|---|---|---|---|---|---|
| California | 1,594,570 | 93.76 | 1.01 | $13.91 | $28,930 |
| Texas | 1,161,420 | 95.88 | 1.04 | $11.47 | $23,860 |
| Florida | 933,780 | 108.47 | 1.17 | $12.25 | $25,470 |
| New York | 773,400 | 82.40 | 0.89 | $14.91 | $31,000 |
| Illinois | 506,720 | 84.58 | 0.92 | $11.75 | $24,440 |
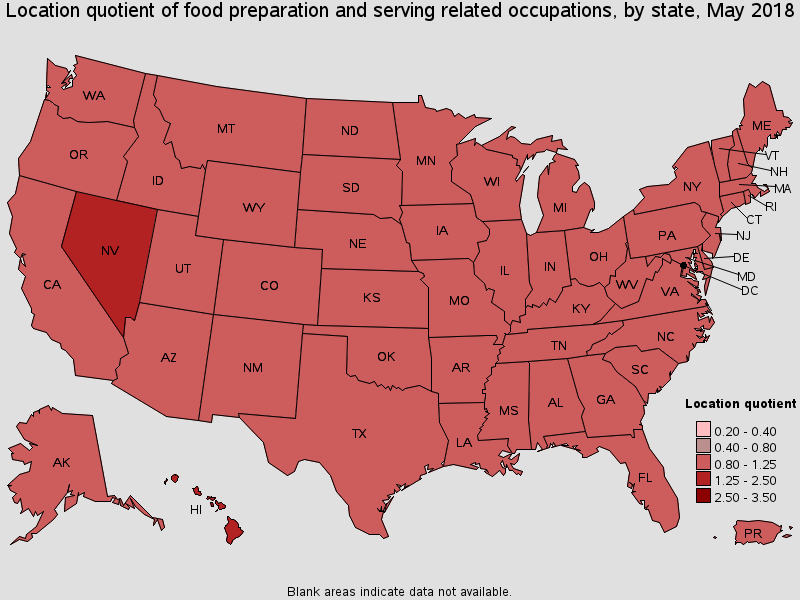
States with the highest concentration of jobs and location quotients in this occupation:
| State | Employment (1) | Employment per thousand jobs | Location quotient (9) | Hourly mean wage | Annual mean wage (2) |
|---|---|---|---|---|---|
| Nevada | 188,280 | 139.76 | 1.51 | $12.92 | $26,880 |
| Hawaii | 85,770 | 133.63 | 1.45 | $17.94 | $37,320 |
| Montana | 51,120 | 110.35 | 1.19 | $11.32 | $23,550 |
| Florida | 933,780 | 108.47 | 1.17 | $12.25 | $25,470 |
| New Mexico | 83,420 | 102.78 | 1.11 | $10.60 | $22,060 |
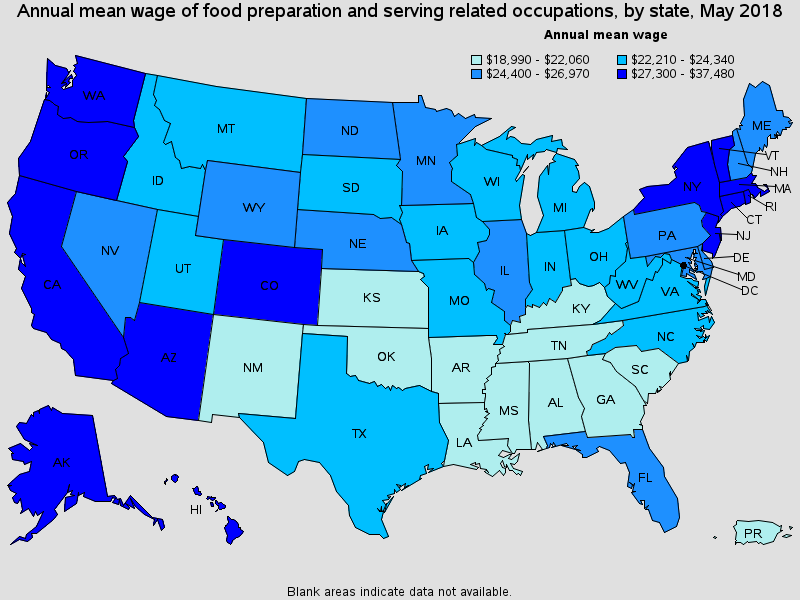
Top paying States for this occupation:
| State | Employment (1) | Employment per thousand jobs | Location quotient (9) | Hourly mean wage | Annual mean wage (2) |
|---|---|---|---|---|---|
| District of Columbia | 59,210 | 83.11 | 0.90 | $18.02 | $37,480 |
| Hawaii | 85,770 | 133.63 | 1.45 | $17.94 | $37,320 |
| Washington | 294,260 | 90.29 | 0.98 | $15.23 | $31,670 |
| Vermont | 26,560 | 87.02 | 0.94 | $15.07 | $31,330 |
| New York | 773,400 | 82.40 | 0.89 | $14.91 | $31,000 |
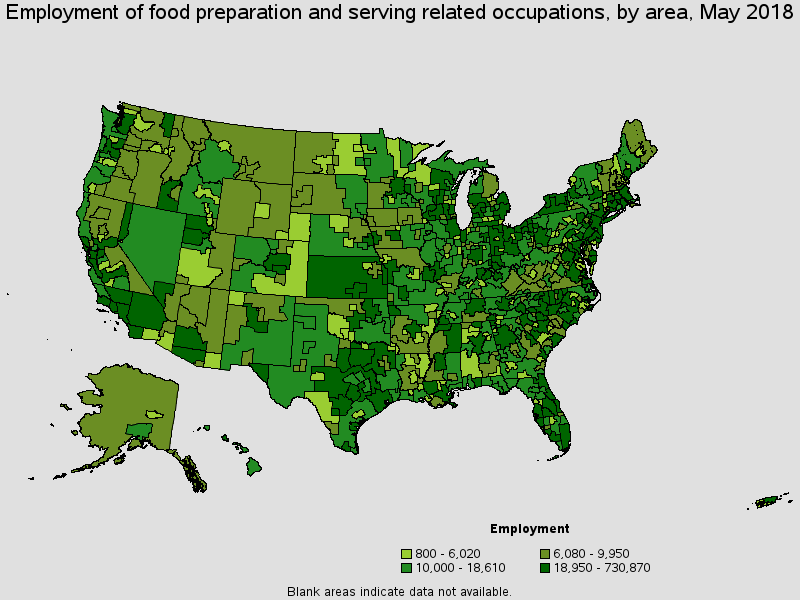
Metropolitan areas with the highest employment level in this occupation:
| Metropolitan area | Employment (1) | Employment per thousand jobs | Location quotient (9) | Hourly mean wage | Annual mean wage (2) |
|---|---|---|---|---|---|
| New York-Newark-Jersey City, NY-NJ-PA | 730,870 | 76.95 | 0.83 | $14.96 | $31,120 |
| Los Angeles-Long Beach-Anaheim, CA | 580,800 | 94.92 | 1.03 | $13.38 | $27,830 |
| Chicago-Naperville-Elgin, IL-IN-WI | 386,120 | 83.18 | 0.90 | $11.98 | $24,920 |
| Dallas-Fort Worth-Arlington, TX | 322,880 | 90.49 | 0.98 | $11.54 | $24,010 |
| Houston-The Woodlands-Sugar Land, TX | 277,440 | 93.02 | 1.01 | $11.95 | $24,860 |
| Washington-Arlington-Alexandria, DC-VA-MD-WV | 260,490 | 83.09 | 0.90 | $14.00 | $29,120 |
| Miami-Fort Lauderdale-West Palm Beach, FL | 257,310 | 99.34 | 1.07 | $12.47 | $25,950 |
| Atlanta-Sandy Springs-Roswell, GA | 250,410 | 93.33 | 1.01 | $10.54 | $21,920 |
| Philadelphia-Camden-Wilmington, PA-NJ-DE-MD | 235,690 | 82.74 | 0.90 | $12.53 | $26,050 |
| Boston-Cambridge-Nashua, MA-NH | 228,750 | 82.92 | 0.90 | $14.99 | $31,180 |
Metropolitan areas with the highest concentration of jobs and location quotients in this occupation:
| Metropolitan area | Employment (1) | Employment per thousand jobs | Location quotient (9) | Hourly mean wage | Annual mean wage (2) |
|---|---|---|---|---|---|
| Kahului-Wailuku-Lahaina, HI | 14,150 | 187.84 | 2.03 | $20.71 | $43,070 |
| Myrtle Beach-Conway-North Myrtle Beach, SC-NC | 29,440 | 180.72 | 1.96 | $10.82 | $22,500 |
| Ocean City, NJ | 7,000 | 179.20 | 1.94 | $13.77 | $28,650 |
| Daphne-Fairhope-Foley, AL | 11,770 | 162.44 | 1.76 | $11.13 | $23,150 |
| Brunswick, GA | 6,730 | 160.45 | 1.74 | $10.60 | $22,040 |
| Hilton Head Island-Bluffton-Beaufort, SC | 12,080 | 160.00 | 1.73 | $11.08 | $23,050 |
| Flagstaff, AZ | 9,850 | 159.09 | 1.72 | $12.77 | $26,560 |
| Jacksonville, NC | 7,460 | 158.60 | 1.72 | $9.80 | $20,380 |
| Las Vegas-Henderson-Paradise, NV | 151,260 | 153.28 | 1.66 | $13.37 | $27,810 |
| Crestview-Fort Walton Beach-Destin, FL | 16,740 | 151.40 | 1.64 | $12.34 | $25,670 |
Top paying metropolitan areas for this occupation:
| Metropolitan area | Employment (1) | Employment per thousand jobs | Location quotient (9) | Hourly mean wage | Annual mean wage (2) |
|---|---|---|---|---|---|
| Kahului-Wailuku-Lahaina, HI | 14,150 | 187.84 | 2.03 | $20.71 | $43,070 |
| Urban Honolulu, HI | 56,050 | 120.19 | 1.30 | $17.12 | $35,610 |
| Napa, CA | 9,640 | 127.72 | 1.38 | $16.25 | $33,800 |
| Seattle-Tacoma-Bellevue, WA | 171,300 | 86.33 | 0.93 | $16.17 | $33,640 |
| San Francisco-Oakland-Hayward, CA | 218,390 | 90.28 | 0.98 | $16.14 | $33,570 |
| Barnstable Town, MA | 13,480 | 130.22 | 1.41 | $15.35 | $31,930 |
| Burlington-South Burlington, VT | 10,110 | 82.22 | 0.89 | $14.99 | $31,180 |
| Boston-Cambridge-Nashua, MA-NH | 228,750 | 82.92 | 0.90 | $14.99 | $31,180 |
| New York-Newark-Jersey City, NY-NJ-PA | 730,870 | 76.95 | 0.83 | $14.96 | $31,120 |
| Mount Vernon-Anacortes, WA | 5,190 | 109.20 | 1.18 | $14.93 | $31,050 |
Nonmetropolitan areas with the highest employment in this occupation:
| Nonmetropolitan area | Employment (1) | Employment per thousand jobs | Location quotient (9) | Hourly mean wage | Annual mean wage (2) |
|---|---|---|---|---|---|
| Kansas nonmetropolitan area | 34,230 | 87.24 | 0.94 | $9.95 | $20,700 |
| North Northeastern Ohio non-metropolitan area (non-contiguous) | 32,560 | 97.25 | 1.05 | $10.61 | $22,070 |
| Balance of Lower Peninsula of Michigan nonmetropolitan area | 24,880 | 91.41 | 0.99 | $11.19 | $23,270 |
| North Texas Region of Texas nonmetropolitan area | 24,390 | 89.65 | 0.97 | $10.41 | $21,640 |
| Piedmont North Carolina nonmetropolitan area | 22,710 | 87.68 | 0.95 | $10.56 | $21,970 |
Nonmetropolitan areas with the highest concentration of jobs and location quotients in this occupation:
| Nonmetropolitan area | Employment (1) | Employment per thousand jobs | Location quotient (9) | Hourly mean wage | Annual mean wage (2) |
|---|---|---|---|---|---|
| South Florida nonmetropolitan area | 12,200 | 162.10 | 1.75 | $13.41 | $27,900 |
| Hawaii / Kauai nonmetropolitan area | 15,560 | 155.45 | 1.68 | $18.40 | $38,260 |
| Northwest Colorado nonmetropolitan area | 16,760 | 139.58 | 1.51 | $14.68 | $30,540 |
| Southwest Missouri nonmetropolitan area | 10,220 | 135.03 | 1.46 | $10.52 | $21,890 |
| Eastern Sierra-Mother Lode Region of California nonmetropolitan area | 7,890 | 133.75 | 1.45 | $13.70 | $28,490 |
Top paying nonmetropolitan areas for this occupation:
| Nonmetropolitan area | Employment (1) | Employment per thousand jobs | Location quotient (9) | Hourly mean wage | Annual mean wage (2) |
|---|---|---|---|---|---|
| Hawaii / Kauai nonmetropolitan area | 15,560 | 155.45 | 1.68 | $18.40 | $38,260 |
| Northern Vermont nonmetropolitan area | 7,190 | 100.97 | 1.09 | $15.64 | $32,520 |
| Alaska nonmetropolitan area | 7,450 | 70.17 | 0.76 | $15.12 | $31,440 |
| Massachusetts nonmetropolitan area | 7,220 | 119.79 | 1.30 | $14.97 | $31,130 |
| Southern Vermont nonmetropolitan area | 9,270 | 86.92 | 0.94 | $14.70 | $30,580 |
These estimates are calculated with data collected from employers in all industry sectors, all metropolitan and nonmetropolitan areas, and all states and the District of Columbia.
The percentile wage estimate is the value of a wage below which a certain percent of workers fall. The median wage is the 50th percentile wage estimate--50 percent of workers earn less than the median and 50 percent of workers earn more than the median. More about percentile wages.
(1) Estimates for detailed occupations do not sum to the totals because the totals include occupations not shown separately. Estimates do not include self-employed workers.
(2) Annual wages have been calculated by multiplying the hourly mean wage by a "year-round, full-time" hours figure of 2,080 hours; for those occupations where there is not an hourly wage published, the annual wage has been directly calculated from the reported survey data.
(3) The relative standard error (RSE) is a measure of the reliability of a survey statistic. The smaller the relative standard error, the more precise the estimate.
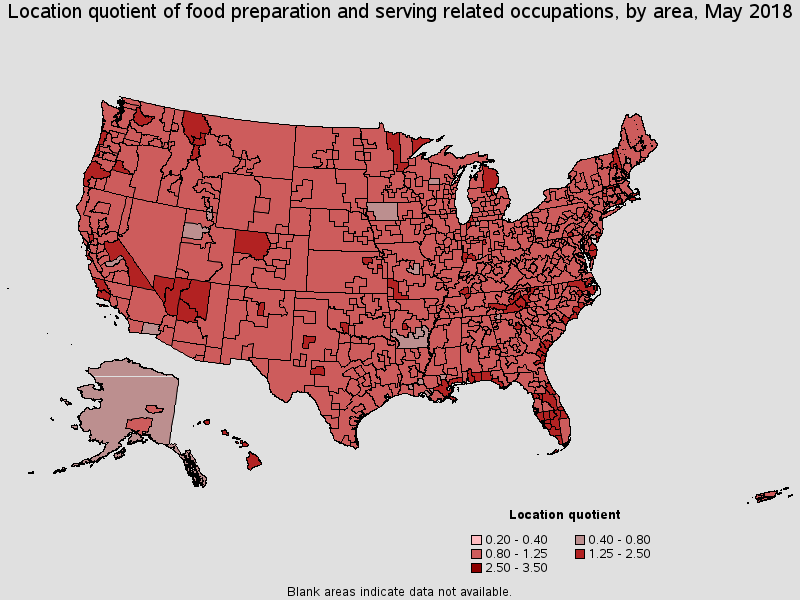
(9) The location quotient is the ratio of the area concentration of occupational employment to the national average concentration. A location quotient greater than one indicates the occupation has a higher share of employment than average, and a location quotient less than one indicates the occupation is less prevalent in the area than average.
Other OES estimates and related information:
May 2018 National Occupational Employment and Wage Estimates
May 2018 State Occupational Employment and Wage Estimates
May 2018 Metropolitan and Nonmetropolitan Area Occupational Employment and Wage Estimates
May 2018 National Industry-Specific Occupational Employment and Wage Estimates
Last Modified Date: March 29, 2019