An official website of the United States government
 United States Department of Labor
A substantial share of U.S. employment in May 2011 was concentrated in a relatively small number of occupations. Just 10 occupations made up more than 20 percent of total employment, and the 20 largest occupations made up nearly one-third of employment—more than 41 million jobs. Most of these large occupations had below-average wages, as did most of the occupations with the highest job gains and losses between May 2007 and May 2011. Growth in the healthcare industry helped to shape employment gains in individual occupations, while construction and production occupations were concentrated in shrinking industries. Although the overall occupational structure of the U.S. economy generally reflected that of the private sector, education and protective service occupations were more prevalent in the public sector, particularly in local government.
This issue of Beyond the Numbers uses data from the Occupational Employment Statistics (OES) program to provide an overview of U.S. occupational employment and wages in May 2011. The first section presents employment and wage data for wage and salary workers in the largest U.S. occupations and selected occupational groups. The subsequent sections highlight occupations with the highest job gains and losses between May 2007 and May 2011, occupations prevalent in growing and shrinking industries, and occupational employment comparisons between the public and private sector.
Retail salespersons and cashiers were the largest occupations in May 2011, with employment of 4.3 million and 3.3 million, respectively. (See chart 1.) The largest occupations also included general office clerks; combined food preparation and serving workers, including fast food; registered nurses; and waiters and waitresses. The 10 occupations shown in chart 1 made up more than 20 percent of employment in May 2011, or more than 1 in every 5 jobs.
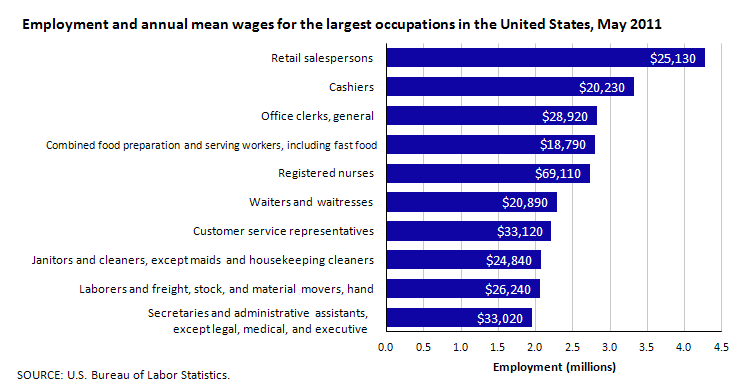
Nearly all of the largest occupations were relatively low paying, with wages considerably below the all-occupations mean. Only one of the 10 largest occupations—registered nurses, with an annual mean wage of $69,110—had an average wage above the U.S. all-occupations mean of $45,230 annually. All of the remaining occupations shown in chart 1 had annual mean wages below $35,000, and 5 of the 10 largest occupations had annual mean wages of about $25,000 or less.
Occupational groups are aggregations of detailed occupations with broadly similar job duties, such as management occupations or legal occupations. Three of the 10 largest occupations were in the office and administrative support occupational group, helping to make office and administrative support the largest occupational group overall. (See chart 2.) About 17 percent of total employment, or nearly one out of every 5 jobs, was in this group. The sales and related occupational group made up nearly 11 percent of total employment and included the two largest individual occupations, retail salespersons and cashiers. The smallest occupational groups included legal occupations; life, physical, and social science occupations; and arts, design, entertainment, sports, and media occupations, each making up around 1 percent of total employment.
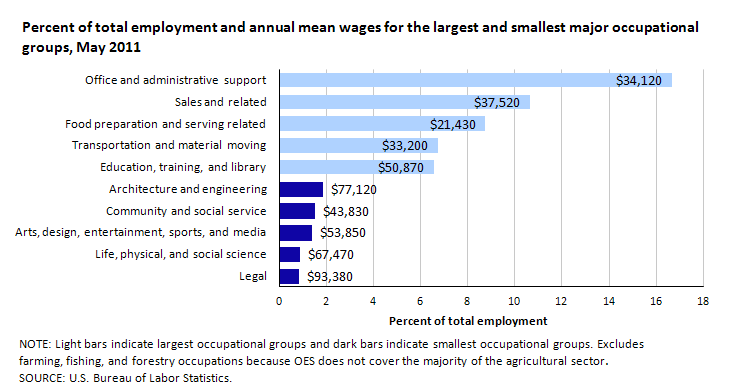
Four of the five largest occupational groups had below-average wages; the lowest paying occupational group was food preparation and serving-related occupations, with an annual mean wage of $21,430. Four of the five smallest occupational groups had above-average wages, and two of these groups were among the highest paying occupational groups overall: legal occupations, with an annual mean wage of $93,380, and architecture and engineering occupations ($77,120). In addition to these two groups, the highest paying occupational groups included management ($107,410), computer and mathematical ($78,730), and healthcare practitioners and technical occupations ($72,730).
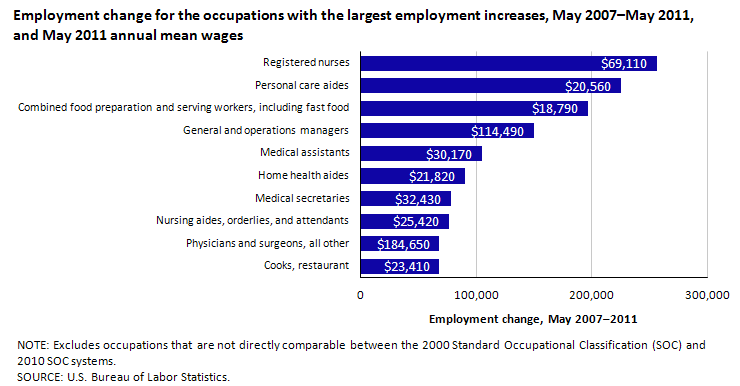
Most of the occupations with the highest job gains were related to healthcare or food service. Occupations with the largest employment increases between May 2007, before the start of the recession, and May 2011 are shown in chart 3. 1 Six of the 10 occupations in the chart were related to healthcare, including registered nurses, which had an employment increase of 256,230; medical assistants; and medical secretaries, a healthcare-related office and administrative support occupation. Occupations with the highest job gains also included personal care aides, combined food preparation and serving workers, general and operations managers, and restaurant cooks.
Of the 10 occupations with the largest employment increases, only 3 had above-average wages: all other physicians and surgeons, general and operations managers, and registered nurses. The remaining seven occupations had wages below the U.S. all-occupations average of $45,230, ranging from $18,790 for combined food preparation and serving workers to $32,430 for medical secretaries. (See chart 3.)
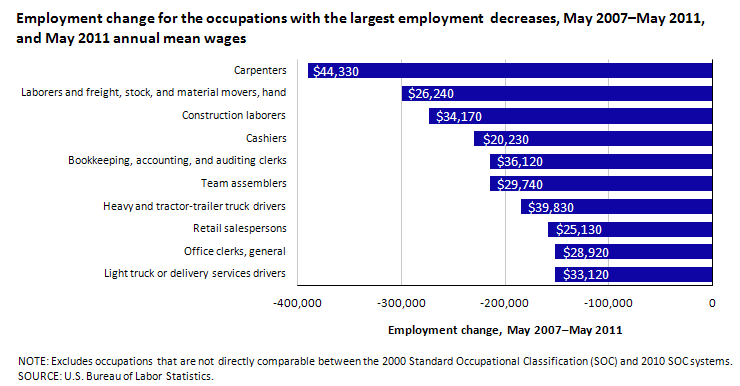
The occupations with the highest job losses between May 2007 and May 2011 included several occupations related to construction, manufacturing, transportation, and retail trade. (See chart 4.) Carpenters had the largest employment decrease over this period, with job losses of 390,760. Occupations with the highest job losses also included construction laborers, team assemblers, heavy and tractor-trailer truck drivers, and light or delivery service drivers. Four of the occupations with the largest employment decreases also were among the largest occupations overall: laborers and hand freight, stock, and material movers; cashiers; retail salespersons; and general office clerks. All of the occupations with the largest employment decreases had below-average wages, ranging from $20,230 for cashiers to $44,330 for carpenters.
Healthcare and social assistance was the industry with the highest employment increase between 2007 and 2011. Healthcare occupations made up more than half of industry employment in May 2011, and they accounted for 5 of the 10 largest individual occupations, including registered nurses, with industry employment of nearly 2.4 million, and nursing aides, orderlies, and attendants (1.3 million). (See chart 5.) The largest occupations in the healthcare and social assistance industry that are not considered healthcare occupations included personal care aides, childcare workers, and several office and administrative support occupations. Six of the 10 largest occupations in this industry also were among the occupations with the largest 2007–2011 employment increases (shown in chart 3), underscoring the importance of this industry in employment growth in individual occupations.

The healthcare and social assistance industry had an annual average wage of $47,550, about 5 percent above the U.S. all-occupations mean. Although this industry contained high concentrations of some of the highest paying occupations—including dentists, physicians and surgeons, optometrists, and pharmacists, all with annual mean wages over $100,000—most of the largest occupations in this industry were relatively low paying. With an annual mean wage of $69,170 in this industry, registered nurses was the only large occupation in the healthcare and social assistance industry with an average wage above the U.S. all-occupations mean. (See chart 5.) Wages for the remaining large occupations in the industry ranged from $20,300 for childcare workers to $41,880 for licensed practical and licensed vocational nurses.
In contrast to healthcare and social assistance, the manufacturing and construction industries experienced large net employment decreases between 2007 and 2011. 2 The largest occupations in each of these industries are shown in charts 6 and 7. Production occupations made up about 51 percent of manufacturing employment in May 2011, and more than 70 percent of total employment in production occupations was found in manufacturing establishments. Seven of the 10 occupations shown in chart 6 were in the production group, including the largest occupation, team assemblers, with employment of 703,740. The largest manufacturing occupations outside of the production group were laborers and hand freight, stock, and material movers; sales representatives, wholesale and manufacturing, except technical and scientific products; and general maintenance and repair workers. Two of the largest occupations in this industry—team assemblers and laborers and hand freight, stock, and material movers—also were among the occupations with the largest employment declines between May 2007 and May 2011, as shown in chart 4.
The annual mean wage in manufacturing was $46,620, slightly above the U.S. mean. Two of the largest occupations in manufacturing had above-average annual mean wages: sales representatives, wholesale and manufacturing, except technical and scientific products ($66,190) and first-line supervisors of production and operating workers ($56,830). (See chart 6.) Annual mean wages for the remaining occupations in chart 6 ranged from $25,580 for production worker helpers to $42,210 for general maintenance and repair workers.

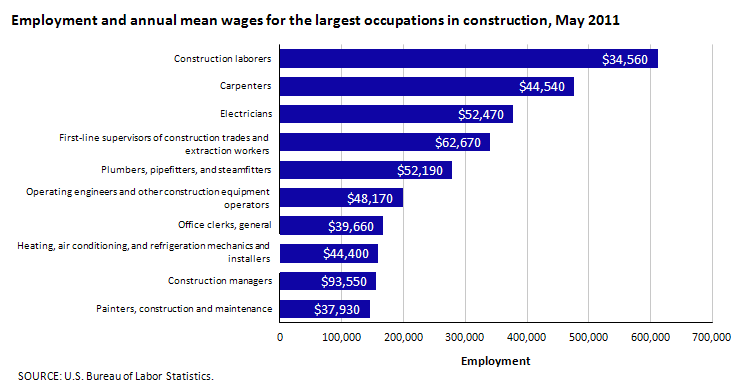
Construction and extraction occupations made up 63 percent of employment in the construction industry. Of the 10 largest occupations in the industry, 8 were in the construction and extraction group, and one was a construction-related management occupation. General office clerks was the largest occupation in the industry that was not directly related to construction. The two largest occupations in the industry were construction laborers and carpenters, with employment of 611,330 and 476,300, respectively. Both of these also were among the occupations with the largest employment declines between 2007 and 2011.
The average wage in the construction industry across all occupations was $48,390. Compared with those occupations in the healthcare and manufacturing industries, more of the largest construction occupations had above-average wages. Five of the 10 largest construction occupations, shown in chart 7, had annual mean wages above the U.S. average, and two others—carpenters and heating, air conditioning, and refrigeration mechanics and installers—had average wages only slightly below the U.S. mean.
The overall occupational composition of the economy closely reflected that of the private sector, which made up more than 80 percent of U.S. employment in 2011. Eight of the 10 largest occupations in the private sector were the same as those in the economy as a whole, as shown in chart 1. Stock clerks and order fillers and general and operations managers, the 11th and 12th largest occupations overall, rounded out the 10 largest private sector occupations, replacing janitors and secretaries. For the largest private sector occupations, private sector employment as a share of total employment ranged from 81 percent of general office clerks and 82 percent of registered nurses to nearly 100 percent of waiters and waitresses and retail salespersons.
Public sector employment was dominated by education occupations. Education, training, and library was the largest occupational group in the public sector, accounting for nearly 1 out of every 3 public sector jobs, and teachers and teacher assistants made up 5 of the 10 largest public sector occupations. (See chart 8.)
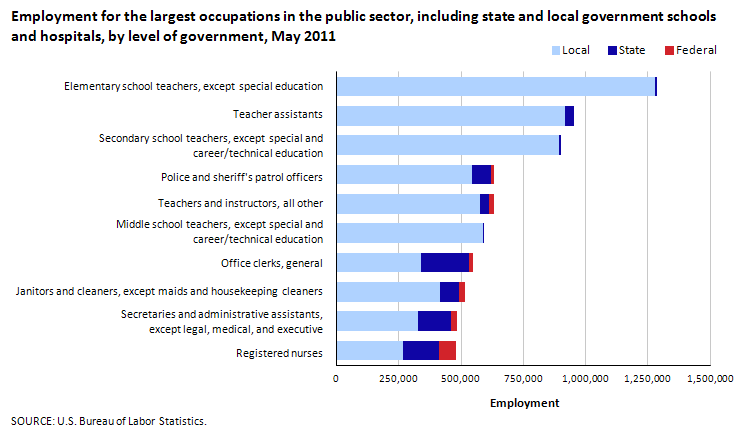
Education jobs were concentrated in local government. Two-thirds of all employment in the education, training, and library occupational group and 86 percent of public sector employment in this group were found in local government. The five teaching occupations in chart 8 also were the five largest occupations in local government, making up a combined 30 percent of local government employment. Nearly all local government employment in education occupations—91 percent—was in elementary and secondary schools.
Education, training, and library occupations also was the largest occupational group in state government, making up about 19 percent of employment. Nearly three-quarters of state government education, training, and library jobs were in colleges, universities, and professional schools, with most of the remainder in junior colleges. The largest education occupations in state government were graduate teaching assistants; postsecondary teachers, all other; and postsecondary health specialties teachers.
If state and local government schools and hospitals are excluded, most of the largest public sector occupations were either protective service occupations or office and administrative support occupations. (See chart 9.) Police and sheriff’s patrol officers, firefighters, and general office clerks were among the largest noneducation occupations in local government. Correctional officers and jailers was the largest occupation in state government, with employment of about 249,000. Other large noneducation occupations in state government included general office clerks; police and sheriff’s patrol officers; and child, family, and school social workers.
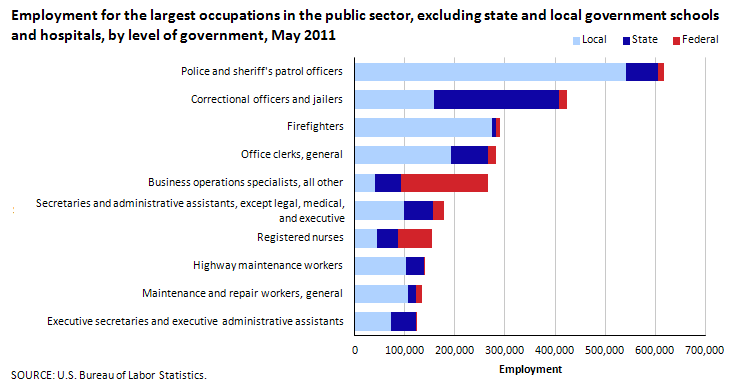
The occupational structure of the federal government differed from those of state and local government. Nearly half of federal employment consisted of office and administrative support occupations or business and financial operations occupations, compared with only 1 percent of federal employment in the education, training, and library group. Only two of the largest federal government occupations—registered nurses and all other business operations specialists—were among the largest public sector occupations overall. Four occupations exclusive to the U.S. Postal Service—postal service mail carriers; postal service mail sorters, processors, and processing machine operators; postal service clerks; and postmasters and mail superintendents—made up about 20 percent of federal government employment. The largest federal government occupations outside of the postal service included management analysts, compliance officers, and transportation security screeners.
Most of the 10 largest occupations in May 2011 were relatively low-paying occupations, such as retail salespersons, cashiers, and general office clerks. Several of the largest occupations also were among those with the highest job gains or losses between 2007 and 2011. Occupations with the highest employment increases included several occupations prevalent in the expanding healthcare and social assistance industry; occupations associated with manufacturing, construction, retail trade, and transportation were among those with the greatest job losses. Although some large occupations such as retail salespersons and waiters and waitresses were found almost entirely in the private sector, the largest public sector occupations were in education and found mainly in local government.
1 Charts 3 and 4 exclude occupations that are not comparable between the 2000 Standard Occupational Classification (SOC) system used in the May 2007 OES data and the 2010 SOC used in the May 2011 data. Occupations may not be comparable between the two systems for several reasons. For example, 2000 SOC occupations may have been split or combined to form 2010 SOC occupations, changes may have been made to the content of an occupation, or title or definitional clarifications may have caused survey respondents to classify workers differently. Although this article presents some limited comparisons of OES data between two periods, in general OES data are not designed for analyzing changes through time, and data users should be cautious in using them for that purpose. More information on using OES data to look at changes through time is available at www.bls.gov/oes/oes_ques.htm#Ques30.
2 Employment trends in specific manufacturing industries during this period may have differed from the trend in manufacturing as a whole. Occupational employment and wage data by detailed industry for 2007 and 2011 can be downloaded from https://www.bls.gov/oes/tables.htm. More recent employment data by industry are available from the Current Employment Statistics program at www.bls.gov/ces/home.htm.
This BEYOND THE NUMBERS report was prepared by Audrey Watson, economist, Occupational Employment Statistics program. Complete OES data, including data highlighted in this report, are available from the OES website at www.bls.gov/oes/. Email: OESinfo@bls.gov; Telephone: (202) 691-6569.
Information in this article will be made available to sensory-impaired individuals upon request. Voice phone: (202) 691-5200. Federal Relay Service: 1-800-877-8339. This article is in the public domain and may be reproduced without permission.
Audrey Watson, Occupational Employment Statistics program, “An overview of U.S. occupational employment and wages in 2011 ,” Beyond the Numbers: Employment & Unemployment, vol. 1 / no. 6 (U.S. Bureau of Labor Statistics, July 2012), https://www.bls.gov/opub/btn/volume-1/an-overview-of-occupational-employment-and-wages-in-2011.htm
Publish Date: Monday, July 30, 2012