
An official website of the United States government
An official website of the United States government
The .gov means it's official.
Federal government websites often end in .gov or .mil. Before sharing sensitive information,
make sure you're on a federal government site.
The site is secure.
The
https:// ensures that you are connecting to the official website and that any
information you provide is encrypted and transmitted securely.

More BLS articles and information related to employee health benefits are available online at the following links:
The national debate over health reform in recent years has brought with it many stories of individuals without sufficient health care coverage for a variety of reasons, including employers not offering coverage, individuals (including those offered a health plan by their employer) unable to afford coverage, and plans that limit coverage of preexisting conditions or cap coverage affecting certain catastrophic conditions. As provisions of the Patient Protection and Affordable Care Act are implemented over the next several years, these circumstances may change. Among employment-based health care benefits, one area where disparity in coverage and plan features currently exists is between smaller and larger establishments.1 Data from the Bureau of Labor Statistics (BLS) highlight these differences.
The BLS National Compensation Survey (NCS) provides information on the availability of benefits (including health benefits), employer costs of benefits, sharing of the cost of health care premiums between employers and employees, and the features of employment-based health benefits. The survey covers workers in private industry and state and local government and reports information by a variety of characteristics, including industry, occupation, and union status.
This issue of Beyond the Numbers compares health benefits data from private sector employers, showing variation between the smallest (those employing 1–49 workers) and the largest (those employing 500 workers or more) establishments in March 2012.2 Over 95 percent of the nearly 8.7 million private sector business establishments in the United States employed fewer than 50 workers in the first quarter of 2011; these establishments employed 47.3 million workers (45 percent of all private industry employment). In contrast, there were slightly fewer than 15,000 private establishments that employed 500 workers or more; less than half of 1 percent of all private workplaces. These largest establishments employed about 17.5 million workers.3 (See table 1.)
| Item | Total | 1–49 workers | 500 workers or more |
|---|---|---|---|
| Number of establishments | 8,692,252 | 8,325,898 | 14,909 |
| Percent of establishments | 100 | 95.8 | 0.2 |
| Number of workers | 106,058,388 | 47,325,995 | 17,480,374 |
| Percent of workers | 100 | 44.6 | 16.5 |
| Source: U.S. Bureau of Labor Statistics, Quarterly Census of Employment and Wages. | |||
Estimates of benefit provisions in this issue are from the BLS publications, National Compensation Survey: Employee Benefits in the United States, March 2012, available online at www.bls.gov/ncs/ebs/benefits/2012, and National Compensation Survey: Health Plan Provisions in Private Industry in the United States, 2011, available online at https://www.bls.gov/ncs/ebs/detailedprovisions/2011/ownership/private/ebbl0051.pdf. Employer cost estimates are from "Employer Costs for Employee Compensation, March 2012," available online at https://www.bls.gov/news.release/archives/ecec_06072012.pdf.
Much of the data available from the NCS look at the percentage of workers with coverage and those whose coverage includes certain plan features. In addition, in recent years, data have been available on the percentage of establishments that offer benefits to at least some of their employees.4 In March 2012, 57 percent of private sector establishments employing 1–49 workers (referred to here as "the smallest establishments") offered health benefits to at least some workers; in contrast, 94 percent of establishments employing 500 workers or more ("the largest establishments") offered health benefits. The data are similar for the proportion of workers offered benefits. In the smallest establishments, 54 percent of workers are offered health care benefits and in the largest establishments, 90 percent of workers are offered such benefits. Policymakers have a keen interest in the extent that benefits are offered to workers, because such information provides an indication of whether there is a need for expanded coverage. Chart 1 shows the percentage of establishments offering benefits and the extent of workers offered benefits, by establishment size.
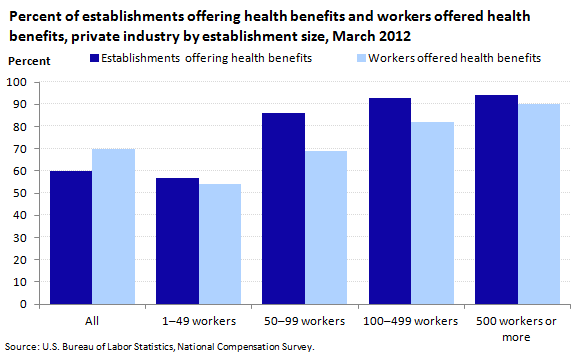
| Measure | All | 1–49 workers | 50–99 workers | 100–499 workers | 500 workers or more |
|---|---|---|---|---|---|
Establishments offering health benefits | 60 | 57 | 86 | 93 | 94 |
Workers offered health benefits | 70 | 54 | 69 | 82 | 90 |
Similar variation exists in the percentage of workers offered dental and vision care benefits, as seen in table 2. About 1 in 4 private industry workers in the smallest establishments are offered dental care benefits; in the largest establishments, dental coverage is offered to nearly 3 in 4 workers. Vision care benefits are offered less frequently to all workers, and again show variation by establishment size (14 percent in smallest establishments and 44 percent in largest establishments).
| Benefit | All workers | 1–49 workers | 50–99 workers | 100–499 workers | 500 workers or more |
|---|---|---|---|---|---|
| Dental benefits | 45 | 26 | 41 | 56 | 73 |
| Vision benefits | 25 | 14 | 25 | 28 | 44 |
| Source: U.S. Bureau of Labor Statistics, National Compensation Survey. | |||||
Medical care benefits often require an employee contribution, which calls for the employee to decide whether or not to obtain coverage.5 Employees may choose not to participate in a plan offered through their work, perhaps due to the high cost; because coverage is available elsewhere (such as through their spouse's plan); or because individuals—often younger workers—don't believe they need coverage. Regardless of the reason, data from the BLS benefits survey show that the "take-up rate," the percentage of workers who actually participate (having agreed to meet all conditions, such as paying required premiums or completing an eligibility period) in a medical plan is 72 percent for all private sector workers, regardless of employment size. Data are similar among the smallest establishments (70 percent take-up rate) and the largest establishments (76 percent take-up rate). Because the percentage of workers who are offered a plan varies by employment size, these similar take-up rates still result in different coverage rates. Only 38 percent of workers in establishments with fewer than 50 workers were covered by medical care benefits in March 2012, compared with 68 percent of those in establishments with 500 workers or more. This disparity is largely the result of the availability of health benefits rather than worker decisions to accept or reject coverage. (See chart 2 for data on coverage and take-up rates by establishment size.)
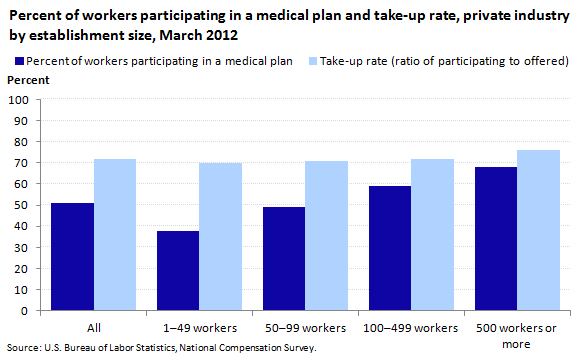
| Measure | All | 1–49 workers | 50–99 workers | 100–499 workers | 500 workers or more |
|---|---|---|---|---|---|
Percent of workers participating in a medical plan | 51 | 38 | 49 | 59 | 68 |
Take-up rate (ratio of participating to offered) | 72 | 70 | 71 | 72 | 76 |
Data from the NCS are available on various aspects of health care costs, including employer costs, the share of total costs borne by the employee and the employer, whether there is a required employee cost, and if so, the amount of employee cost. Interestingly, although there is little difference in employee choice to participate in health care benefits (the take-up rate) by employment size class, some cost estimates do differ by establishment size.
BLS data on employer costs for health care benefits include an index showing the rate of change in such costs over time and the amount of employee cost expressed on a per-hour-worked basis. Data on the rate of change in employer health costs are not available by establishment size, but establishment size data are available for employer cost data expressed as a cost per hour worked. In March 2012, the smallest private sector establishments spent $1.40 per hour worked on health benefits, compared with $3.76 spent by the largest employers. These differences reflect both the extent that benefits are offered to workers and the generosity of those benefits.6 (See table 3.)
| Compensation component | All | 1-49 workers | 50-99 workers | 100-499 workers | 500 workers or more | |||||
|---|---|---|---|---|---|---|---|---|---|---|
| Cost | Percent | Cost | Percent | Cost | Percent | Cost | Percent | Cost | Percent | |
| Total compensation | $28.78 | 100 | $22.92 | 100 | $26.65 | 100 | $29.15 | 100 | $42.33 | 100 |
| Wages | 20.25 | 70.4 | 17.11 | 74.7 | 19.01 | 71.3 | 20.33 | 69.7 | 27.76 | 65.6 |
| Benefits | 8.53 | 29.6 | 5.80 | 25.3 | 7.65 | 28.7 | 8.83 | 30.3 | 14.57 | 34.4 |
| Health insurance | 2.21 | 7.7 | 1.40 | 6.1 | 1.94 | 7.3 | 2.46 | 8.5 | 3.76 | 8.9 |
| Source: U.S. Bureau of Labor Statistics, National Compensation Survey. | ||||||||||
Across all private employers, 82 percent of workers who were offered medical care benefits were required to share in the cost of single coverage and 91 percent of workers were required to share in the cost of family coverage. Chart 3 shows that the smallest establishments were more likely to provide single coverage at no cost to the employee (25 percent) and free coverage was less likely among the largest establishments (13 percent). For family coverage, there was little difference in the proportion with no employee cost (12 percent, compared with 10 percent).
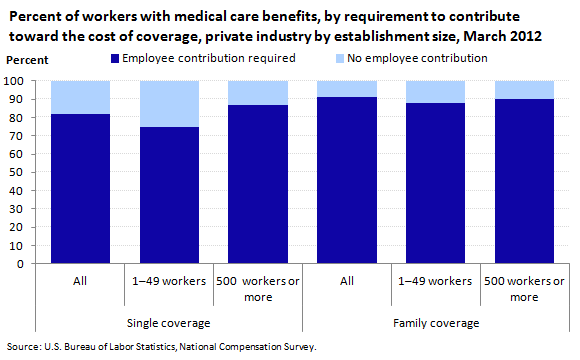
| Contribution requirement | Single coverage | Family coverage | ||||
|---|---|---|---|---|---|---|
| All | 1–49 workers | 500 workers or more | All | 1–49 workers | 500 workers or more | |
Employee contribution required | 82 | 75 | 87 | 91 | 88 | 90 |
No employee contribution | 18 | 25 | 13 | 9 | 12 | 10 |
From another perspective, there was little difference by employment size in the share of the cost of single medical care benefits borne by employers and employees; in both small and large establishments, employers paid about 80 percent of the cost. Conversely, there was a greater difference in the share of costs for family coverage by establishment size. In the smallest establishments, employers paid 63 percent of the cost of family coverage and in the largest establishments, employers paid 77 percent of the cost of family coverage. This apparent inconsistency between the extent of free benefits (showing variation for single coverage but not family coverage) and the employer/employee share of cost (showing variation for family coverage but not single coverage) may be the result of differences in plan features. For example, smaller establishments may offer less costly plans (such as those with higher deductibles) at no cost to employees.
The actual amount that employees paid for their share of coverage varied by employment size for both single and family coverage. The median employee premium for single coverage in the smallest establishments was $101.00 per month, about 20 percent higher than in the largest establishments (median of $82.83 per month). For family coverage, the median employee premium of $420.51 per month in the smallest establishments was about 45 percent higher than in the largest establishments (median of $288.15 per month).
One additional restriction to medical care coverage that may be imposed by employers is an eligibility requirement; a period of time employees, once hired, are required to wait before they can join the plan. In 2011, two-thirds (67 percent) of those in the smallest establishments had such a requirement, compared with about half (49 percent) of those in the largest establishments. The median service requirement was 3 months in the smallest establishments and 2 months in the largest establishments. (Note that for about 15 percent of plan participants, regardless of establishment size, the presence of an eligibility requirement could not be determined.)
Once employees are covered by medical care plans, regardless of the cost, there continues to be variations by employment size. Many of the services covered by medical care plans were similar for all plans, including hospitalization, surgery, physician visits, certain nonhospital care (such as nursing homes and home health care), mental health and substance abuse treatment, prescription drugs, and other services. Where plans may differ is in the cost sharing for receipt of services. Notably, employees in the smallest establishments are covered by high-deductible health plans more often than those in the largest establishments. High-deductible health plans are a relatively new type of plan often coupled with an account that can be used by the employee to pay for certain out-of-pocket expenses.
Among the smallest private sector establishments, 32 percent of workers participating in medical care plans were covered by high-deductible plans in 2011. In contrast, only 12 percent of workers in the largest establishments were covered by such plans. (See chart 4.) Further, the median deductible in such high-deductible plans was greater in the smallest establishments—$2,000 per year, compared with $1,500 per year among high-deductible plans in the largest establishments.
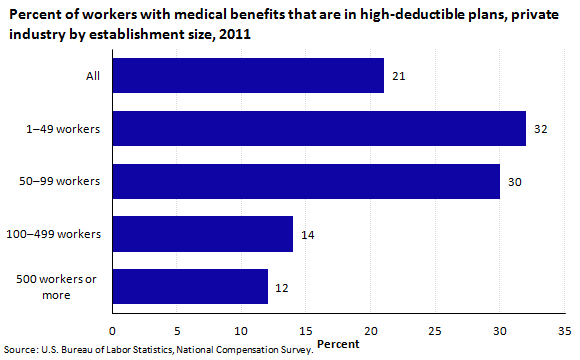
| Establishment size | Percent with high-deductible plans |
|---|---|
All | 21 |
1–49 workers | 32 |
50–99 workers | 30 |
100–499 workers | 14 |
500 workers or more | 12 |
Cost data are not available separately for high-deductible plans, but differences in employer premiums by establishment size may be due in part to the presence of high-deductible plans. For single coverage, average monthly employer premiums were $381.45 in the largest establishments, compared with $345.93 in the smallest establishments in March 2012. An even greater difference is seen in family coverage—$1,002.72 in the largest establishments, compared with $754.66 in the smallest establishments.
The survey identified a few additional differences in cost-sharing features based on establishment size.
These data suggest that employees in the smallest establishments are offered health benefits less often than their counterparts in the largest establishments, and when offered coverage, employees in the smallest establishments have greater cost-sharing requirements (both in terms of plan premiums and payments for services). These data provide a benchmark to track as features of the Patient Protection and Affordable Care Act are implemented over the next few years.
This Beyond the Numbers article was prepared by William J. Wiatrowski, economist in the Office of Compensation and Working Conditions, Washington, DC. Email: wiatrowski.william@bls.gov. For more benefits information, see www.bls.gov/ebs. For additional assistance, contact one of our information offices: National-Washington, DC: (202) 691-6199, TDD (800) 877-8339; Atlanta (404) 893-4222; Boston: (617) 565-2327; Chicago: (312) 353-1880; Dallas: (972) 850-4800; Kansas City: (816) 285-7000; New York: (646) 264-3600; Philadelphia: (215) 597-3282; San Francisco: (415) 625-2270.
Information in this article will be made available to sensory-impaired individuals upon request. Voice phone: (202) 691-5200. Federal Relay Service: 1 (800) 877-8339. This article is in the public domain and may be reproduced without permission.
William J. Wiatrowski, “Employment-based health benefits in small and large private establishments ,” Beyond the Numbers: Pay & Benefits, vol. 2 / no. 8 (U.S. Bureau of Labor Statistics, April 2013), https://www.bls.gov/opub/btn/volume-2/employment-based-health-benefits-in-small-and-large-private-establishments.htm
1 It is important to note two constraints in reviewing these data. First, the unit of observation for data collection is an establishment, defined as a single physical location. In some cases, an establishment may be part of a larger enterprise (such as a small warehouse associated with a multi-location manufacturing firm). Thus, although the establishment may be classified along with other small establishments, it may in fact be part of a larger enterprise and have features (such as benefit coverage and cost) that resemble a large company.
Second, the sample size of the NCS limits the extent that comparisons can be made. Data are available for several establishment-size groupings, from the smallest (1 to 49 workers) to the largest (500 workers or more). Statements of comparison are only provided in this analysis if they pass statistical tests for comparison with 90 percent confidence. Thus, most comparisons are between the smallest and the largest group, not at the groupings in between. Although there is often a general progression of the data from smallest to largest establishments, the sample size does not support statements of comparison within each of these groups.
2 All data on the availability of benefits and employer and employee costs reflect employer practices as of March 2012. Certain data on plan features, such as deductibles and covered services, reflect employer practices in 2011. Information about the National Compensation Survey is available at https://www.bls.gov/ncs/.
3 Data on number of establishments and employment by establishment size are from the BLS Quarterly Census of Employment and Wages, available at https://www.bls.gov/cew/. See table 3, https://www.bls.gov/cew/publications/employment-and-wages-annual-averages/2011/home.htm.
4 Many employers offer health benefits to their entire workforce, but some employers limit their offerings to certain groups of workers, such as full-time workers. The survey includes a question that asks simply if health benefits are offered to at least some workers.
5 For certain statistics presented here, a distinction is made between medical care benefits and health care benefits. Medical care benefits are defined as coverage including hospitalization, surgery, physician visits, and related services. BLS also captures data for ancillary services, such as separate dental care, vision care, or outpatient prescription drug benefits. Certain data such as employer costs are available for all medical, dental, vision, and outpatient prescription drug benefits combined, referred to collectively as health benefits. This article distinguishes between "medical care" benefits (when the data are specifically for medical services) and "health care" benefits (when the data refer to the combination of medical, dental, vision, and outpatient prescription drug services).
Publish Date: Friday, April 05, 2013