An official website of the United States government
An official website of the United States government
The .gov means it's official.
Federal government websites often end in .gov or .mil. Before sharing sensitive information,
make sure you're on a federal government site.
The site is secure.
The
https:// ensures that you are connecting to the official website and that any
information you provide is encrypted and transmitted securely.
The Current Employment Statistics program publishes detailed employment data each month. Because the data are subject to multiple revisions, end users often need access to information that details how the data have changed over time. Vintage data tables are a valuable tool, providing users with all published data, from original estimates to the most up-to-date figures.
Each month, the Current Employment Statistics (CES) program surveys approximately 143,000 businesses and government agencies, representing approximately 588,000 work sites, for detailed employment data. The initial publication of these data generally attracts the most attention, however, these are mere preliminary estimates that will be revised multiple times before they are finalized. New data are collected for up to 2 months after original publication and incorporated in the sample. Once this early data collection is complete, the numbers are subject to further revisions through annual benchmarking and seasonal readjustment.1 Vintage data tables complete the historical record by preserving accurate, point-in-time CES data, from original estimates to the most recent updated data.
Vintage data tables offer a historical breakdown of CES data; they show the first estimates published, as well as over-the-month changes (both seasonally and not seasonally adjusted) for a given reference month. The tables show all available estimates dating back to the start of each series. For example, data on total nonfarm employment dates back to January 1939, the series’ start date. Total nonfarm and supersector employment tables are available in Excel 2013 file format. Vintage data tables for additional industries are available, and can be converted to Excel format with the use of the Excel template.
The structure of the vintage data can be seen in Table 1, where the selected cell (here highlighted in red) references the January 1939 value for the May 2003 employment release. The yellow row is the reference month and to see how the values have revised over time, move down the column. For your convenience, the May 2003 value (or first preliminary release if reference month after May 2003), the third preliminary release (or May 2003 value if reference month before June 2003), and the December 2014 values are located directly under the reference month in light blue.
| Relating to period | Jan 1939 | Feb 1939 | Mar 1939 | Apr 1939 | May 1939 | Jun 1939 |
|---|---|---|---|---|---|---|
| First preliminary release (or May 2003) | 29,923 | 30,100 | 30,280 | 30,094 | 30,300 | 30,502 |
| Third preliminary release (or May 2003) | 29,923 | 30,100 | 30,280 | 30,094 | 30,300 | 30,502 |
| December 2014 release | 29,923 | 30,101 | 30,280 | 30,094 | 30,300 | 30,502 |
| May 2003 | 29,923 | 30,100 | 30,280 | 30,094 | 30,300 | 30,502 |
| Jun 2003 | 29,923 | 30,100 | 30,280 | 30,094 | 30,300 | 30,502 |
| Jul 2003 | 29,923 | 30,100 | 30,280 | 30,094 | 30,300 | 30,502 |
| Aug 2003 | 29,923 | 30,100 | 30,280 | 30,094 | 30,300 | 30,502 |
| Sep 2003 | 29,923 | 30,100 | 30,280 | 30,094 | 30,300 | 30,502 |
| Oct 2003 | 29,923 | 30,100 | 30,280 | 30,094 | 30,300 | 30,502 |
| Nov 2003 | 29,923 | 30,100 | 30,280 | 30,094 | 30,300 | 30,502 |
| Dec 2003 | 29,923 | 30,100 | 30,280 | 30,094 | 30,300 | 30,502 |
| Jan 2004 | 29,923 | 30,100 | 30,280 | 30,094 | 30,300 | 30,502 |
| Feb 2004 | 29,923 | 30,100 | 30,280 | 30,094 | 30,300 | 30,502 |
| Mar 2004 | 29,923 | 30,100 | 30,280 | 30,094 | 30,300 | 30,502 |
| Apr 2004 | 29,923 | 30,100 | 30,280 | 30,094 | 30,300 | 30,502 |
| May 2004 | 29,923 | 30,100 | 30,280 | 30,094 | 30,300 | 30,502 |
| Jun 2004 | 29,923 | 30,100 | 30,280 | 30,094 | 30,300 | 30,502 |
| Jul 2004 | 29,923 | 30,100 | 30,280 | 30,094 | 30,300 | 30,502 |
| Aug 2004 | 29,923 | 30,100 | 30,280 | 30,094 | 30,300 | 30,502 |
| Sep 2004 | 29,923 | 30,100 | 30,280 | 30,094 | 30,300 | 30,502 |
| Oct 2004 | 29,923 | 30,100 | 30,280 | 30,094 | 30,300 | 30,502 |
| Nov 2004 | 29,923 | 30,100 | 30,280 | 30,094 | 30,300 | 30,502 |
| Dec 2004 | 29,923 | 30,100 | 30,280 | 30,094 | 30,300 | 30,502 |
| Jan 2005 | 29,923 | 30,100 | 30,280 | 30,094 | 30,300 | 30,502 |
| Source: U.S. Bureau of Labor Statistics. | ||||||
Vintage data tables show all published versions of the data since the May 2003 first preliminary estimates, when CES finished switching from a quota based sample to a probability based sample and replaced the Standard Industrial Classification System (SIC) with the North American Industrial Classification System (NAICS).2 For all earlier reference months, May 2003 values represent the first and third preliminary estimates.
Many CES data users are concerned with access to the most up-to-date revisions to monthly estimates. To accommodate such users, employment levels and over-the-month changes (of both seasonally and not seasonally adjusted data) are available in vintage data tables. The data published in these tables are subject to three types of revisions—monthly revisions, annual benchmarks, and historical reconstructions.
The CES program begins collecting sample reports for a given month as soon as the reference period (the pay period that includes the 12th of the month for the responding establishment) is complete. The collection time for preliminary estimates ranges from 10 to 16 days, depending on the date scheduled for the Employment Situation news release. Because this preliminary collection cycle is so brief, many establishments are unable to provide the requested data in time to be included with the primary estimates. Monthly revisions bridge the gap between the CES program’s twin goals of timely publication and accurate reporting.
After the first estimates are published, sample responses for the reference month are continuously collected throughout the next 2 months. These new responses are reported in the second and third preliminary estimates published in subsequent months. Second preliminary estimates for a reference month are published in the month following the initial release. Third preliminary estimates, the final sample-based estimates, are published 2 months after the initial release. Additional sample receipts are the primary source of the monthly CES employment revisions. However, seasonal adjustments can also affect revisions to seasonally-adjusted data.3
| Reference month | First preliminary release | Third preliminary release | December 2014 release |
|---|---|---|---|
| Mar 2003 | 130084 | 130084 | 130212 |
| Apr 2003 | 130084 | 130062 | 130167 |
| May 2003 | 130067 | 129986 | 130156 |
| Jun 2003 | 129962 | 129903 | 130166 |
| Jul 2003 | 129870 | 129846 | 130189 |
| Aug 2003 | 129761 | 129881 | 130148 |
| Sep 2003 | 129862 | 129980 | 130250 |
| Oct 2003 | 130132 | 130080 | 130446 |
| Nov 2003 | 130174 | 130027 | 130462 |
| Dec 2003 | 130124 | 130035 | 130586 |
| Jan 2004 | 130155 | 130194 | 130747 |
| Feb 2004 | 130153 | 130277 | 130791 |
| Mar 2004 | 130548 | 130630 | 131123 |
| Apr 2004 | 130902 | 130954 | 131372 |
| May 2004 | 131224 | 131162 | 131679 |
| Jun 2004 | 131301 | 131258 | 131753 |
| Jul 2004 | 131272 | 131343 | 131785 |
| Aug 2004 | 131475 | 131541 | 131917 |
| Sep 2004 | 131567 | 131660 | 132079 |
| Oct 2004 | 132017 | 131972 | 132425 |
| Nov 2004 | 132075 | 132294 | 132490 |
| Dec 2004 | 132266 | 132449 | 132619 |
| Jan 2005 | 132573 | 132573 | 132753 |
| Feb 2005 | 132843 | 132873 | 132992 |
| Mar 2005 | 132926 | 132995 | 133126 |
| Apr 2005 | 133293 | 133287 | 133489 |
| May 2005 | 133347 | 133413 | 133664 |
| Jun 2005 | 133537 | 133588 | 133909 |
| Jul 2005 | 133786 | 133865 | 134282 |
| Aug 2005 | 133999 | 134013 | 134478 |
| Sep 2005 | 134041 | 134030 | 134545 |
| Oct 2005 | 134061 | 134055 | 134629 |
| Nov 2005 | 134289 | 134231 | 134966 |
| Dec 2005 | 134468 | 134376 | 135125 |
| Jan 2006 | 134564 | 134530 | 135402 |
| Feb 2006 | 134789 | 134730 | 135717 |
| Mar 2006 | 134966 | 134905 | 135997 |
| Apr 2006 | 135068 | 135017 | 136179 |
| May 2006 | 135106 | 135117 | 136202 |
| Jun 2006 | 135230 | 135251 | 136279 |
| Jul 2006 | 135354 | 135374 | 136486 |
| Aug 2006 | 135500 | 135604 | 136670 |
| Sep 2006 | 135613 | 135807 | 136827 |
| Oct 2006 | 135844 | 135893 | 136829 |
| Nov 2006 | 136018 | 136941 | 137039 |
| Dec 2006 | 136214 | 137167 | 137210 |
| Jan 2007 | 137258 | 137329 | 137448 |
| Feb 2007 | 137410 | 137419 | 137536 |
| Mar 2007 | 137622 | 137594 | 137724 |
| Apr 2007 | 137684 | 137716 | 137802 |
| May 2007 | 137831 | 137904 | 137946 |
| Jun 2007 | 138038 | 137973 | 138017 |
| Jul 2007 | 138122 | 138066 | 137984 |
| Aug 2007 | 138037 | 138159 | 137968 |
| Sep 2007 | 138265 | 138203 | 138053 |
| Oct 2007 | 138421 | 138362 | 138135 |
| Nov 2007 | 138467 | 138037 | 138253 |
| Dec 2007 | 138495 | 138078 | 138350 |
| Jan 2008 | 138102 | 138002 | 138365 |
| Feb 2008 | 137993 | 137919 | 138279 |
| Mar 2008 | 137846 | 137831 | 138199 |
| Apr 2008 | 137818 | 137764 | 137985 |
| May 2008 | 137754 | 137717 | 137803 |
| Jun 2008 | 137640 | 137617 | 137631 |
| Jul 2008 | 137615 | 137550 | 137421 |
| Aug 2008 | 137473 | 137423 | 137162 |
| Sep 2008 | 137318 | 137020 | 136710 |
| Oct 2008 | 136899 | 136597 | 136236 |
| Nov 2008 | 136167 | 135755 | 135471 |
| Dec 2008 | 135489 | 135074 | 134774 |
| Jan 2009 | 134580 | 134333 | 133976 |
| Feb 2009 | 133768 | 133652 | 133275 |
| Mar 2009 | 133019 | 133000 | 132449 |
| Apr 2009 | 132414 | 132481 | 131765 |
| May 2009 | 132151 | 132178 | 131411 |
| Jun 2009 | 131692 | 131715 | 130944 |
| Jul 2009 | 131488 | 131411 | 130617 |
| Aug 2009 | 131223 | 131257 | 130401 |
| Sep 2009 | 130947 | 131118 | 130174 |
| Oct 2009 | 130848 | 130991 | 129976 |
| Nov 2009 | 130996 | 129697 | 129970 |
| Dec 2009 | 130910 | 129588 | 129687 |
| Jan 2010 | 129527 | 129602 | 129705 |
| Feb 2010 | 129526 | 129641 | 129655 |
| Mar 2010 | 129750 | 129849 | 129811 |
| Apr 2010 | 130161 | 130162 | 130062 |
| May 2010 | 130570 | 130594 | 130578 |
| Jun 2010 | 130470 | 130419 | 130456 |
| Jul 2010 | 130242 | 130353 | 130395 |
| Aug 2010 | 130311 | 130352 | 130353 |
| Sep 2010 | 130201 | 130328 | 130296 |
| Oct 2010 | 130462 | 130538 | 130537 |
| Nov 2010 | 130539 | 130108 | 130674 |
| Dec 2010 | 130712 | 130260 | 130745 |
| Jan 2011 | 130265 | 130328 | 130815 |
| Feb 2011 | 130515 | 130563 | 130983 |
| Mar 2011 | 130738 | 130757 | 131195 |
| Apr 2011 | 131028 | 130974 | 131517 |
| May 2011 | 131043 | 131027 | 131619 |
| Jun 2011 | 131017 | 131047 | 131836 |
| Jul 2011 | 131190 | 131174 | 131942 |
| Aug 2011 | 131132 | 131278 | 132064 |
| Sep 2011 | 131334 | 131488 | 132285 |
| Oct 2011 | 131516 | 131600 | 132468 |
| Nov 2011 | 131708 | 131963 | 132632 |
| Dec 2011 | 131900 | 132186 | 132828 |
| Jan 2012 | 132409 | 132461 | 133188 |
| Feb 2012 | 132697 | 132720 | 133414 |
| Mar 2012 | 132821 | 132863 | 133657 |
| Apr 2012 | 132989 | 132931 | 133753 |
| May 2012 | 133009 | 133018 | 133863 |
| Jun 2012 | 133088 | 133063 | 133951 |
| Jul 2012 | 133245 | 133244 | 134111 |
| Aug 2012 | 133300 | 133436 | 134261 |
| Sep 2012 | 133500 | 133568 | 134422 |
| Oct 2012 | 133755 | 133705 | 134647 |
| Nov 2012 | 133852 | 134472 | 134850 |
| Dec 2012 | 134021 | 134691 | 135064 |
| Jan 2013 | 134825 | 134839 | 135261 |
| Feb 2013 | 135046 | 135171 | 135541 |
| Mar 2013 | 135195 | 135313 | 135682 |
| Apr 2013 | 135474 | 135512 | 135885 |
| May 2013 | 135637 | 135688 | 136084 |
| Jun 2013 | 135902 | 135860 | 136285 |
| Jul 2013 | 136038 | 135949 | 136434 |
| Aug 2013 | 136133 | 136187 | 136636 |
| Sep 2013 | 136290 | 136362 | 136800 |
| Oct 2013 | 136554 | 136562 | 137037 |
| Nov 2013 | 136765 | 137311 | 137311 |
| Dec 2013 | 136877 | 137395 | 137395 |
| Jan 2014 | 137499 | 137539 | 137539 |
| Feb 2014 | 137699 | 137761 | 137761 |
| Mar 2014 | 137928 | 137964 | 137964 |
| Apr 2014 | 138252 | 138268 | 138268 |
| May 2014 | 138463 | 138497 | 138497 |
| Jun 2014 | 138780 | 138764 | 138764 |
| Jul 2014 | 139004 | 139007 | 139007 |
| Aug 2014 | 139118 | 139210 | 139210 |
| Sep 2014 | 139435 | 139481 | 139481 |
| Oct 2014 | 139680 | 139742 | 139742 |
| Nov 2014 | 140045 | * | 140095 |
| Dec 2014 | 140347 | * | 140347 |
| * undefined | |||
| Reference month | First preliminary release | Third preliminary release | December 2014 release |
|---|---|---|---|
| Apr 2003 | 0 | -22 | -45 |
| May 2003 | -17 | -76 | -11 |
| Jun 2003 | -30 | -83 | 10 |
| Jul 2003 | -44 | -57 | 23 |
| Aug 2003 | -93 | 35 | -41 |
| Sep 2003 | 57 | 99 | 102 |
| Oct 2003 | 126 | 100 | 196 |
| Nov 2003 | 57 | 83 | 16 |
| Dec 2003 | 1 | 8 | 124 |
| Jan 2004 | 112 | 159 | 161 |
| Feb 2004 | 21 | 83 | 44 |
| Mar 2004 | 308 | 353 | 332 |
| Apr 2004 | 288 | 324 | 249 |
| May 2004 | 248 | 208 | 307 |
| Jun 2004 | 112 | 96 | 74 |
| Jul 2004 | 32 | 85 | 32 |
| Aug 2004 | 144 | 198 | 132 |
| Sep 2004 | 96 | 119 | 162 |
| Oct 2004 | 337 | 312 | 346 |
| Nov 2004 | 112 | 132 | 65 |
| Dec 2004 | 157 | 155 | 129 |
| Jan 2005 | 146 | 124 | 134 |
| Feb 2005 | 262 | 300 | 239 |
| Mar 2005 | 110 | 122 | 134 |
| Apr 2005 | 274 | 292 | 363 |
| May 2005 | 78 | 126 | 175 |
| Jun 2005 | 146 | 175 | 245 |
| Jul 2005 | 207 | 277 | 373 |
| Aug 2005 | 169 | 148 | 196 |
| Sep 2005 | -35 | 17 | 67 |
| Oct 2005 | 56 | 25 | 84 |
| Nov 2005 | 215 | 354 | 337 |
| Dec 2005 | 108 | 145 | 159 |
| Jan 2006 | 193 | 154 | 277 |
| Feb 2006 | 243 | 200 | 315 |
| Mar 2006 | 211 | 175 | 280 |
| Apr 2006 | 138 | 112 | 182 |
| May 2006 | 75 | 100 | 23 |
| Jun 2006 | 121 | 134 | 77 |
| Jul 2006 | 113 | 123 | 207 |
| Aug 2006 | 128 | 230 | 184 |
| Sep 2006 | 51 | 203 | 157 |
| Oct 2006 | 92 | 86 | 2 |
| Nov 2006 | 132 | 196 | 210 |
| Dec 2006 | 167 | 226 | 171 |
| Jan 2007 | 111 | 162 | 238 |
| Feb 2007 | 97 | 90 | 88 |
| Mar 2007 | 180 | 175 | 188 |
| Apr 2007 | 88 | 122 | 78 |
| May 2007 | 157 | 188 | 144 |
| Jun 2007 | 132 | 69 | 71 |
| Jul 2007 | 92 | 93 | -33 |
| Aug 2007 | -4 | 93 | -16 |
| Sep 2007 | 110 | 44 | 85 |
| Oct 2007 | 166 | 159 | 82 |
| Nov 2007 | 94 | 60 | 118 |
| Dec 2007 | 18 | 41 | 97 |
| Jan 2008 | -17 | -76 | 15 |
| Feb 2008 | -63 | -83 | -86 |
| Mar 2008 | -80 | -88 | -80 |
| Apr 2008 | -20 | -67 | -214 |
| May 2008 | -49 | -47 | -182 |
| Jun 2008 | -62 | -100 | -172 |
| Jul 2008 | -51 | -67 | -210 |
| Aug 2008 | -84 | -127 | -259 |
| Sep 2008 | -159 | -403 | -452 |
| Oct 2008 | -240 | -423 | -474 |
| Nov 2008 | -533 | -597 | -765 |
| Dec 2008 | -524 | -681 | -697 |
| Jan 2009 | -598 | -741 | -798 |
| Feb 2009 | -651 | -681 | -701 |
| Mar 2009 | -663 | -652 | -826 |
| Apr 2009 | -539 | -519 | -684 |
| May 2009 | -345 | -303 | -354 |
| Jun 2009 | -467 | -463 | -467 |
| Jul 2009 | -247 | -304 | -327 |
| Aug 2009 | -216 | -154 | -216 |
| Sep 2009 | -263 | -139 | -227 |
| Oct 2009 | -190 | -127 | -198 |
| Nov 2009 | -11 | 64 | -6 |
| Dec 2009 | -85 | -109 | -283 |
| Jan 2010 | -20 | 14 | 18 |
| Feb 2010 | -36 | 39 | -50 |
| Mar 2010 | 162 | 208 | 156 |
| Apr 2010 | 290 | 313 | 251 |
| May 2010 | 431 | 432 | 516 |
| Jun 2010 | -125 | -175 | -122 |
| Jul 2010 | -131 | -66 | -61 |
| Aug 2010 | -54 | -1 | -42 |
| Sep 2010 | -95 | -24 | -57 |
| Oct 2010 | 151 | 210 | 241 |
| Nov 2010 | 39 | 93 | 137 |
| Dec 2010 | 103 | 152 | 71 |
| Jan 2011 | 36 | 68 | 70 |
| Feb 2011 | 192 | 235 | 168 |
| Mar 2011 | 216 | 194 | 212 |
| Apr 2011 | 244 | 217 | 322 |
| May 2011 | 54 | 53 | 102 |
| Jun 2011 | 18 | 20 | 217 |
| Jul 2011 | 117 | 127 | 106 |
| Aug 2011 | 0 | 104 | 122 |
| Sep 2011 | 103 | 210 | 221 |
| Oct 2011 | 80 | 112 | 183 |
| Nov 2011 | 120 | 157 | 164 |
| Dec 2011 | 200 | 223 | 196 |
| Jan 2012 | 243 | 275 | 360 |
| Feb 2012 | 227 | 259 | 226 |
| Mar 2012 | 120 | 143 | 243 |
| Apr 2012 | 115 | 68 | 96 |
| May 2012 | 69 | 87 | 110 |
| Jun 2012 | 80 | 45 | 88 |
| Jul 2012 | 163 | 181 | 160 |
| Aug 2012 | 96 | 192 | 150 |
| Sep 2012 | 114 | 132 | 161 |
| Oct 2012 | 171 | 137 | 225 |
| Nov 2012 | 146 | 247 | 203 |
| Dec 2012 | 155 | 219 | 214 |
| Jan 2013 | 157 | 148 | 197 |
| Feb 2013 | 236 | 332 | 280 |
| Mar 2013 | 88 | 142 | 141 |
| Apr 2013 | 165 | 199 | 203 |
| May 2013 | 175 | 176 | 199 |
| Jun 2013 | 195 | 172 | 201 |
| Jul 2013 | 162 | 89 | 149 |
| Aug 2013 | 169 | 238 | 202 |
| Sep 2013 | 148 | 175 | 164 |
| Oct 2013 | 204 | 200 | 237 |
| Nov 2013 | 203 | 274 | 274 |
| Dec 2013 | 74 | 84 | 84 |
| Jan 2014 | 113 | 144 | 144 |
| Feb 2014 | 175 | 222 | 222 |
| Mar 2014 | 192 | 203 | 203 |
| Apr 2014 | 288 | 304 | 304 |
| May 2014 | 217 | 229 | 229 |
| Jun 2014 | 288 | 267 | 267 |
| Jul 2014 | 209 | 243 | 243 |
| Aug 2014 | 142 | 203 | 203 |
| Sep 2014 | 248 | 271 | 271 |
| Oct 2014 | 214 | 261 | 261 |
| Nov 2014 | 321 | * | 353 |
| Dec 2014 | 252 | * | 252 |
| * undefined | |||
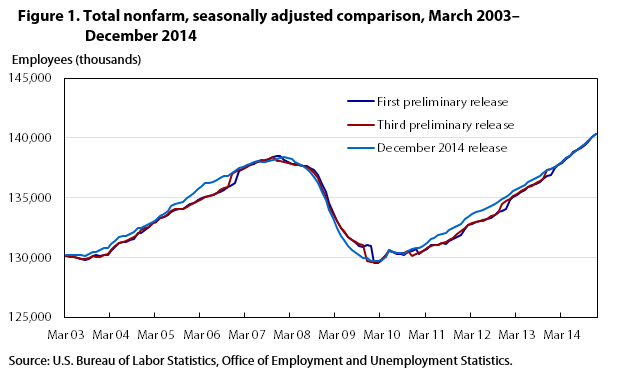
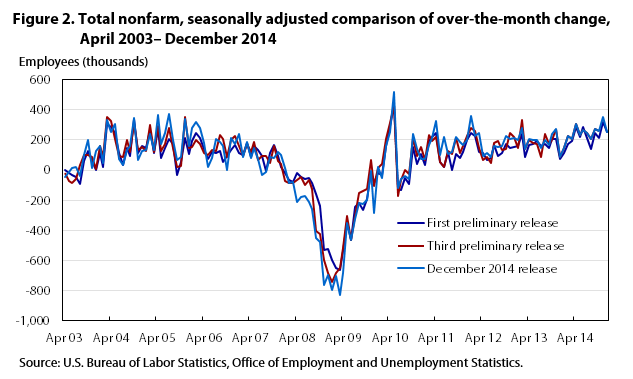
Figures 1 and 2 graph data from the first preliminary release alongside the third preliminary release and the most recent data (December 2014 preliminary estimates) displayed in the spreadsheet. Monthly revisions are captured in the difference between the first and third preliminary releases.
Sample-based estimates remain final until employment levels are adjusted to reflect universe employment counts, or benchmarks, for March of each year; the benchmarks are primarily derived from Unemployment Insurance (UI) tax records.4 The annual benchmarking process results in revised data back to the last annual benchmark for not seasonally adjusted series and back five years for seasonally adjusted series.
The population counts used to establish benchmarks are much less timely than sample-based estimates and are used to provide an annual point-in-time census for employment. March sample-based estimates are replaced with UI counts, while monthly estimates for the year preceding the March benchmark are readjusted with a "wedge” procedure in which the difference between the most recent benchmark revision and the previously published March estimate, is calculated and spread back across the prior 11 months. Estimates for the 7 months that follow the March benchmark (April through October) are recalculated each year to reflect the monthly changes to the March benchmark levels for March and the re-computation of business birth/death factors for each month’s data.
Annual CES benchmark revisions are published in February of each year. In the last 10 years, the largest benchmark revision occurred in January 2010; that revision shows the revisions associated with the period of employment relating to the peak and trough of the 2007 to 2009 recession.
Historical reconstructions are major revisions to CES data that occur in response to atypical survey changes, such as updates to the North American Industrial Classification System (NAICS) or changes to sampling methodology. As the official employment time series, the CES program revises historical data so comparisons are based on similar methodology and classifications. These revisions, often the largest source of change, are identified in the comments provided with the data.
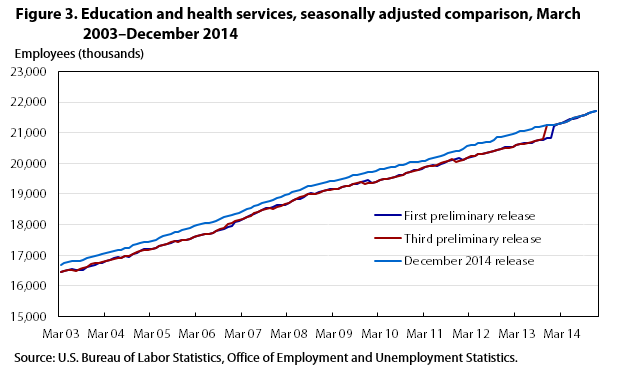
In 2013, the reclassification of 466,000 Education and Health Services industry employees required one of the largest historical reconstructions conducted by the CES program. The Quarterly Census of Employment and Wages (QCEW) program determined that UI records had been improperly classified. UI records of state funding programs that should have been classified as part of the Services for the elderly and disabled, NAICS 624120, were incorrectly classified, as part of the Private households industry, NAICS 814. In the first quarter of 2013, QCEW began recoding this employment under NAICS 624120, which moved the employment from a previously out-of-scope industry (not in the CES sample) to an in-scope industry for the CES program. This prompted a historical reconstruction to account for the employment in these misclassified state-administered programs. (See figure 3.)
| Reference month | First preliminary release | Third preliminary release | December 2014 release |
|---|---|---|---|
| Mar 2003 | 16452 | 16452 | 16692 |
| Apr 2003 | 16498 | 16483 | 16757 |
| May 2003 | 16516 | 16509 | 16794 |
| Jun 2003 | 16533 | 16503 | 16806 |
| Jul 2003 | 16503 | 16487 | 16813 |
| Aug 2003 | 16525 | 16541 | 16820 |
| Sep 2003 | 16521 | 16570 | 16851 |
| Oct 2003 | 16625 | 16625 | 16903 |
| Nov 2003 | 16660 | 16705 | 16945 |
| Dec 2003 | 16674 | 16731 | 16983 |
| Jan 2004 | 16756 | 16746 | 17015 |
| Feb 2004 | 16756 | 16764 | 17032 |
| Mar 2004 | 16806 | 16813 | 17080 |
| Apr 2004 | 16836 | 16854 | 17114 |
| May 2004 | 16896 | 16871 | 17149 |
| Jun 2004 | 16930 | 16897 | 17162 |
| Jul 2004 | 16911 | 16901 | 17184 |
| Aug 2004 | 16958 | 16965 | 17232 |
| Sep 2004 | 16950 | 16980 | 17223 |
| Oct 2004 | 17046 | 17049 | 17325 |
| Nov 2004 | 17067 | 17108 | 17350 |
| Dec 2004 | 17133 | 17142 | 17395 |
| Jan 2005 | 17190 | 17178 | 17427 |
| Feb 2005 | 17193 | 17186 | 17437 |
| Mar 2005 | 17212 | 17210 | 17462 |
| Apr 2005 | 17244 | 17243 | 17501 |
| May 2005 | 17284 | 17289 | 17561 |
| Jun 2005 | 17327 | 17336 | 17615 |
| Jul 2005 | 17353 | 17377 | 17670 |
| Aug 2005 | 17407 | 17418 | 17705 |
| Sep 2005 | 17476 | 17455 | 17742 |
| Oct 2005 | 17462 | 17443 | 17765 |
| Nov 2005 | 17481 | 17481 | 17813 |
| Dec 2005 | 17505 | 17507 | 17844 |
| Jan 2006 | 17542 | 17544 | 17895 |
| Feb 2006 | 17604 | 17585 | 17947 |
| Mar 2006 | 17616 | 17622 | 17992 |
| Apr 2006 | 17656 | 17650 | 18016 |
| May 2006 | 17699 | 17676 | 18047 |
| Jun 2006 | 17708 | 17704 | 18046 |
| Jul 2006 | 17726 | 17735 | 18072 |
| Aug 2006 | 17794 | 17805 | 18129 |
| Sep 2006 | 17817 | 17863 | 18197 |
| Oct 2006 | 17870 | 17883 | 18232 |
| Nov 2006 | 17927 | 18018 | 18280 |
| Dec 2006 | 17962 | 18063 | 18323 |
| Jan 2007 | 18099 | 18102 | 18357 |
| Feb 2007 | 18124 | 18138 | 18392 |
| Mar 2007 | 18190 | 18188 | 18446 |
| Apr 2007 | 18240 | 18246 | 18500 |
| May 2007 | 18300 | 18293 | 18548 |
| Jun 2007 | 18354 | 18364 | 18595 |
| Jul 2007 | 18396 | 18422 | 18626 |
| Aug 2007 | 18477 | 18484 | 18692 |
| Sep 2007 | 18531 | 18505 | 18748 |
| Oct 2007 | 18556 | 18554 | 18784 |
| Nov 2007 | 18577 | 18522 | 18811 |
| Dec 2007 | 18627 | 18568 | 18861 |
| Jan 2008 | 18625 | 18617 | 18912 |
| Feb 2008 | 18647 | 18665 | 18950 |
| Mar 2008 | 18699 | 18709 | 18999 |
| Apr 2008 | 18760 | 18757 | 19053 |
| May 2008 | 18824 | 18820 | 19097 |
| Jun 2008 | 18830 | 18891 | 19145 |
| Jul 2008 | 18914 | 18935 | 19199 |
| Aug 2008 | 18997 | 18997 | 19267 |
| Sep 2008 | 19019 | 18993 | 19273 |
| Oct 2008 | 19002 | 19012 | 19291 |
| Nov 2008 | 19073 | 19044 | 19330 |
| Dec 2008 | 19104 | 19080 | 19369 |
| Jan 2009 | 19143 | 19119 | 19405 |
| Feb 2009 | 19149 | 19138 | 19430 |
| Mar 2009 | 19149 | 19158 | 19436 |
| Apr 2009 | 19163 | 19175 | 19447 |
| May 2009 | 19215 | 19215 | 19503 |
| Jun 2009 | 19256 | 19248 | 19537 |
| Jul 2009 | 19269 | 19262 | 19557 |
| Aug 2009 | 19321 | 19312 | 19603 |
| Sep 2009 | 19311 | 19348 | 19608 |
| Oct 2009 | 19374 | 19384 | 19655 |
| Nov 2009 | 19428 | 19313 | 19684 |
| Dec 2009 | 19456 | 19350 | 19712 |
| Jan 2010 | 19355 | 19370 | 19728 |
| Feb 2010 | 19405 | 19400 | 19753 |
| Mar 2010 | 19442 | 19449 | 19808 |
| Apr 2010 | 19489 | 19477 | 19825 |
| May 2010 | 19494 | 19502 | 19846 |
| Jun 2010 | 19519 | 19532 | 19876 |
| Jul 2010 | 19558 | 19558 | 19896 |
| Aug 2010 | 19611 | 19599 | 19936 |
| Sep 2010 | 19611 | 19625 | 19931 |
| Oct 2010 | 19674 | 19691 | 19988 |
| Nov 2010 | 19719 | 19732 | 20032 |
| Dec 2010 | 19772 | 19760 | 20041 |
| Jan 2011 | 19768 | 19789 | 20058 |
| Feb 2011 | 19824 | 19832 | 20074 |
| Mar 2011 | 19875 | 19865 | 20086 |
| Apr 2011 | 19914 | 19905 | 20150 |
| May 2011 | 19953 | 19926 | 20161 |
| Jun 2011 | 19923 | 19944 | 20204 |
| Jul 2011 | 19976 | 19998 | 20247 |
| Aug 2011 | 20024 | 20036 | 20283 |
| Sep 2011 | 20081 | 20088 | 20332 |
| Oct 2011 | 20122 | 20125 | 20364 |
| Nov 2011 | 20152 | 20046 | 20401 |
| Dec 2011 | 20187 | 20079 | 20410 |
| Jan 2012 | 20110 | 20110 | 20479 |
| Feb 2012 | 20187 | 20181 | 20563 |
| Mar 2012 | 20213 | 20232 | 20593 |
| Apr 2012 | 20249 | 20247 | 20613 |
| May 2012 | 20307 | 20291 | 20656 |
| Jun 2012 | 20293 | 20294 | 20666 |
| Jul 2012 | 20323 | 20334 | 20689 |
| Aug 2012 | 20354 | 20365 | 20706 |
| Sep 2012 | 20408 | 20410 | 20765 |
| Oct 2012 | 20440 | 20442 | 20858 |
| Nov 2012 | 20452 | 20460 | 20862 |
| Dec 2012 | 20531 | 20496 | 20904 |
| Jan 2013 | 20535 | 20511 | 20921 |
| Feb 2013 | 20529 | 20542 | 20948 |
| Mar 2013 | 20586 | 20590 | 20989 |
| Apr 2013 | 20616 | 20626 | 21040 |
| May 2013 | 20653 | 20646 | 21069 |
| Jun 2013 | 20662 | 20669 | 21084 |
| Jul 2013 | 20675 | 20685 | 21108 |
| Aug 2013 | 20738 | 20742 | 21172 |
| Sep 2013 | 20760 | 20756 | 21181 |
| Oct 2013 | 20771 | 20782 | 21212 |
| Nov 2013 | 20826 | 21237 | 21237 |
| Dec 2013 | 20823 | 21242 | 21242 |
| Jan 2014 | 21227 | 21258 | 21258 |
| Feb 2014 | 21285 | 21290 | 21290 |
| Mar 2014 | 21323 | 21330 | 21330 |
| Apr 2014 | 21367 | 21362 | 21362 |
| May 2014 | 21432 | 21421 | 21421 |
| Jun 2014 | 21462 | 21469 | 21469 |
| Jul 2014 | 21483 | 21506 | 21506 |
| Aug 2014 | 21539 | 21556 | 21556 |
| Sep 2014 | 21580 | 21591 | 21591 |
| Oct 2014 | 21640 | 21635 | 21635 |
| Nov 2014 | 21666 | * | 21676 |
| Dec 2014 | 21724 | * | 21724 |
| *undefined | |||
CES data goes through several types of revision. Providing these vintage data tables allow users to get a clearer picture of how CES data changes over time and allows users to get a sense of the available information at any point in time. These data can be used for numerous research projects which require originally published estimates and can also be used as a transparency tool for all users who wish to see the magnitude and frequency of CES revisions.
More information and the CES vintage data can be found at https://www.bls.gov/web/empsit/cesvininfo.htm.
!--?pagebreak?-->!--?pagebreak?-->Nicholas A. Fett, "Comparing with the original: a look at Current Employment Statistics vintage data," Monthly Labor Review, U.S. Bureau of Labor Statistics, April 2015, https://doi.org/10.21916/mlr.2015.12
1 For more information on revisions to CES data, see https://www.bls.gov/web/empsit/cestn.htm#section6.
2 For more information on industrial reclassification, see https://www.bls.gov/web/empsit/cestn.htm#section6c.
3 For more information on CES seasonal adjustment, see https://www.bls.gov/web/empsit/cesseasadj.htm.
4 For more information, please see the CES Benchmark article and CES Technical Notes at https://www.bls.gov/web/empsit/cesbmart.htm and https://www.bls.gov/web/empsit/cestn.htm.