An official website of the United States government
 United States Department of Labor
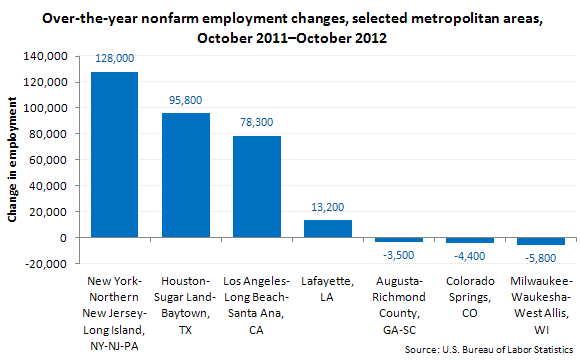
In October, 288 metropolitan areas reported over-the-year increases in nonfarm payroll employment, 80 reported decreases, and 4 had no change. The largest over-the-year employment increase occurred in New York-Northern New Jersey-Long Island, NY-NJ-PA (+128,000), followed by Houston-Sugar Land-Baytown, Texas (+95,800), and Los Angeles-Long Beach-Santa Ana, California (+78,300).

| Metropolitan area | Change in employment (p) |
|---|---|
New York-Northern New Jersey-Long Island, NY-NJ-PA | 128,000 |
Houston-Sugar Land-Baytown, TX | 95,800 |
Los Angeles-Long Beach-Santa Ana, CA | 78,300 |
Lafayette, LA | 13,200 |
Augusta-Richmond County, GA-SC | -3,500 |
Colorado Springs, CO | -4,400 |
Milwaukee-Waukesha-West Allis, WI | -5,800 |
Footnotes: | |
The largest over-the-year decrease in employment occurred in Milwaukee-Waukesha-West Allis, Wisconsin (−5,800), followed by Colorado Springs, Colorado (−4,400), and Augusta-Richmond County, Georgia-South Carolina (−3,500).
The largest over-the-year percentage gain in employment was reported in Lafayette, Louisiana (where employment increased by 13,200 jobs or 8.5 percent), followed by Elkhart-Goshen, Indiana (+7.3 percent), and Columbus, Indiana (+7.2 percent). The largest over-the-year percentage decrease in employment was reported in Lawton, Oklahoma (−3.9 percent), followed by Auburn-Opelika, Alabama, and Dalton, Georgia (−3.8 percent each), and Las Cruces, New Mexico (−3.7 percent).
Over the year, nonfarm employment rose in 36 of the 37 metropolitan areas with annual average employment levels above 750,000 in 2011. The largest over-the-year percentage increases in employment in these large metropolitan areas were posted in Houston-Sugar Land-Baytown, Texas (+3.6 percent); Austin-Round Rock-San Marcos, Texas, and San Jose-Sunnyvale-Santa Clara, California (+3.5 percent each); and Seattle-Tacoma-Bellevue, Washington (+3.1 percent). The only large metropolitan area that reported a percentage decrease was Milwaukee-Waukesha-West Allis, Wisconsin (−0.7 percent).
These data are from the Current Employment Statistics (State and Metro Area) program. Data for the most recent month are preliminary and subject to revision. These data are not seasonally adjusted. See "Metropolitan Area Employment and Unemployment — October 2012" (HTML) (PDF), news release USDL-12-2324, to learn more.
Bureau of Labor Statistics, U.S. Department of Labor, The Economics Daily, Employment increases in 288 metro areas in October at https://www.bls.gov/opub/ted/2012/ted_20121129.htm (visited February 04, 2026).

