An official website of the United States government
 United States Department of Labor
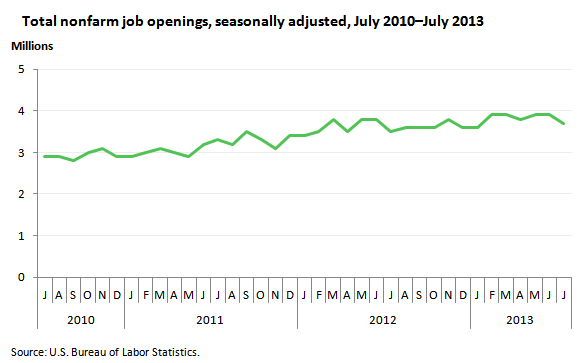
The number of job openings in July was 3.7 million, little changed from June. The number of job openings dropped over the month in professional and business services, but there was not much movement in other industries. There also was little change in job openings over the month in all four regions.

| Month | Job openings level |
|---|---|
Jul 2010 | 2,922,000 |
Aug 2010 | 2,905,000 |
Sep 2010 | 2,784,000 |
Oct 2010 | 3,033,000 |
Nov 2010 | 3,051,000 |
Dec 2010 | 2,930,000 |
Jan 2011 | 2,868,000 |
Feb 2011 | 3,017,000 |
Mar 2011 | 3,104,000 |
Apr 2011 | 3,025,000 |
May 2011 | 2,937,000 |
Jun 2011 | 3,180,000 |
Jul 2011 | 3,286,000 |
Aug 2011 | 3,172,000 |
Sep 2011 | 3,465,000 |
Oct 2011 | 3,308,000 |
Nov 2011 | 3,118,000 |
Dec 2011 | 3,384,000 |
Jan 2012 | 3,415,000 |
Feb 2012 | 3,526,000 |
Mar 2012 | 3,848,000 |
Apr 2012 | 3,523,000 |
May 2012 | 3,774,000 |
Jun 2012 | 3,792,000 |
Jul 2012 | 3,499,000 |
Aug 2012 | 3,632,000 |
Sep 2012 | 3,603,000 |
Oct 2012 | 3,646,000 |
Nov 2012 | 3,789,000 |
Dec 2012 | 3,612,000 |
Jan 2013 | 3,611,000 |
Feb 2013 | 3,899,000 |
Mar 2013 | 3,875,000 |
Apr 2013 | 3,800,000 |
May 2013 | 3,907,000 |
Jun 2013 | 3,869,000 |
Jul 2013 | 3,689,000(p) |
| (p) = preliminary. | |
The number of job openings in July (not seasonally adjusted) was little changed over the year for total nonfarm, total private, and government. Increases in job openings in several industries were offset by decreases in job openings in several other industries, leading to little change at the total nonfarm level.
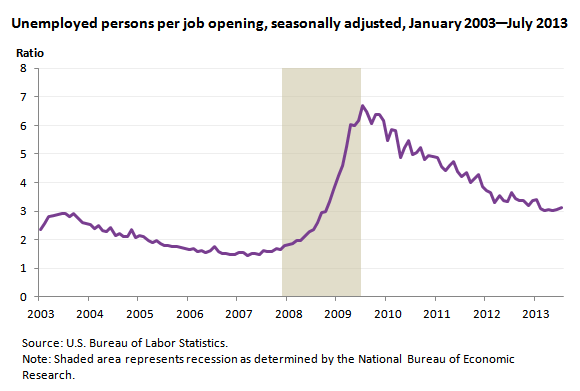
The ratio of unemployed persons per job opening has trended downward since the most recent recession ended in June 2009 and was 3.1 in July 2013.

| Date | Number of unemployed | Number of job openings | Number of unemployed per job opening |
|---|---|---|---|
Jan 2003 | 8,520,000 | 3,618,000 | 2.4 |
Feb 2003 | 8,618,000 | 3,378,000 | 2.6 |
Mar 2003 | 8,588,000 | 3,056,000 | 2.8 |
Apr 2003 | 8,842,000 | 3,107,000 | 2.8 |
May 2003 | 8,957,000 | 3,108,000 | 2.9 |
Jun 2003 | 9,266,000 | 3,196,000 | 2.9 |
Jul 2003 | 9,011,000 | 3,106,000 | 2.9 |
Aug 2003 | 8,896,000 | 3,182,000 | 2.8 |
Sep 2003 | 8,921,000 | 3,051,000 | 2.9 |
Oct 2003 | 8,732,000 | 3,140,000 | 2.8 |
Nov 2003 | 8,576,000 | 3,286,000 | 2.6 |
Dec 2003 | 8,317,000 | 3,255,000 | 2.6 |
Jan 2004 | 8,370,000 | 3,322,000 | 2.5 |
Feb 2004 | 8,167,000 | 3,415,000 | 2.4 |
Mar 2004 | 8,491,000 | 3,394,000 | 2.5 |
Apr 2004 | 8,170,000 | 3,524,000 | 2.3 |
May 2004 | 8,212,000 | 3,620,000 | 2.3 |
Jun 2004 | 8,286,000 | 3,423,000 | 2.4 |
Jul 2004 | 8,136,000 | 3,807,000 | 2.1 |
Aug 2004 | 7,990,000 | 3,623,000 | 2.2 |
Sep 2004 | 7,927,000 | 3,754,000 | 2.1 |
Oct 2004 | 8,061,000 | 3,836,000 | 2.1 |
Nov 2004 | 7,932,000 | 3,383,000 | 2.3 |
Dec 2004 | 7,934,000 | 3,808,000 | 2.1 |
Jan 2005 | 7,784,000 | 3,638,000 | 2.1 |
Feb 2005 | 7,980,000 | 3,757,000 | 2.1 |
Mar 2005 | 7,737,000 | 3,916,000 | 2.0 |
Apr 2005 | 7,672,000 | 4,057,000 | 1.9 |
May 2005 | 7,651,000 | 3,877,000 | 2.0 |
Jun 2005 | 7,524,000 | 4,064,000 | 1.9 |
Jul 2005 | 7,406,000 | 4,155,000 | 1.8 |
Aug 2005 | 7,345,000 | 4,102,000 | 1.8 |
Sep 2005 | 7,553,000 | 4,275,000 | 1.8 |
Oct 2005 | 7,453,000 | 4,221,000 | 1.8 |
Nov 2005 | 7,566,000 | 4,437,000 | 1.7 |
Dec 2005 | 7,279,000 | 4,278,000 | 1.7 |
Jan 2006 | 7,064,000 | 4,296,000 | 1.6 |
Feb 2006 | 7,184,000 | 4,282,000 | 1.7 |
Mar 2006 | 7,072,000 | 4,472,000 | 1.6 |
Apr 2006 | 7,120,000 | 4,438,000 | 1.6 |
May 2006 | 6,980,000 | 4,487,000 | 1.6 |
Jun 2006 | 7,001,000 | 4,333,000 | 1.6 |
Jul 2006 | 7,175,000 | 4,076,000 | 1.8 |
Aug 2006 | 7,091,000 | 4,498,000 | 1.6 |
Sep 2006 | 6,847,000 | 4,563,000 | 1.5 |
Oct 2006 | 6,727,000 | 4,434,000 | 1.5 |
Nov 2006 | 6,872,000 | 4,705,000 | 1.5 |
Dec 2006 | 6,762,000 | 4,583,000 | 1.5 |
Jan 2007 | 7,116,000 | 4,602,000 | 1.5 |
Feb 2007 | 6,927,000 | 4,483,000 | 1.5 |
Mar 2007 | 6,731,000 | 4,707,000 | 1.4 |
Apr 2007 | 6,850,000 | 4,498,000 | 1.5 |
May 2007 | 6,766,000 | 4,479,000 | 1.5 |
Jun 2007 | 6,979,000 | 4,690,000 | 1.5 |
Jul 2007 | 7,149,000 | 4,404,000 | 1.6 |
Aug 2007 | 7,067,000 | 4,491,000 | 1.6 |
Sep 2007 | 7,170,000 | 4,536,000 | 1.6 |
Oct 2007 | 7,237,000 | 4,275,000 | 1.7 |
Nov 2007 | 7,240,000 | 4,396,000 | 1.6 |
Dec 2007 | 7,645,000 | 4,256,000 | 1.8 |
Jan 2008 | 7,685,000 | 4,224,000 | 1.8 |
Feb 2008 | 7,497,000 | 4,026,000 | 1.9 |
Mar 2008 | 7,822,000 | 4,003,000 | 2.0 |
Apr 2008 | 7,637,000 | 3,906,000 | 2.0 |
May 2008 | 8,395,000 | 3,947,000 | 2.1 |
Jun 2008 | 8,575,000 | 3,777,000 | 2.3 |
Jul 2008 | 8,937,000 | 3,784,000 | 2.4 |
Aug 2008 | 9,438,000 | 3,643,000 | 2.6 |
Sep 2008 | 9,494,000 | 3,233,000 | 2.9 |
Oct 2008 | 10,074,000 | 3,384,000 | 3.0 |
Nov 2008 | 10,538,000 | 3,155,000 | 3.3 |
Dec 2008 | 11,286,000 | 3,011,000 | 3.7 |
Jan 2009 | 12,079,000 | 2,853,000 | 4.2 |
Feb 2009 | 12,881,000 | 2,807,000 | 4.6 |
Mar 2009 | 13,421,000 | 2,550,000 | 5.3 |
Apr 2009 | 13,826,000 | 2,292,000 | 6.0 |
May 2009 | 14,492,000 | 2,415,000 | 6.0 |
Jun 2009 | 14,705,000 | 2,377,000 | 6.2 |
Jul 2009 | 14,607,000 | 2,179,000 | 6.7 |
Aug 2009 | 14,819,000 | 2,282,000 | 6.5 |
Sep 2009 | 15,005,000 | 2,477,000 | 6.1 |
Oct 2009 | 15,382,000 | 2,409,000 | 6.4 |
Nov 2009 | 15,223,000 | 2,390,000 | 6.4 |
Dec 2009 | 15,095,000 | 2,451,000 | 6.2 |
Jan 2010 | 15,016,000 | 2,751,000 | 5.5 |
Feb 2010 | 15,078,000 | 2,577,000 | 5.9 |
Mar 2010 | 15,192,000 | 2,614,000 | 5.8 |
Apr 2010 | 15,281,000 | 3,142,000 | 4.9 |
May 2010 | 14,856,000 | 2,849,000 | 5.2 |
Jun 2010 | 14,475,000 | 2,645,000 | 5.5 |
Jul 2010 | 14,542,000 | 2,922,000 | 5.0 |
Aug 2010 | 14,673,000 | 2,905,000 | 5.1 |
Sep 2010 | 14,577,000 | 2,784,000 | 5.2 |
Oct 2010 | 14,584,000 | 3,033,000 | 4.8 |
Nov 2010 | 15,094,000 | 3,051,000 | 4.9 |
Dec 2010 | 14,354,000 | 2,930,000 | 4.9 |
Jan 2011 | 13,992,000 | 2,868,000 | 4.9 |
Feb 2011 | 13,798,000 | 3,017,000 | 4.6 |
Mar 2011 | 13,716,000 | 3,104,000 | 4.4 |
Apr 2011 | 13,872,000 | 3,025,000 | 4.6 |
May 2011 | 13,871,000 | 2,937,000 | 4.7 |
Jun 2011 | 13,964,000 | 3,180,000 | 4.4 |
Jul 2011 | 13,817,000 | 3,286,000 | 4.2 |
Aug 2011 | 13,837,000 | 3,172,000 | 4.4 |
Sep 2011 | 13,910,000 | 3,465,000 | 4.0 |
Oct 2011 | 13,696,000 | 3,308,000 | 4.1 |
Nov 2011 | 13,325,000 | 3,118,000 | 4.3 |
Dec 2011 | 13,049,000 | 3,384,000 | 3.9 |
Jan 2012 | 12,748,000 | 3,415,000 | 3.7 |
Feb 2012 | 12,806,000 | 3,526,000 | 3.6 |
Mar 2012 | 12,686,000 | 3,848,000 | 3.3 |
Apr 2012 | 12,518,000 | 3,523,000 | 3.6 |
May 2012 | 12,695,000 | 3,774,000 | 3.4 |
Jun 2012 | 12,701,000 | 3,792,000 | 3.3 |
Jul 2012 | 12,745,000 | 3,499,000 | 3.6 |
Aug 2012 | 12,483,000 | 3,632,000 | 3.4 |
Sep 2012 | 12,082,000 | 3,603,000 | 3.4 |
Oct 2012 | 12,248,000 | 3,646,000 | 3.4 |
Nov 2012 | 12,042,000 | 3,789,000 | 3.2 |
Dec 2012 | 12,206,000 | 3,612,000 | 3.4 |
Jan 2013 | 12,332,000 | 3,611,000 | 3.4 |
Feb 2013 | 12,032,000 | 3,899,000 | 3.1 |
Mar 2013 | 11,742,000 | 3,875,000 | 3.0 |
Apr 2013 | 11,659,000 | 3,800,000 | 3.1 |
May 2013 | 11,760,000 | 3,907,000 | 3.0 |
Jun 2013 | 11,777,000 | 3,869,000 | 3.0 |
Jul 2013 | 11,514,000 | 3,689,000(p) | 3.1 |
| (p) = preliminary. | |||
When the most recent recession began (December 2007), the number of unemployed persons per job opening was 1.8. When the recession ended, there were 6.2 unemployed persons per job opening.
These data are from the Job Openings and Labor Turnover Survey. Data for the most recent month are preliminary and subject to revision. To learn more, see “Job Openings and Labor Turnover — July 2013” (HTML) (PDF), news release USDL-13-1834. More charts featuring data on job openings, hires, and employment separations can be found in Job Openings and Labor Turnover Survey Highlights: July 2013 (PDF).
Bureau of Labor Statistics, U.S. Department of Labor, The Economics Daily, Job openings level at 3.7 million in July 2013 at https://www.bls.gov/opub/ted/2013/ted_20130911.htm (visited February 14, 2026).

