An official website of the United States government
 United States Department of Labor
The Bureau of Labor Statistics (BLS) estimates of R&D spillover stocks are designed to measure the benefits of R&D that spill over from the original investors to other firms, The Impact of Research and Development on Productivity Growth, reports the method underlying Bureau of Labor Statistics R&D stocks.
The Bureau of Economic Analysis (BEA) of the Department of Commerce publishes measures of research and development investments in each industry that include estimates of the direct returns to firms conducting such research and development activities. In contrast to the BLS concept, the BEA measures the value of R&D investment as an asset to its owners, the private firms, government, or colleges and universities which finance and conduct research; spillover effects are not included. In terms of coverage, BEA includes R&D financed by private firms, government, colleges and universities, and non-profit institutions, whereas the BLS considers only R&D financed by private firms.
Because of these differences in concept and coverage, the BEA and BLS R&D stocks utilize different lags 1 and rates of depreciation, and report different magnitudes for the U.S. national R&D stock. BLS stocks are larger because spillovers, associated with the diffusion of knowledge, typically take more time to occur, and therefore depreciate more slowly. Section I of the BLS Working Paper 408 contains a further discussion of differences between the BLS and BEA concepts.
Users of R&D data should view the BEA and BLS measures as complementary, since asset and spillover effects both have to be taken into account to describe the total effect of R&D on the economy. The BEA stocks provide information on how much value R&D stocks bring to their owners who hold R&D as an asset. The BLS data show how much R&D spills over to create value for other firms in the economy. Since R&D brings both direct benefits to holders of R&D and indirect benefits to other firms who eventually utilize this same knowledge, both elements have to be included to understand the total impact of R&D.
Data For Charts
See the research and development data presented in these charts in Excel format.
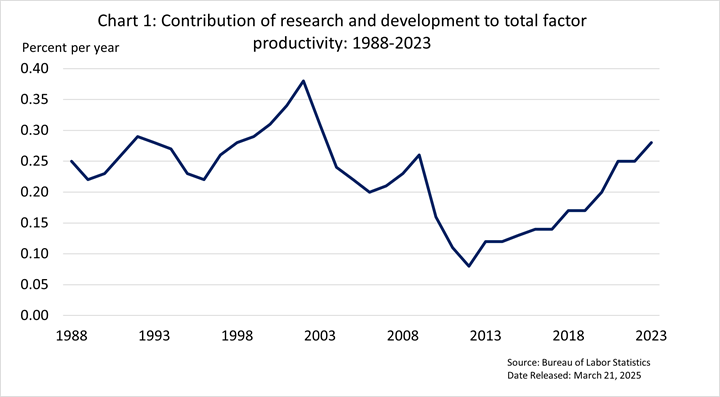
Chart and Table 1 shows the year-to-year contribution to private nonfarm business sector.

Chart 1 data. Contribution of Research and Development to Total Factor Productivity, 1988-2023
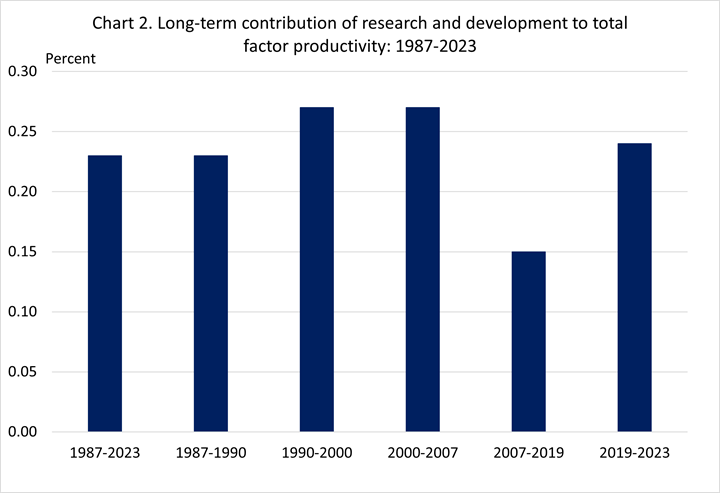
Chart and Table 2 shows the long-term contribution of Research and Development (R&D) to total factor productivity (TFP) growth.

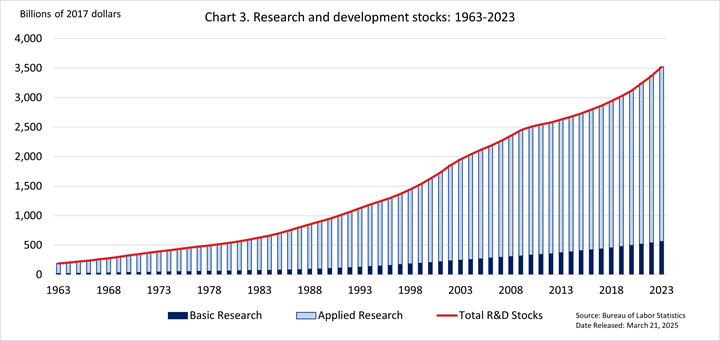
Chart and Table 3 shows R&D stocks. The stock of R&D in the private nonfarm business sector is derived by cumulating constant dollar measures of research and development expenditures and by allowing for depreciation. Current dollar expenditures for privately financed research and development are obtained from annual issues of Research and Development in Industry published by the National Science Foundation. The BLS develops price deflators and estimates of the rate of depreciation.

Chart 3 data. Research and Development Stocks: 1963-2023 (in billions of 2017 dollars)
Last Modified Date: March 21, 2025
1 Lags refer to the period of time between an investment in R&D and its ability to contribute to production. R&D stocks often incorporate a lag before R&D is assumed to affect production.