
An official website of the United States government
 United States Department of Labor
An official website of the United States government
United States Department of Labor

The .gov means it's official.
Federal government websites often end in .gov or .mil. Before sharing sensitive information,
make sure you're on a federal government site.

The site is secure.
The
https:// ensures that you are connecting to the official website and that any
information you provide is encrypted and transmitted securely.


The Bureau of Labor Statistics (BLS) has updated its existing capital input measures to reflect changes to the fixed investments due to Bureau of Economic Analysis (BEA) 2013 Comprehensive Revision. BLS now includes intellectual property products and two new residential assets due to the Comprehensive Revision as part of its capital inputs. Intellectual property products’ share of gross investment has continued to increase, now second only to equipment.
BLS incorporates BEA fixed asset investment into its estimates of productive stocks by adjusting service lives so they are consistent with BEA economic depreciation estimates. BLS adjusts service lives for equipment, nonresidential structures, and intellectual property products but not for residential structures. BLS then uses its estimates of productive stock to estimate capital services, the input that BLS uses in estimating productivity. As new categories of gross investment data become available and novel estimation procedures are developed, BLS will continue to enhance its capital input measures.
Since 1983, the Bureau of Labor Statistics (BLS) has published annual multifactor productivity (MFP) measures of the private business and private nonfarm business sectors. BLS has incorporated updated data and new and improved methodological estimation procedures into the multifactor productivity measures as they have become available. Starting with the release of the Bureau of Economic Analysis’s (BEA) 2013 Comprehensive Revision of the National Income and Products Accounts (NIPA), updated measures have included a new major asset category known as “intellectual property products” and the introduction of two new residential assets. For the 1987-2015 period, intellectual property products have contributed more than a third of all capital intensity to the private nonfarm business sector.[1] BLS uses fixed investment from BEA to calculate capital stocks that are then used for estimating capital inputs. Fixed investment are the expenditures used in the purchase of residential and non-residential structures, equipment, and intellectual property products. BEA defines fixed assets as assets derived as output from a production process that are used repeatedly—or continuously—in production processes for more than a year. Originally consisting of equipment and structures but excluding consumer durables (U.S. Department of Commerce, 2003), these fixed assets now include intellectual property products.
This page describes the procedures that BLS uses to estimate capital inputs and the impact of the 2013 Comprehensive Revision of the NIPA on the estimation of these capital inputs. BLS procedures for estimating capital inputs have always been closely tied to the BEA estimates of fixed assets. BLS has accordingly adjusted some of its procedures for estimating capital inputs to reflect the changes generated by the 2013 Comprehensive Revisions of the NIPA.
An important focus of productivity measurement is determining the flow of capital services provided by a given stock of capital assets. The capital service flow is similar to the flow of labor hours but, unlike labor hours, usually cannot be measured directly because companies own most of the capital assets that they use. However, in the literature on productivity measurement, procedures have been developed to estimate the service flow from historical data on capital investments, estimates of the rates of deterioration and depreciation of capital, and income data of firms utilizing capital. The BLS methods, which closely follow models presented in the economic literature, are summarized here.
BLS calculates measures of major sector capital in three basic steps. These are the estimation of detailed "productive capital stocks", the aggregation of productive stocks of various asset types within each industry to estimate industry capital inputs (capital service flows), and the aggregation of capital inputs across industries.
BLS estimates of productive capital stocks for equipment, structures, and intellectual property products are based on detailed gross investment data from BEA and on estimates of how capital service flows "deteriorate" as assets age. BEA provides estimates of rates of economic "depreciation". Deterioration and depreciation are not the same thing but they are closely related. Depreciation is the loss in value associated with deterioration. In the BLS model, depreciation occurs more rapidly than deterioration during the earlier years of an asset’s service life. BLS has adjusted its deterioration estimates for equipment and nonresidential structures to ensure consistency with BEA depreciation rates. The BLS deterioration estimates were generated by selecting longer service lives than the BEA estimates. This table presents a list of the asset types, together with service life estimates, which BLS has adopted. These are compared with a list of the asset types and service lives which BEA uses. (The BLS also estimates productive stocks of inventories and land using different data sources and procedures.)
This depreciation rate table shows BLS service lives of nonresidential structures that have been adjusted to BEA depreciation rates to be much longer than BEA’s service lives. While BLS finds that adapting to BEA depreciation rates yields reasonable estimates for the service lives of nonresidential structures, the same does not hold true for residential structures. BLS service lives of residential structures adjusted to BEA depreciation rates could be as long as 150 years. Therefore, BLS uses the unadjusted BEA service lives for residential structures.
Once productive capital stocks have been calculated for the various types of assets used by an industry, they are aggregated into indexes representing the industry’s total capital services. This is the second step in arriving at aggregate capital measures. This is accomplished by estimating "implicit rental prices" for each type of asset and then using these rental prices to construct Tornqvist aggregates of the productive stocks. The rental prices are designed to account for differences in the service flows of assets of different types. The BLS rental price estimates take account of the rate of return to capital, the rate of economic depreciation, the rate of nominal appreciation of assets and also the tax treatment of assets. The use of rental prices to construct weights for aggregation is an important step in measuring capital services, because in large part rental prices differ because of dissimilar depreciation rates and rental prices take proper account of all of the implications of depreciation for these services. In the discussion of the empirical results below, it will be seen that weights did not change much except for land, which does not have a depreciation term. This was because changes to the rental prices tend to offset changes in the levels of productive stocks.
The third and final step in major sector capital measurement is the aggregation of industry capital services to the level of private business and private nonfarm business sectors. At this stage of aggregation, the weight assigned to each industry’s capital input is the industry's share of its capital income in the total capital income of the aggregate sector. Capital income estimates are based on selected components of nominal income from BEA’s work on gross product originating by industry; namely, the other gross operating surplus and its corporate and non-corporate components.
BLS uses these NIPA-level industry capital service measures to calculate all of its major sector and NIPA-level multifactor productivity estimates. BLS currently publishes news releases for the private business and private nonfarm business sectors and for the major manufacturing sectors and for 18 NIPA-level manufacturing industries. BLS also publishes two sets of additional multifactor productivity measures that are currently available. One measure includes multifactor productivity for 42 three-digit NAICS nonmanufacturing industries. The second set includes value-added output per combined input measures for the total economy.
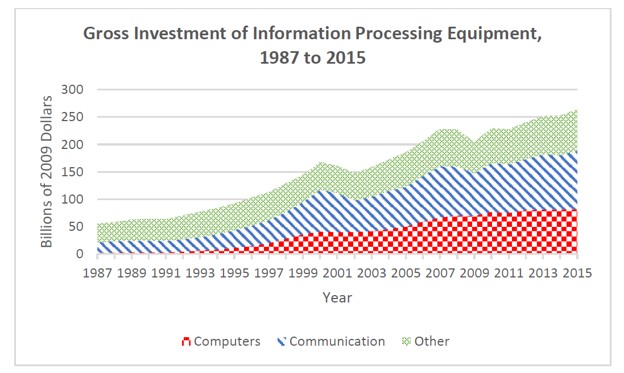
Information processing equipment is composed of three broad classes: computers and related equipment, communications equipment, and other information processing equipment. Computers and related equipment includes mainframe computers, personal computers, printers, terminals, tape drives, storage devices, and integrated systems. Communications equipment is not further differentiated. Other information processing equipment includes medical equipment and related instruments, nonmedical instruments, photocopying and related equipment, and office and accounting machinery. Originally included in the 1999 Comprehensive Revision of the NIPA as being part of the information processing equipment asset category, software investments have now been re-classified as being part of the intellectual property products category in the 2013 Comprehensive Revision of the NIPA. Chart 1 shows the gross investments of three broad categories of information processing equipment in the private nonfarm business sector starting from 1987 and the increasing share of computers in the total gross investment of information processing equipment
Chart 1. Composition of Gross Investment in Information Processing Equipment in the Nonfarm Business Sector, 1987 to 2015.
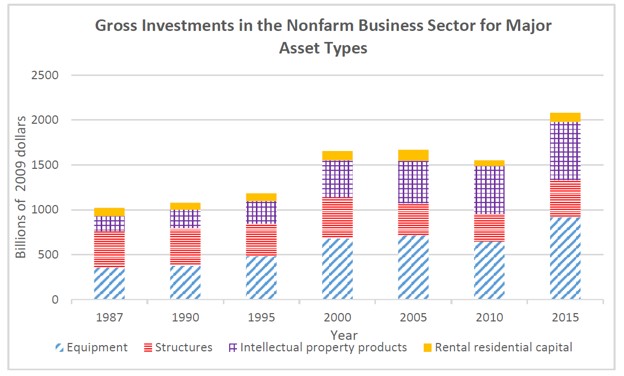
A growing professional and public interest on the role of technology and its influence on productivity growth has compelled BLS to create a broad new category of assets that embody this technology. Chart 2 illustrates the composition of the gross investments (in billions of 2009 dollars) in the nonfarm business sector by major asset groups for selected years.
Chart 2. Distribution of Gross Investments in the Nonfarm Business Sector by Major Asset Types selected years
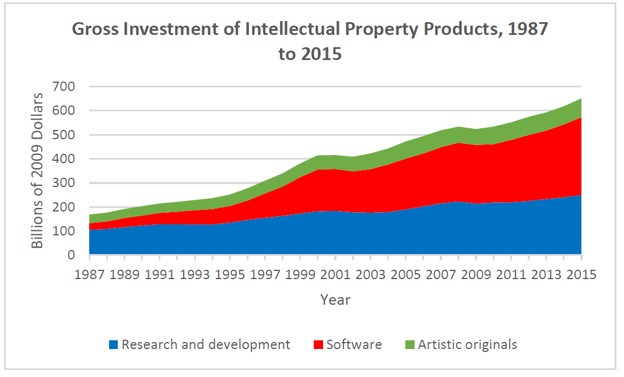
In the 2013 Comprehensive Revision of the NIPA, BEA introduced a new major asset category called “intellectual property products” that grouped a variety of intangible fixed assets that now include software and databases, research and development, and entertainment, literary, and artistic originals. According to the 2008 Statistics of National Accounts (SNA), “Intellectual property products are the result of research, development, investigation, or innovation leading to knowledge that the developers can market or use to their own benefit in production because use of the knowledge is restricted by means of legal or other protection.” BEA asserts that these intellectual property products have characteristics similar to tangible fixed assets; mainly, that they have ownership rights, are long-lasting, and have the potential to be used repeatedly in the production process. Chart 3 illustrates gross investments of the three broad categories of intellectual property products from 1987 and the increasing share of software as part of the gross investment for intellectual property products.
Chart 3. Composition of Gross Investment in Intellectual Property Products in the Private Nonfarm Business Sector, 1987 to 2015.
In the 1999 Comprehensive Revision of the NIPA, business and government expenditures for computer software were recognized as fixed investments for the first time (Moulton, Parker, and Seskin, 1999). Parker (2000) listed three types of software being treated as investments: prepackaged, custom and own account. Prepackaged software is defined as software intended for non-specialized use that comes in a standardized format. Custom software is software specifically written to the specifications of a buyer. Own-account software is software that has been created or enhanced by business or government for their own use. Prior to the 2013 Comprehensive Revision of the NIPA, software assets were classified under the equipment category.
According to the 1993 SNA, “Research and development consists of the value of expenditures on creative work undertaken on a systematic basis in order to increase the stock of knowledge, including knowledge of man, culture and society, and use of this stock of knowledge, including knowledge of man, culture and society, and use of this stock of knowledge to devise new applications. This does not extend to human capital as assets within the SNA.” BEA currently has seventeen detailed research and development asset categories that BLS has aggregated into a single research and development series. Entertainment, literary, and artistic originals are described by the SNA (1993) as consisting of “…original films, sound recordings, manuscripts, tapes, models, etc., on which drama performances, radio and television programming, musical performances, sporting events, literary and artistic output, etc., are recorded or embodied.” Among the items that BEA has defined as originals are theatrical movies, long-lived television programs, books, music, theatrical scripts, greeting card designs, and commercial stock photography. Starting from the implementation of the 2013 Comprehensive Revision of the NIPA, BEA will treat any private expenditures associated with the producing or purchasing of entertainment, literary, and artistic originals as private fixed investment when measuring GDP. As with BEA’s detailed research and development assets, BLS has aggregated BEA’s nine detailed assets related to entertainment, literary, and artistic originals into a single series.
The 2009 Comprehensive Revision of the National Income and Products Accounts introduced following non-residential structures: special care, multimerchandise shopping, food and beverage establishments, water supply, sewage disposal, public safety, and highway and conservation and development.
In the 2013 Comprehensive Revision of the NIPA, BEA recognized “ownership transfer costs,” the expenses associated with the acquisition or disposal of fixed residential assets as gross investment in residential structures. Examples of these ownership transfer costs include closing costs other than those associated with getting a mortgage, payments for state and local documentary and stamp taxes, and payments for surveys and engineering services. Expenses associated with obtaining financing for the purpose of obtaining a residential asset such as loan association fees and credit reports will not be considered part of gross investment in residential structures.
Since 1996 BEA has used geometric depreciation rates that imply that an asset’s value declines at the same percentage rate each year. As noted by Fraumeni (1997), depreciation schedules reflect the underlying values that assets can contribute to production over the remainder of their lives. BLS, on the other hand, assumes that an asset’s value depreciates less rapidly during the initial years of an asset’s service life. This assumption is based on limited empirical evidence and anecdotal observations that such a pattern of depreciation is more realistic for many types of assets. Such observations led the BLS to postulate concave depreciation schedule patterns that conform to the assumption that assets do not decay rapidly during their initial years. These concave depreciation schedule patterns are revised to be consistent with new evidence on the depreciation rates gathered by BEA (Harper, 1999).
Ideally, depreciation profiles are estimated based on the market prices of used assets. For most assets, markets for used assets are either non-existent or too inactive to generate reliable age-price profiles. However, BEA was able to estimate age-price profiles for computers and computer peripherals from work by Oliner [1993] as well as for autos. For other assets, BEA has estimated geometric depreciation rates using evidence from a number of empirical studies. The new rates were obtained by dividing "declining balance" parameters by BEA’s previous estimates of the assets’ service lives. Based on the evidence, BEA selected parameters of 1.65 for equipment and .91 for structures. This approach, which draws on work by Hulten and Wykoff [1981a, 1981b] effectively makes broad adjustments to the previous BEA depreciation assumptions based on evidence from a limited number of asset categories. With the 0.91 parameter, the resulting depreciation rates for nonresidential structures turn out to be quite low. As a consequence of the low depreciation rates, the BEA stocks of nonresidential structures are much larger than they were in previous measures.
While the Hulten and Wykoff studies represent the best available empirical evidence on the depreciation rates of nonresidential structures, there are several reasons to be cautious about their estimates. Unlike equipment, no two buildings are identical. The price of a building depends on the quality and size of construction, tax treatment, location and a host of other characteristics. However, accurate measures of economic depreciation depend on measuring the price change of an asset as it ages, holding all other characteristics constant. The work by Hulten and Wykoff was largely unable to control for the effect of these other traits on prices. In particular, as a city or urban area expands outward, the value of an older building may increase as the location becomes more valuable. This would appear to lower the rate of price decline for older buildings. Furthermore, the studies examined building prices in the 1970s. There may have been an unusual amount of appreciation in used real estate prices during this period; they had very little effect on the trend in MFP. Work is currently underway at BLS to examine depreciation using more current information from Statistics Canada surveys.
Commission of the European Communities, International Monetary Fund, Organisation for Economic Co-operation and Development, United Nations, and the World Bank, System of National Accounts 1993 (Brussels/Luxembourg, New York, Paris, and Washington, DC, 1993).
Commission of the European Communities, International Monetary Fund, Organisation for Economic Co-operation and Development, United Nations, and the World Bank, System of National Accounts 2008 (Brussels/Luxembourg, New York, Paris, and Washington, DC, 2009).
Fraumeni, Barbara, "The Measurement of Depreciation in the U.S. National Income and Product Accounts," Survey of Current Business, July 1997, pp. 7-23.
Harper, Michael J., “Estimating Capital Inputs for Productivity Measurement: An Overview of U.S. Concepts and Methods,” International Statistical Review, Vol.67, 1999, pp. 327-337.
Hulten, Charles and Frank Wykoff, "The Estimation of Economic Depreciation using Vintage Asset Prices," Journal of Econometrics, Vol. 15, April 1981, pp. 367-396.
Hulten, Charles and Frank Wykoff, "The Measurement of Economic Depreciation," in C. Hulten, ed., Depreciation, Inflation, and the Taxation of Income from Capital, (Washington, The Urban Institute Press, 1981), pp. 81-125.
Katz, Arnold J., and Shelby W. Herman, "Improved Estimates of Fixed Reproducible Tangible Wealth, 1929-95," Survey of Current Business, May 1997, pp. 69-92.
Lally, Paul, “Fixed Assets and Consumer Durable Goods: Preliminary Estimates for 2002, Revised Estimates for 1925-2001,” Survey of Current Business, May 2004a, pp. 7-22.
Lally, Paul, “Fixed Assets and Consumer Durable Goods for 1993-2003,” Survey of Current Business, September 2004b, pp.29-42.
Moulton, Brent R., Robert P. Parker, and Eugene P. Seskin, “A Preview of the 1999 Comprehensive Revision of the National Income and Product Accounts,” Survey of Current Business, August 1999, pp. 720.
Moylan, Carol E. and Brooks B. Robinson, “Preview of the 2003 Comprehensive Revision of the National Income and Product Accounts: Statistical Changes,” Survey of Current Business, September 2003, pp. 1732.
Oliner, Stephen, "Constant-Quality Price Change, Depreciation and Retirement of Mainframe Computers," in Price Measurement and Their Uses, eds. Murray Foss, Marilyn Manser, and Allan Young (Chicago, University of Chicago Press, 1993), pp. 19-61.
Parker, Robert “Recognition of Business and Government Expenditures for Software as Investment: Methodology and Quantitative Impacts, 1959-98” (http://www.bea.gov/bea/mp_national.htm), May 2000, pp.1-44.
Seskin, Eugene, “Improved Estimates of the NIPA’s for 1959-98: Results of the Comprehensive Revision,” Survey of Current Business, December 1999, pp. 15-39.
Smith, Shelley, “Preview of the 2013 Comprehensive Revision of the National Income and Product Accounts: Changes in Definitions and Presentations,” Survey of Current Business, March 2013, pp. 13-27.
U.S. Department of Commerce, Bureau of Economic Analysis, “Fixed Assets and Consumer Durable Goods in the United States, 1925-99,” (Washington DC, U.S. Government Printing Office, September 2003).
U.S. Department of Labor, Bureau of Labor Statistics, "Multifactor Productivity Trends - 2014," March 2016, USDL #16-0612.
U.S. Department of Labor, Bureau of Labor Statistics, Trends in Multifactor Productivity, 1948-81, Bulletin 2178 (Washington, Government Printing Office, September 1983).