An official website of the United States government
An official website of the United States government
The .gov means it's official.
Federal government websites often end in .gov or .mil. Before sharing sensitive information,
make sure you're on a federal government site.
The site is secure.
The
https:// ensures that you are connecting to the official website and that any
information you provide is encrypted and transmitted securely.
24-2056-PHI
Thursday, September 26, 2024
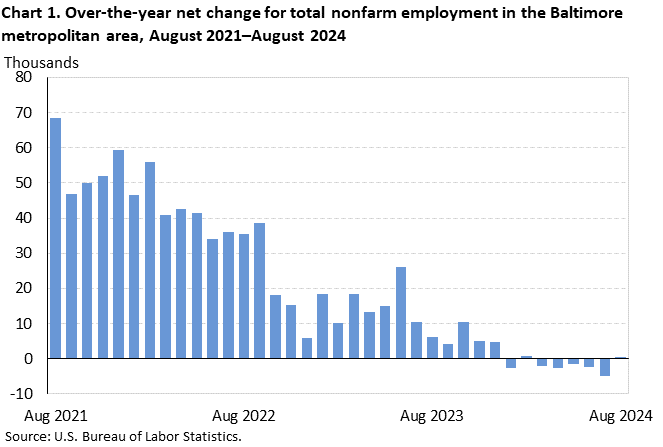
Total nonfarm employment for the Baltimore-Columbia-Towson, MD, metropolitan area stood at 1,420,800 in August, the U.S. Bureau of Labor Statistics reported today. (See chart 1 and table 1.) Regional Commissioner Alexandra Hall Bovee noted that, while employment levels in the Baltimore area were little changed over the year, the rate of increase nationally was 1.5 percent. (All data in this release are not seasonally adjusted; accordingly, over-the-year analysis is used throughout.)
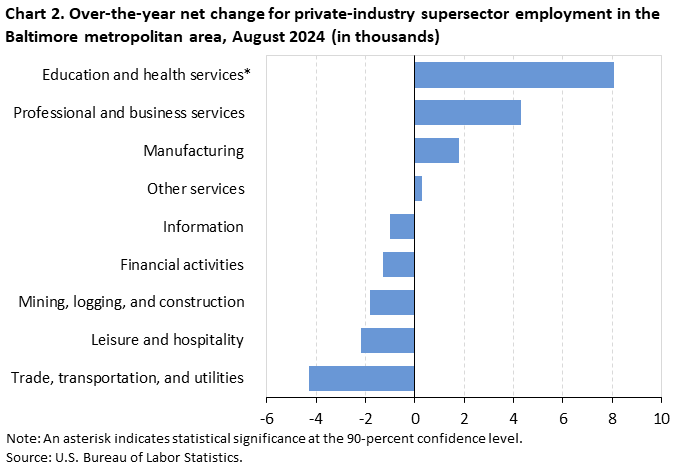
Industry employmentAmong the metropolitan area’s private-industry supersectors, education and health services gained 8,100 jobs over the year. (See chart 2.) The local area’s 3.0-percent increase compared to the 3.9-percent rise on a national level.
The Metropolitan Area Employment and Unemployment release for September 2024 is scheduled to be released on Wednesday, October 30, 2024, at 10:00 a.m. (ET).
Each year, Current Employment Statistics (CES) estimates are benchmarked to comprehensive counts of employment from the Quarterly Census of Employment and Wages (QCEW). These counts are derived from state unemployment insurance (UI) tax records that nearly all employers are required to file. As part of the benchmark process for benchmark year 2024, census-derived employment counts replace CES payroll employment estimates for all 50 states, the District of Columbia, Puerto Rico, the U.S. Virgin Islands, and about 450 metropolitan areas and divisions for the period from April 2023 to September 2024.
The Bureau of Labor Statistics (BLS) released first-quarter 2024 data from the QCEW on August 21, 2024, at 10:00 a.m. (ET). Preliminary benchmark revisions for March 2024 for all 50 states, the District of Columbia, and selected metropolitan areas at the total nonfarm level are available. The final benchmark revision for all state and metropolitan area series will be issued with the publication of the January 2025 State Employment and Unemployment news release in March 2025.
This release presents nonfarm payroll employment estimates from the CES program. The CES survey is a Federal-State cooperative endeavor between State employment security agencies and the U.S. Bureau of Labor Statistics. More information about the CES data is available in the State Employment and Unemployment Summary and the Metropolitan Area Employment and Unemployment Summary.
Definitions. Employment data refer to persons on establishment payrolls who receive pay for any part of the pay period which includes the 12th of the month. Persons are counted at their place of work rather than at their place of residence; those appearing on more than one payroll are counted on each payroll. Industries are classified on the basis of their principal activity in accordance with the 2022 version of the North American Industry Classification System.
Method of estimation. CES State and Area employment data are produced using several estimation procedures. Where possible these data are produced using a "weighted link relative" estimation technique in which a ratio of current-month weighted employment to that of the previous-month weighted employment is computed from a sample of establishments reporting for both months. The estimates of employment for the current month are then obtained by multiplying these ratios by the previous month's employment estimates. The weighted link relative technique is utilized for data series where the sample size meets certain statistical criteria. For some employment series, the estimates are produced with a model that uses direct sample estimates (described above) combined with other regressors to compensate for smaller sample sizes.
Annual revisions. Employment estimates are adjusted annually to a complete count of jobs, called benchmarks, derived principally from tax reports which are submitted by employers who are covered under state unemployment insurance (UI) laws. Further information on CES benchmark methods and recent benchmark revisions is available in the CES State and Area benchmark article.
Reliability of the estimates. The estimates presented in this release are based on sample surveys, administrative data, and modeling and, thus, are subject to sampling and other types of errors. Sampling error is a measure of sampling variability—that is, variation that occurs by chance because a sample rather than the entire population is surveyed. Survey data also are subject to nonsampling errors, such as those which can be introduced into the data collection and processing operations. Estimates not directly derived from sample surveys are subject to additional errors resulting from the specific estimation processes used. The sums of individual items may not always equal totals shown in the same tables due to rounding.
Employment estimates. Changes in metropolitan area nonfarm payroll employment are cited in the analysis of this release only if they have been determined to be statistically significant at the 90-percent confidence level. Reliability of state and area estimates for the total nonfarm employment series are available for metropolitan areas and metropolitan divisions.
Area definitions. The substate area data published in this news release reflect the delineations issued by the U.S. Office of Management and Budget on April 10, 2018.
The Baltimore-Columbia-Towson, MD Metropolitan Statistical Area includes Anne Arundel, Baltimore, Carroll, Harford, Howard, and Queen Anne’s Counties and Baltimore City in Maryland.
| Area | Back data | Aug 2023 | Jun 2024 | Jul 2024 | Aug 2024(1) | Aug 2023 to Aug 2024(1) | |
|---|---|---|---|---|---|---|---|
| Net change | Percent change | ||||||
United States | |||||||
Total nonfarm | 156,355 | 159,341 | 158,387 | 158,650 | 2,295 | 1.5 | |
Mining and logging | 652 | 637 | 641 | 644 | -8 | -1.2 | |
Construction | 8,263 | 8,413 | 8,463 | 8,497 | 234 | 2.8 | |
Manufacturing | 13,001 | 13,016 | 13,012 | 12,982 | -19 | -0.1 | |
Trade, transportation, and utilities | 28,712 | 29,017 | 28,974 | 28,924 | 212 | 0.7 | |
Information | 3,021 | 3,031 | 3,026 | 3,023 | 2 | 0.1 | |
Financial activities | 9,278 | 9,279 | 9,319 | 9,313 | 35 | 0.4 | |
Professional and business services | 22,980 | 23,071 | 23,047 | 23,068 | 88 | 0.4 | |
Education and health services | 25,218 | 26,143 | 26,095 | 26,190 | 972 | 3.9 | |
Leisure and hospitality | 17,306 | 17,611 | 17,691 | 17,594 | 288 | 1.7 | |
Other services | 5,895 | 5,989 | 5,988 | 5,959 | 64 | 1.1 | |
Government | 22,029 | 23,134 | 22,131 | 22,456 | 427 | 1.9 | |
Baltimore-Columbia-Towson Metropolitan Statistical Area | |||||||
Total Nonfarm | 1,420.4 | 1,425.0 | 1,419.2 | 1,420.8 | 0.4 | 0.0 | |
Mining, logging, and construction | 81.0 | 78.2 | 78.9 | 79.2 | -1.8 | -2.2 | |
Manufacturing | 59.1 | 60.7 | 61.1 | 60.9 | 1.8 | 3.0 | |
Trade, transportation, & utilities | 247.5 | 243.6 | 242.8 | 243.2 | -4.3 | -1.7 | |
Information | 16.3 | 15.5 | 15.5 | 15.3 | -1.0 | -6.1 | |
Financial activities | 79.4 | 77.6 | 78.0 | 78.1 | -1.3 | -1.6 | |
Professional & business services | 255.7 | 255.5 | 258.1 | 260.0 | 4.3 | 1.7 | |
Education & health services | 270.9 | 277.2 | 275.5 | 279.0 | 8.1 | 3.0 | |
Leisure & hospitality | 135.4 | 135.5 | 136.2 | 133.2 | -2.2 | -1.6 | |
Other services | 48.5 | 48.7 | 49.3 | 48.8 | 0.3 | 0.6 | |
Government | 226.6 | 232.5 | 223.8 | 223.1 | -3.5 | -1.5 | |
Baltimore City | |||||||
Total Nonfarm | 371.7 | 375.7 | 376.3 | 379.1 | 7.4 | 2.0 | |
Mining, logging, and construction | 9.7 | 9.2 | 9.4 | 9.3 | -0.4 | -4.1 | |
Manufacturing | 10.6 | 11.0 | 11.1 | 11.1 | 0.5 | 4.7 | |
Trade, transportation, & utilities | 44.4 | 43.3 | 43.1 | 43.3 | -1.1 | -2.5 | |
Information | 5.1 | 4.9 | 4.8 | 4.8 | -0.3 | -5.9 | |
Financial activities | 17.7 | 17.4 | 17.5 | 17.5 | -0.2 | -1.1 | |
Professional & business services | 57.9 | 58.8 | 59.7 | 61.2 | 3.3 | 5.7 | |
Education & health services | 114.5 | 116.5 | 117.0 | 118.3 | 3.8 | 3.3 | |
Leisure & hospitality | 26.8 | 27.4 | 27.4 | 26.6 | -0.2 | -0.7 | |
Other services | 11.6 | 12.0 | 12.2 | 12.1 | 0.5 | 4.3 | |
Government | 73.4 | 75.2 | 74.1 | 74.9 | 1.5 | 2.0 | |
Footnotes | |||||||
SOURCE: Current Employment Statistics - National - State and Metropolitan Area | |||||||
Last Modified Date: Thursday, September 26, 2024