An official website of the United States government
 United States Department of Labor

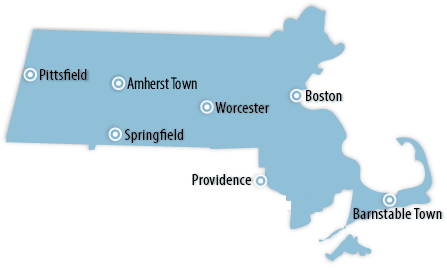
Total compensation costs for private industry workers increased 3.6 percent in the Boston-Worcester-Providence, MA-RI-NH, metropolitan area for the year ending in December 2025.
The Consumer Price Index for All Urban Consumers (CPI-U) for Boston-Cambridge-Newton was up 0.1 percent from November to January.
The Consumer Price Index for All Urban Consumers (CPI-U) in the Northeast region decreased 0.1 percent in November, the U.S. Bureau of Labor Statistics (BLS) reported today.
| Data Series | Back Data |
July 2025 |
Aug 2025 |
Sept 2025 |
Oct 2025 |
Nov 2025 |
Dec 2025 |
|---|---|---|---|---|---|---|---|
Civilian Labor Force(1) |
3,961.6 | 3,963.7 | 3,961.0 | (2)- | 3,953.8 | (p)3,946.0 | |
Employment(1) |
3,770.7 | 3,774.2 | 3,773.0 | (2)- | 3,766.5 | (p)3,757.2 | |
Unemployment(1) |
190.9 | 189.4 | 188.1 | (2)- | 187.4 | (p)188.8 | |
Unemployment Rate(3) |
4.8 | 4.8 | 4.7 | (2)- | 4.7 | (p)4.8 | |
Total Nonfarm(4) |
3,727.3 | 3,720.1 | 3,710.0 | 3,714.6 | 3,718.9 | (p)3,723.5 | |
12-month % change |
0.3 | 0.1 | -0.2 | 0.0 | 0.1 | (p)0.0 | |
Mining and Logging(4) |
1.1 | 1.1 | 1.1 | 1.1 | 1.1 | (p)1.1 | |
12-month % change |
10.0 | 10.0 | 10.0 | 0.0 | 0.0 | (p)0.0 | |
Construction(4) |
170.5 | 167.9 | 167.6 | 166.4 | 167.3 | (p)167.2 | |
12-month % change |
0.2 | -1.1 | -0.9 | -1.4 | 0.7 | (p)1.1 | |
Manufacturing(4) |
229.1 | 228.8 | 228.1 | 228.3 | 229.0 | (p)229.7 | |
12-month % change |
-0.6 | -0.7 | -0.8 | -1.0 | -0.3 | (p)0.1 | |
Trade, Transportation, and Utilities(4) |
563.4 | 563.8 | 559.2 | 560.5 | 559.1 | (p)557.4 | |
12-month % change |
0.8 | 1.0 | 0.0 | 0.6 | 0.7 | (p)0.2 | |
Information(4) |
92.4 | 92.2 | 92.5 | 92.3 | 92.0 | (p)92.1 | |
12-month % change |
0.7 | 1.5 | 0.9 | 0.7 | -0.1 | (p)0.3 | |
Financial Activities(4) |
227.7 | 227.7 | 227.9 | 228.2 | 228.6 | (p)227.9 | |
12-month % change |
1.0 | 1.4 | 1.4 | 0.9 | 0.6 | (p)0.1 | |
Professional & Business Services(4) |
618.1 | 618.8 | 618.1 | 620.3 | 624.7 | (p)623.7 | |
12-month % change |
-1.3 | -1.0 | -1.2 | -0.9 | 0.0 | (p)-0.4 | |
Education & Health Services(4) |
852.3 | 846.6 | 843.9 | 845.3 | 845.9 | (p)846.9 | |
12-month % change |
1.2 | 0.4 | -0.1 | 0.3 | 0.2 | (p)0.0 | |
Leisure & Hospitality(4) |
359.6 | 359.9 | 361.9 | 363.2 | 361.8 | (p)367.5 | |
12-month % change |
-0.4 | -0.2 | -0.3 | -0.2 | -1.4 | (p)-0.3 | |
Other Services(4) |
141.9 | 142.6 | 138.7 | 138.2 | 138.5 | (p)138.7 | |
12-month % change |
3.1 | 4.3 | 2.1 | 0.7 | 1.4 | (p)1.0 | |
Government(4) |
471.2 | 470.7 | 471.0 | 470.8 | 470.9 | (p)471.3 | |
12-month % change |
-0.2 | -1.2 | -0.5 | -0.1 | -0.1 | (p)-0.1 | |
|
Footnotes |
|||||||