
An official website of the United States government
An official website of the United States government
The .gov means it's official.
Federal government websites often end in .gov or .mil. Before sharing sensitive information,
make sure you're on a federal government site.
The site is secure.
The
https:// ensures that you are connecting to the official website and that any
information you provide is encrypted and transmitted securely.
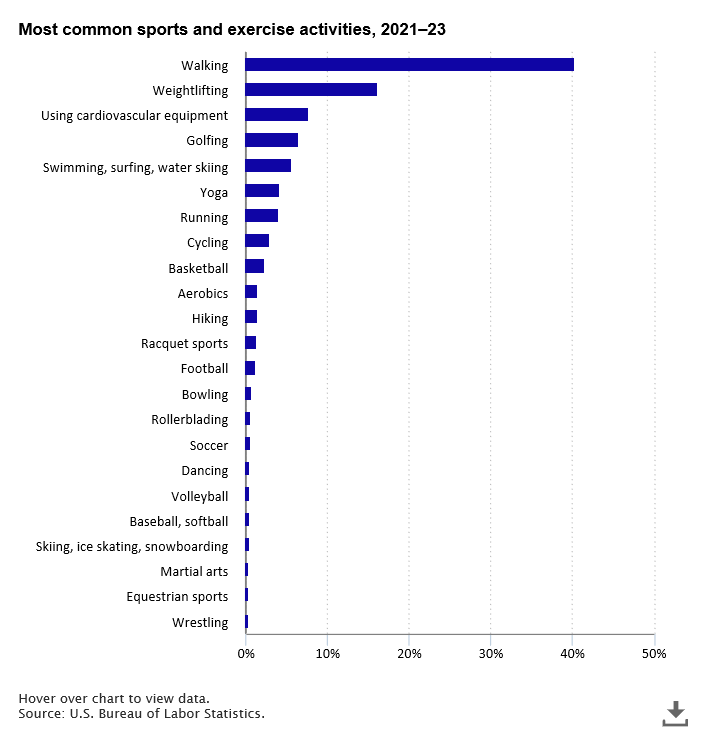
The first modern Olympic Games were in Athens, Greece, in 1896 and included nine sports. Today, the Olympic Opening Ceremony celebrates the 2024 Summer Games hosted in Paris, France, with over 10,000 athletes competing in 32 sports. Though not everyone can make it to the Olympics, many people across the ocean in the United States will be taking part in some of the same sports and exercise activities as those exceptional athletes.
read full article »
Full-time wage and salary workers age 25 and over with less than a high school diploma had median usual weekly earnings of $726 in the second quarter of 2024, high school graduates (no college) had earnings of $916, and those with some college or associate degree had earnings of $1,057. College graduates with a bachelor's degree only (no higher degree) had median weekly earnings of $1,541, and graduates with advanced degrees earned $1,897.

Self-care can be making time for an appointment, taking a walk, reading, socializing, or even just curling up for a nap. But the first thing that comes to mind for many may be relaxing with a massage or mani-pedi.

U.S. export prices rose 0.7 percent from June 2023 to June 2024, after recording an increase of 0.5 percent for the 12 months ended May 2024. These were the first 12-month increases in export prices since January 2023. For the year ended June 2024, agricultural export prices declined 4.8 percent while nonagricultural prices rose 1.4 percent.
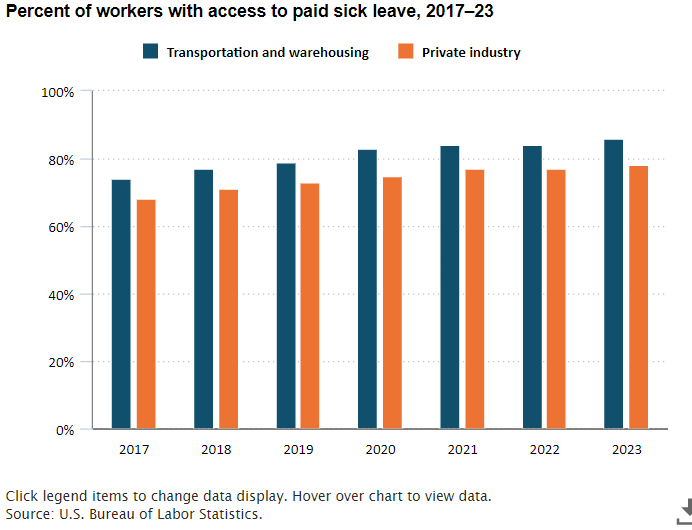
In 2017, 74 percent of private transportation and warehousing workers had access to paid sick leave. The percentage of workers with access to paid sick leave has since increased to 86 percent in 2023. Among all private industry workers in 2023, 78 percent of workers had access to paid sick leave.

